When your application experiences CPU spikes, slow response times, or unresponsive threads, you need visibility into what each thread is doing at the code level. Thread profiling in Enterprise Distributed Application Service (EDAS) samples and aggregates the method stacks of all application threads every 5 minutes, giving you a timeline of CPU time per thread and thread counts by state. This helps you review the code execution process and identify the thread or method that consumes the most CPU resources.
Use thread profiling to diagnose:
Unexpected CPU utilization spikes across a cluster
Slow methods identified in your application
Threads stuck in BLOCKED state, indicating lock contention
Supported editions
Thread profiling is available in Professional Edition and Platinum Edition. Standard Edition does not support this feature.
How thread profiling works
Every 5 minutes, EDAS captures a snapshot of the method stack for each thread in your application. These snapshots are aggregated into two complementary views:
CPU Time Consumption (ms) -- Total CPU time each thread consumed during the sampling interval. Higher values indicate threads actively using CPU resources.
Thread Count -- Number of threads in each state over time. A sudden increase in total thread count or a spike in BLOCKED threads often signals a problem.
Correlating these two metrics helps you distinguish between:
| Pattern | Likely cause |
|---|---|
| High CPU time, active threads | CPU-intensive code path (hot loop, heavy computation) |
| Low CPU time, many BLOCKED threads | Lock contention between threads |
| Thread count growing steadily over time | Thread pool misconfiguration or thread leak |
Navigate to thread profiling
Log on to the EDAS console.
In the left-side navigation pane, choose Application Management > Applications.
In the top navigation bar:
Select a region.
Select a microservices namespace from the Microservices Namespace drop-down list.
Select Kubernetes Cluster from the Cluster Type drop-down list.
Click the name of your application.
In the left-side navigation pane of the application details page, choose Monitor > Application Diagnosis-Threads.
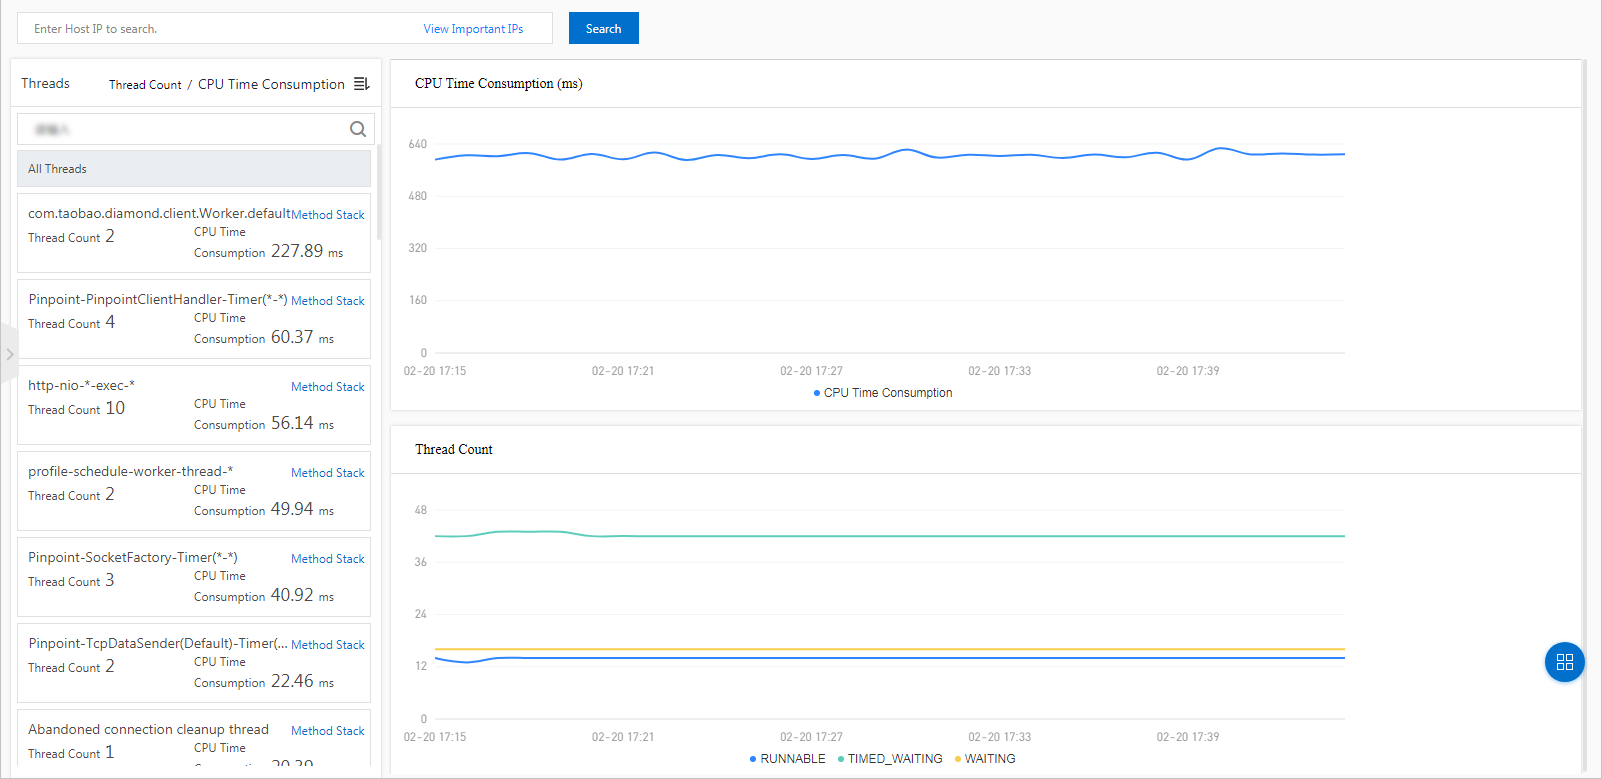
On the Threads Profiling page, all threads of the application are listed on the left, with CPU Time Consumption (ms) and Thread Count graphs on the right.
Identify high-CPU threads
On the Threads Profiling page, sort or scan the thread list on the left by CPU time consumption to find outliers.
Select a thread to display its CPU Time Consumption (ms) and Thread Count graphs.
Analyze the graphs:
A sustained high CPU time value indicates the thread is running CPU-intensive work.
An unusually high total number of threads per minute may indicate thread pool misconfiguration or a thread leak.
Analyze method stacks
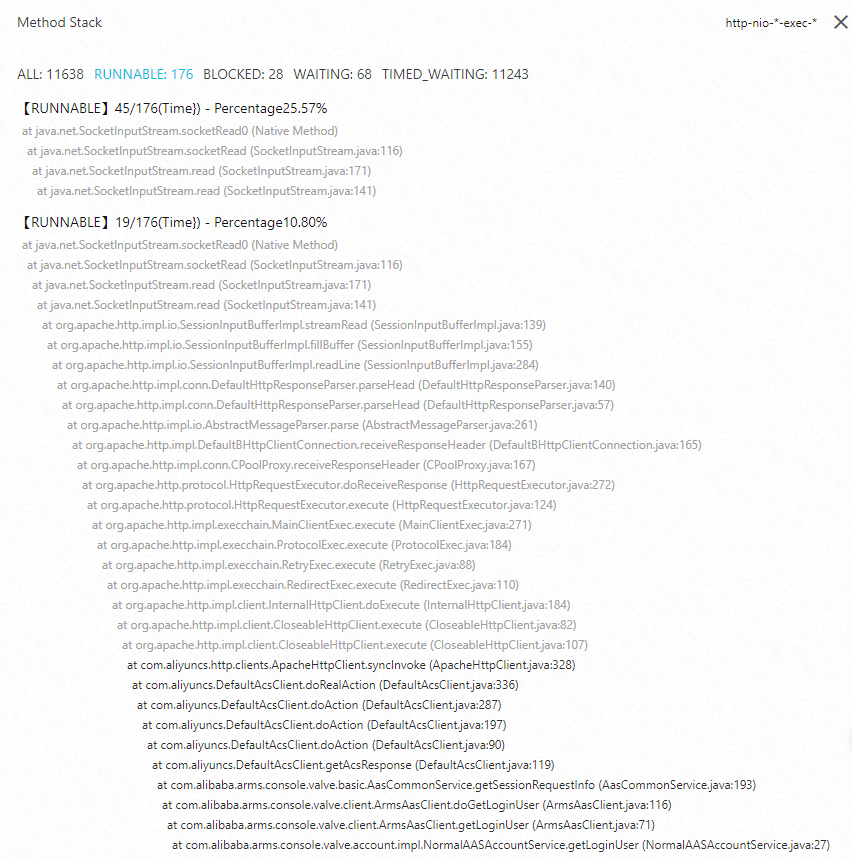
After you identify an abnormal thread, inspect its method stack to find the exact code path causing the issue.
Click Method Stack for the target thread.
Review the method stack that ran during the selected time period. The stack trace shows the call hierarchy from top-level entry points down to the methods where time was spent.
Focus on threads in BLOCKED state. By viewing the method stack of threads in the BLOCKED state, you can identify the relevant code block and optimize it to reduce CPU utilization.
Diagnosis reference
| Symptom | What to check | Action |
|---|---|---|
| High overall CPU | Sort threads by CPU Time Consumption (ms) to find top consumers | Review the method stack of the highest-CPU thread to find hot code paths |
| Many BLOCKED threads | Check Thread Count for spikes in BLOCKED state | Open the Method Stack of a BLOCKED thread to identify the contested lock |
| Thread count growing over time | Monitor Thread Count trend across sampling intervals | Investigate thread leaks in thread pool configurations |
| Intermittent CPU spikes | Compare CPU Time Consumption (ms) across multiple 5-minute intervals | Look for periodic tasks or scheduled jobs triggering the spikes |
What to do next
After you identify the root cause through thread profiling:
Lock contention: Review synchronized blocks in your code. Consider using concurrent data structures or reducing lock scope.
CPU-intensive hot paths: Optimize the algorithm, add caching, or offload work to asynchronous processing.
Thread leaks: Verify that thread pools have proper maximum sizes and idle thread timeout settings.
To monitor other application metrics, explore the diagnostic tools under Monitor in the application details page.