When you run microservices on Enterprise Distributed Application Service (EDAS), you need a single page that surfaces request volume, latency, garbage collection pressure, and infrastructure utilization so you can detect anomalies without switching between tools. The application overview page in the EDAS console consolidates these metrics with week-on-week and day-on-day comparisons, helping you spot regressions and correlate application-level symptoms with system-level causes.
Go to the application overview page
Log on to the EDAS console.
In the left-side navigation pane, choose Application Management > Applications.
On the Applications page, select a region in the top navigation bar. From the Microservices Namespace drop-down list, select a microservices namespace. From the Cluster Type drop-down list, select ECS Clusters. Click the name of the application that you want to manage.
In the left-side navigation pane, choose Application Monitoring > Application Overview.
Summary metrics
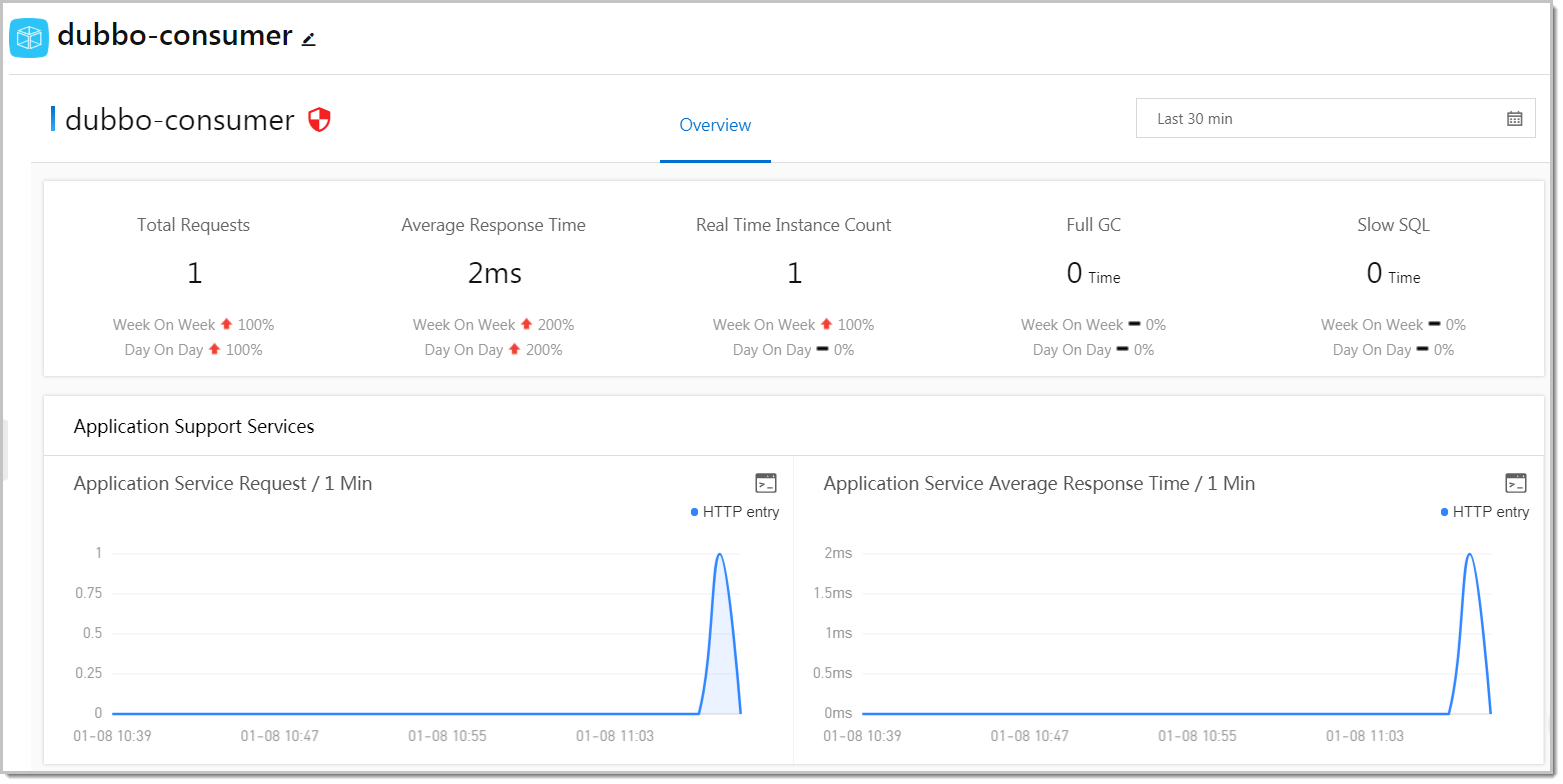
Five indicators appear at the top of the Overview tab. Each indicator includes week-on-week and day-on-day change rates so you can distinguish expected traffic patterns from unexpected anomalies.
| Metric | Description | What to investigate |
|---|---|---|
| Total requests | Total inbound request volume for the selected time range. | A sudden spike may indicate a traffic surge. A sudden drop may indicate an upstream failure or routing issue. |
| Average response time | Mean latency across all requests. | Rising latency often signals resource contention or slow downstream calls. Compare with CPU utilization and dependent service response times. |
| Real-time instances | Number of running application instances. | Compare against expected capacity. A lower-than-expected count may explain elevated response times. |
| Full GCs | Number of full garbage collections. | Frequent full GCs indicate memory pressure and can cause latency spikes. Correlate with memory usage in System Info. |
| Slow SQL queries | Number of database queries exceeding the slow query threshold. | A high count suggests database-level bottlenecks. Review query plans and indexing. |
Compare week-on-week and day-on-day change rates to separate recurring patterns (such as weekly traffic peaks) from new issues. A metric that is stable week-on-week but degraded day-on-day may point to a recent deployment.
Investigate service-level metrics
The Overview tab displays time series charts for both the services your application provides and the services it depends on. Use these charts to narrow down whether a performance issue originates from your application or from a downstream dependency.
Application Support Services
Time series curves for the services your application exposes to upstream callers:
| Chart | Description | When to use |
|---|---|---|
| Request count | Inbound call volume over time. | Identify traffic spikes, drops, or shifts in request distribution across services. |
| Average response time | Latency of responses your application returns to callers. | Degradation here directly affects upstream consumers. If response time rises while request count stays flat, look at dependent services or system resources. |
Application Dependent Services
Time series curves for the services your application calls:
| Chart | Description | When to use |
|---|---|---|
| Request count | Outbound call volume to downstream services. | Identify which downstream services receive the most traffic from your application. |
| Average response time | Latency of downstream calls. | Spikes here often explain elevated response times in the summary metrics. |
| Application instances | Instance count over time. | Correlate instance scaling events with performance changes. A drop in downstream instances may cause increased latency. |
| HTTP status codes | Distribution of response codes from dependent services. | Watch for increases in 4xx (client errors) or 5xx (server errors) as indicators of downstream failures. |
Monitor system resources
The System Info section displays infrastructure-level time series curves. Use these metrics alongside the application-level charts above to determine whether a performance issue is caused by code-level problems or resource constraints.
| Chart | Description | What to investigate |
|---|---|---|
| CPU utilization | Percentage of CPU in use across application hosts. | Sustained high utilization may require scaling out or optimizing compute-intensive operations. Correlate CPU spikes with response time increases. |
| Memory usage | Percentage of memory consumed. | Rising memory usage combined with frequent full GCs (see summary metrics) may indicate a memory leak. |
| Load | System load average. | Compare the load value against the number of available CPU cores. A load consistently higher than the core count indicates the host is overloaded. |
Troubleshooting workflow
When you notice an anomaly in the summary metrics, use the following approach to narrow down the root cause:
Check the summary metrics. Identify which indicators deviate from their baseline. For example, if average response time rises while total requests remain stable, the issue is likely not traffic-related.
Examine dependent services. Check the Application Dependent Services charts for latency spikes or elevated error codes. If a downstream service shows increased 5xx responses, the issue may originate there.
Review system resources. Check CPU utilization, memory usage, and load. If CPU is saturated or memory usage is climbing with frequent full GCs, the issue may be resource-level rather than service-level.
Correlate across layers. Compare the timing of anomalies across application metrics and system metrics. For example, a spike in response time that coincides with a CPU spike and a recent deployment suggests the deployment introduced a resource-intensive code path.