When API response times spike or error rates climb, you need to quickly identify whether the bottleneck is a slow database query, a failing downstream service, or a code-level exception. The Interface Call feature in Enterprise Distributed Application Service (EDAS) tracks how each API in your application handles requests, providing SQL analysis, NoSQL analysis, error breakdowns, dependency mapping, and distributed trace drill-downs so you can isolate root causes without switching between tools.
The monitoring agent automatically detects APIs in the following frameworks:
| Type | Supported frameworks |
|---|---|
| Web frameworks | Tomcat 7+, Jetty 8+, Resin 3.0+, Undertow 1.3+, WebLogic 11.0+, SpringBoot 1.3.0+ |
| RPC frameworks | HSF 2.0+, Dubbo 2.5+ |
Open the Interface Call page
Log on to the EDAS console.
In the left-side navigation pane, choose Application Management > Applications.
In the top navigation bar, select a region. Select a namespace from the Microservice Namespace drop-down list, and select ECS Clusters from the Cluster Type drop-down list.
Click the name of the target application.
In the left-side navigation pane, choose Application Monitoring > Interface Call.
Identify problematic APIs
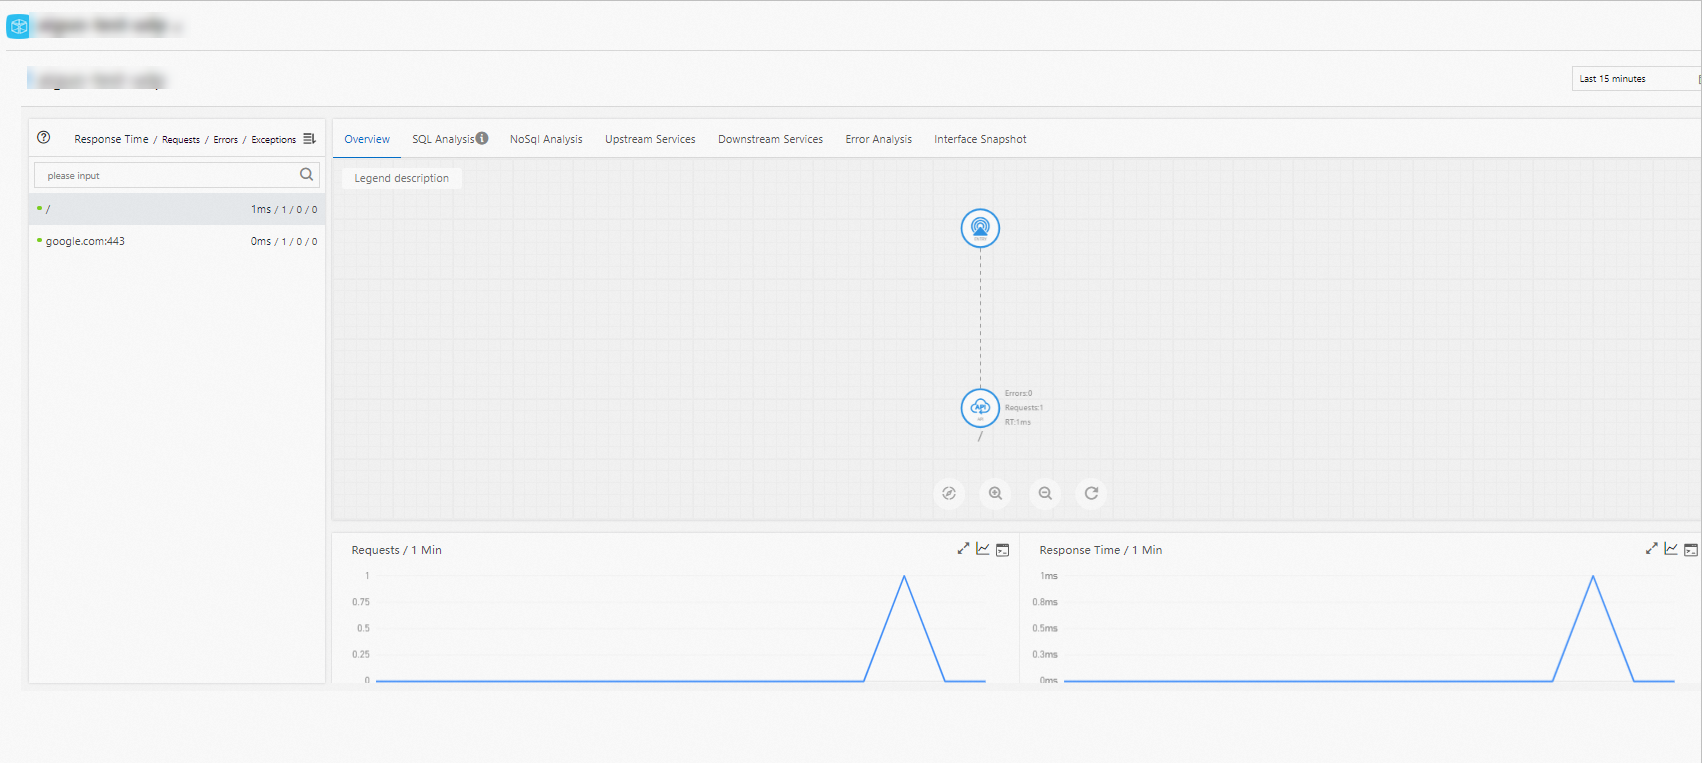
The Overview tab lists all APIs detected by the monitoring agent. Sort by response time, request count, or exception count to surface the APIs that need attention.
Select an API to view:
API topology -- a visual map showing how the selected API connects to upstream callers and downstream dependencies.
HTTP status code statistics -- the distribution of status codes returned by the API.
Time-series charts -- request volume, response time, and error count over time.
Analyze SQL performance
The SQL Analysis tab shows all database queries triggered by the selected API. Use it to identify the databases that have slow SQL queries.
Available metrics:
| Metric | Description |
|---|---|
| Query count | How many times each SQL statement ran |
| Query time | Execution duration per query |
Analyze NoSQL performance
The NoSQL Analysis tab displays SQL queries executed per minute by the selected API. Use it to find queries with excessive latency.
To investigate a specific query, click Interface Snapshot to view the complete distributed trace where that query executed.
Diagnose errors
The Error Analysis tab surfaces two categories of issues:
Application errors -- exceptions thrown by application code.
HTTP status codes -- HTTP status codes returned by the API.
Click a value in the TraceId column to open the full distributed trace on a separate page. The trace shows the exact call chain that produced the error, helping you isolate the root cause.
Inspect service dependencies
Use the Upstream Services and Downstream Services tabs to determine whether a performance issue originates in your application or in a dependency.
Upstream Services -- services that call your application.
Downstream Services -- services your application calls.
For each dependency, three performance metrics are available:
| Metric | Description |
|---|---|
| Request count | Total number of requests between the two services |
| Response time | Latency of calls to or from the dependency |
| Error count | Number of failed requests |
Available actions
| Action | How |
|---|---|
| Show or hide all APIs | Click Collapse/Expand All at the top of the tab |
| Search for a specific API | Enter a keyword (application name or API name) in the search box and click the search icon ( |
| Expand or collapse an API's metrics | Click the collapsible panel or the arrow at the end of the row |
Query individual traces
Select an API on the left side of the page. The Trace Query tab then lists every recorded invocation with the following details:
| Field | Description |
|---|---|
| Time | When the call started |
| API name | The specific API endpoint that was called |
| Application | The application that processed the request |
| Time consumed | End-to-end duration of the call |
| Status | Whether the call succeeded or failed |
| Trace ID | A unique identifier that links all spans in the distributed trace |
Click a trace ID to drill down into the full call chain.
Typical troubleshooting workflow
When response times spike or error rates climb, use the Interface Call tabs together to narrow down the cause:
Start on the Overview tab. Sort by response time or error count to identify the problematic API.
Check SQL Analysis and NoSQL Analysis to determine whether a slow database query is the bottleneck.
Open Error Analysis to review recent exceptions and HTTP error codes. Click a TraceId to inspect the full trace.
Switch to Upstream Services and Downstream Services to check whether the issue originates in a dependency rather than in your application.
Use Trace Query to examine individual calls in detail and confirm the root cause.