The Application Real-Time Monitoring Service (ARMS) agent automatically discovers and monitors common methods in your application. If ARMS does not detect a method you need to track, you can add it as a custom monitored method.
When to add a custom method
Add a custom method when:
ARMS does not auto-detect a method you want to monitor.
You need a specific method to appear in the local method stack for debugging.
You want to designate a method as a business entry point for trace-based queries.
Key concepts
| Concept | Description |
|---|---|
| Custom method | A manually specified method that ARMS monitors alongside auto-discovered methods. Custom methods appear in the local method stack. |
| Call Entrance | Marks a method as a business entry point. When enabled, the method generates trace data, and its APIs appear on the Interface Invocation page. |
Add a custom method
Prerequisites
Before you begin, make sure that you have:
An application deployed on a Kubernetes cluster in Enterprise Distributed Application Service (EDAS)
The ARMS agent enabled for the application
The name of the method you want to monitor
Open the monitoring configuration
Log on to the EDAS console.
In the left-side navigation pane, choose Application Management > Applications.
In the top navigation bar, select a region. In the upper part of the page, select a microservice namespace. From the Cluster Type drop-down list, select Kubernetes Cluster.
Find the target application and click its name in the Application Name column.
In the left-side navigation pane, choose Application Settings > Application Monitoring Configuration.
Click the Monitoring Method Customization tab.
Configure the custom method
On the Monitoring Method Customization tab, click Add Method in the upper-right corner.
In the Add Custom Method dialog box, configure the following parameters.
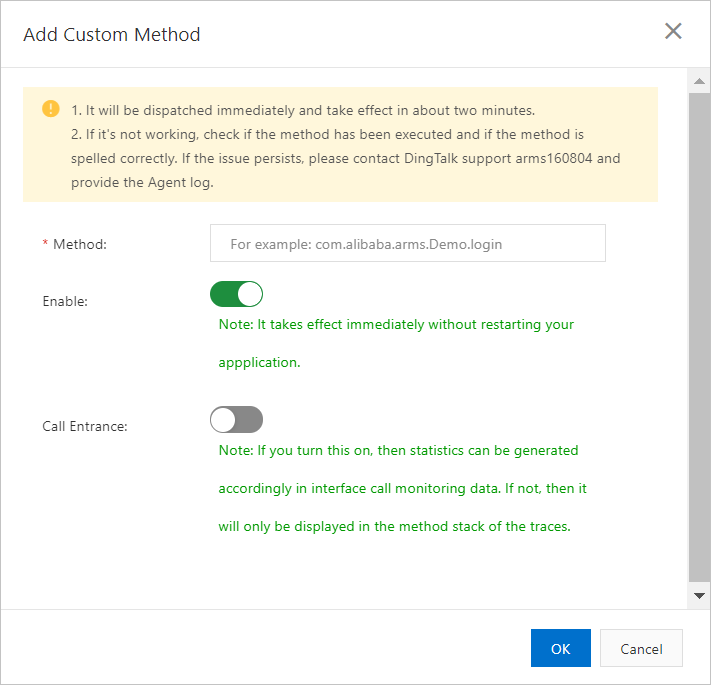
Parameter Description Default Method The name of the custom method. The name must be unique within the application. N/A Enable Turns monitoring on or off for this method. When enabled, the method appears in the local method stack. You can toggle this at any time without restarting the application. On Call Entrance Sets this method as a business entry point. When enabled, you can query business data based on traces, and the corresponding APIs appear on the Interface Invocation page. For more information, see Service and API monitoring. Off Click OK.
The custom method appears in the method list immediately.
Verify and manage custom methods
After you add a custom method:
If you enabled Call Entrance, go to the Interface Invocation page to verify that the method's APIs appear in traces.
To temporarily stop monitoring a method, toggle its Enable switch off. No application restart is required.