CloudMonitor automatically collects resource data from your Alibaba Cloud account. Use it to view monitoring charts for your elastic container instances, set alert rules, and get notified when metrics exceed thresholds.
If you're already familiar with CloudMonitor and want to go straight to viewing data, see View monitoring data.
Available metrics
CloudMonitor monitors the following metrics for elastic container instances:
| Category | Metric | Description | Applies to |
|---|---|---|---|
| Instances | instance_cpu_utilization | CPU utilization | All instances |
| Instances | instance_memory_utilization | Memory utilization | All instances |
| GPU | gpu_memory_used | GPU memory usage | GPU-accelerated instances only |
| GPU | gpu_memory_utilization | GPU memory utilization | GPU-accelerated instances only |
| GPU | gpu_utilization | GPU utilization | GPU-accelerated instances only |
| Volume | volume_space_total | Total storage space capacity | Temporary storage and mounted disk volumes only |
| Volume | volume_space_used | Used storage space capacity | Temporary storage and mounted disk volumes only |
| Volume | volume_space_utilization | Storage space utilization | Temporary storage and mounted disk volumes only |
| Volume | volume_inode_total | Available inode capacity | Temporary storage and mounted disk volumes only |
| Volume | volume_inode_used | inode usage | Temporary storage and mounted disk volumes only |
| Volume | volume_inode_utilization | inode utilization | Temporary storage and mounted disk volumes only |
GPU metrics are available only for GPU-accelerated elastic container instances based on GPU-accelerated Elastic Compute Service (ECS) instance families (for example, ecs.gn7).
Volume metrics apply only to temporary storage (EphemeralVolume) and mounted disk volumes. Other volume types are not covered.
On Linux instances, inodes store metadata about files—type, size, permissions, owner, link count, timestamps, and pointers to data blocks. If inode utilization reaches 100%, no new files or directories can be created.
For the full metric list with units and dimensions, see Metrics of elastic container instances.
View monitoring data
View the status and metric data of your elastic container instances in the CloudMonitor console.
Log on to the CloudMonitor console.
In the left-side navigation pane, choose Cloud Service Monitoring > Cloud Service Monitoring.
On the Cloud Service Monitoring page, select Elastic Container Instance (ECI).
In the top navigation bar, select a region.
In the instance list, click the ID of the instance whose monitoring data you want to view.
Select a metric category:
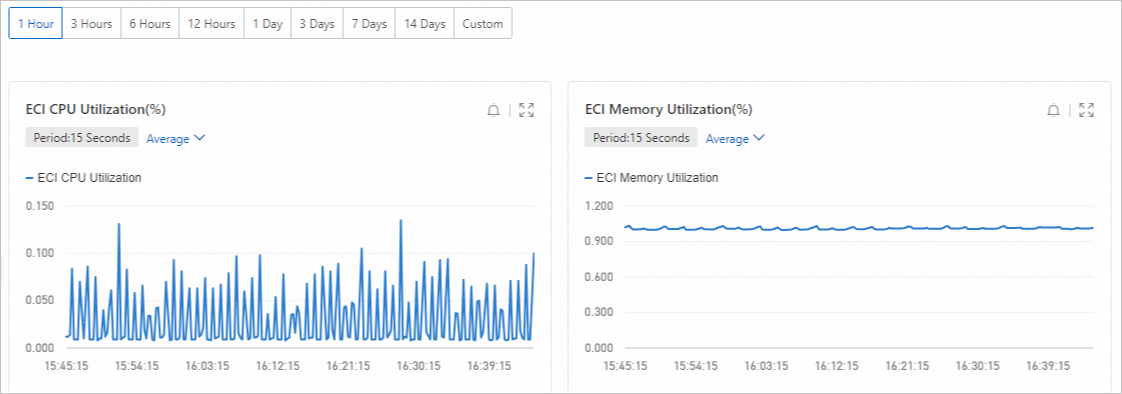
Default Group: CPU and memory metrics.
GPU: GPU-related metrics. Displayed only for GPU-accelerated instances based on GPU-accelerated ECS instance families such as ecs.gn7.
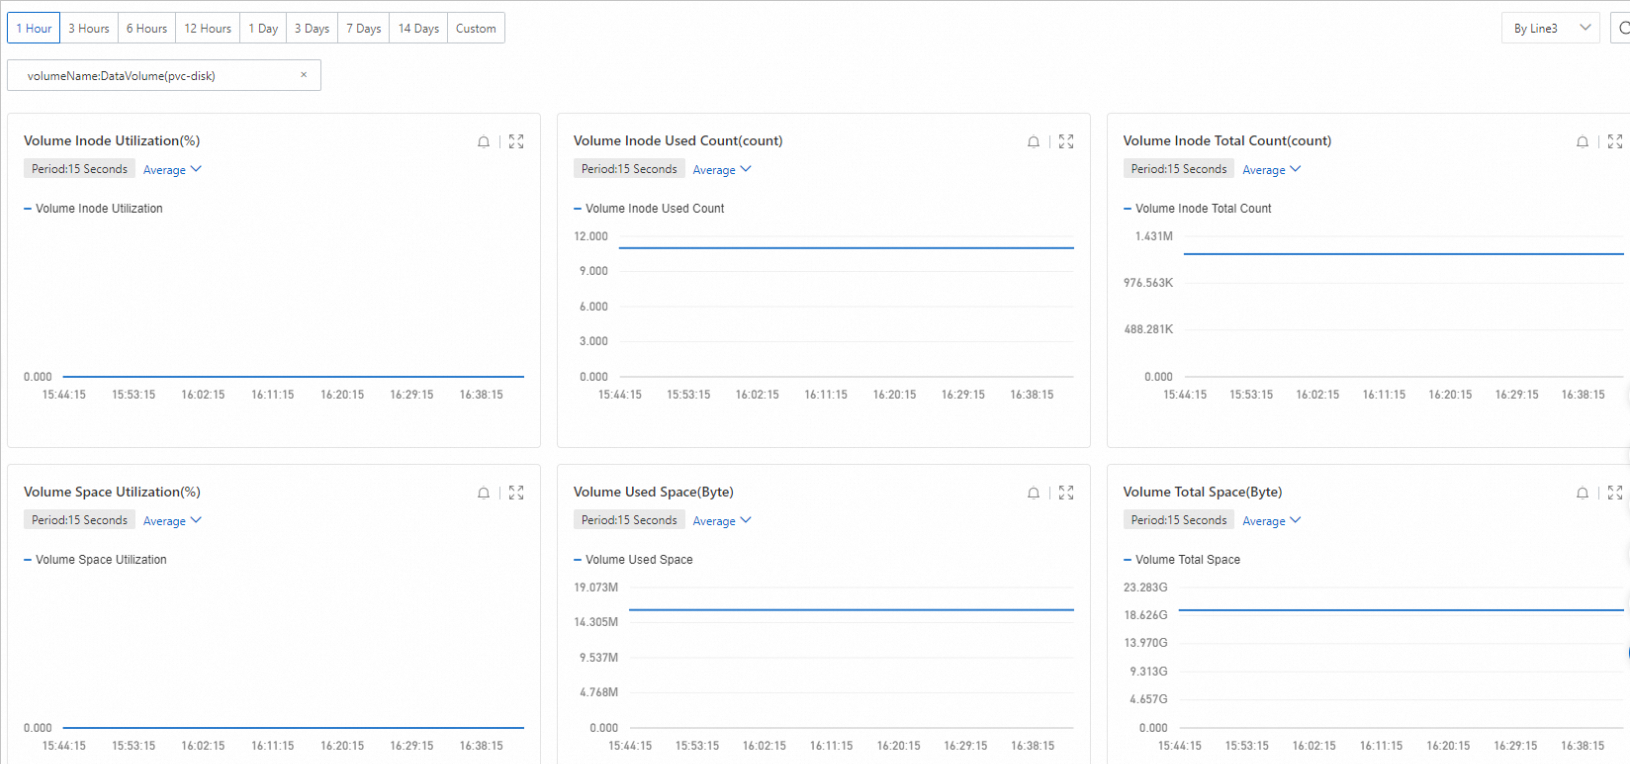
Volume: Storage metrics for temporary storage (EphemeralVolume) and mounted disk volumes. Other volume types are not displayed.
Select or specify a time range.
You can view up to 30 consecutive days of monitoring data at a time.
Default group
Volume
What's next
You can configure alert rules for metrics of elastic container instances. For example, set an alert rule for CPU utilization higher than 80%. When the monitoring data meets the alert rules, CloudMonitor automatically sends an alert notification. This helps you understand the resource status and handle exceptions.
For a step-by-step example, see Use CloudMonitor to obtain information about instances whose storage spaces are insufficient.