When you create an Elastic Container Instance (ECI) pod in a Kubernetes cluster, the ECI pod runs on a virtual node. Because there are no real nodes, disks are associated with pods instead of nodes. Therefore, you must configure pod-level disk monitoring to track disk-related metrics. This topic describes how to use Application Real-Time Monitoring Service (ARMS) Prometheus to monitor disks for ECI pods and how to customize a disk monitoring dashboard in Grafana.
Prerequisites
You have created an ACK Serverless cluster and connected it to ARMS Prometheus for monitoring. For more information, see Connect to Prometheus Monitoring.
You have created a Grafana workspace that is not a shared version, completed data migration, and integrated Alibaba Cloud services. For more information, see Create a Grafana workspace and Integrate Alibaba Cloud services.
ImportantBy default, the Grafana workspace that is used when you connect to ARMS Prometheus is a shared version. Shared versions do not support custom dashboards.
The steps in this topic use Grafana 10.0.X as an example. If you use a different version, you may need to adjust the steps accordingly.
Procedure
Log on to the ARMS console.
Open the Grafana page.
In the navigation pane on the left, choose .
Find the target workspace and click the URL in the URL column to open the Grafana logon page.
Enter your account information and log on to Grafana.
You can log on to Grafana using the admin account and the password that you set when you created the workspace, or you can use another account.
In the upper-left corner of the Grafana page, click the
 icon and then click Dashboards in the navigation bar.
In the upper-right corner of the Dashboards page, click New and select Import.
Click Upload dashboard JSON file and select the JSON file.
The JSON file contains the dashboard configuration. Sample file: ECI_Pod_Disk.
Set the dashboard folder and data source to the target cluster.
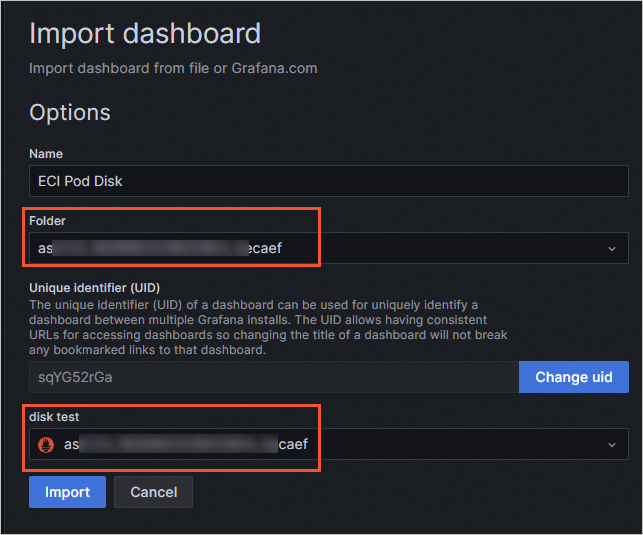
Click Import.
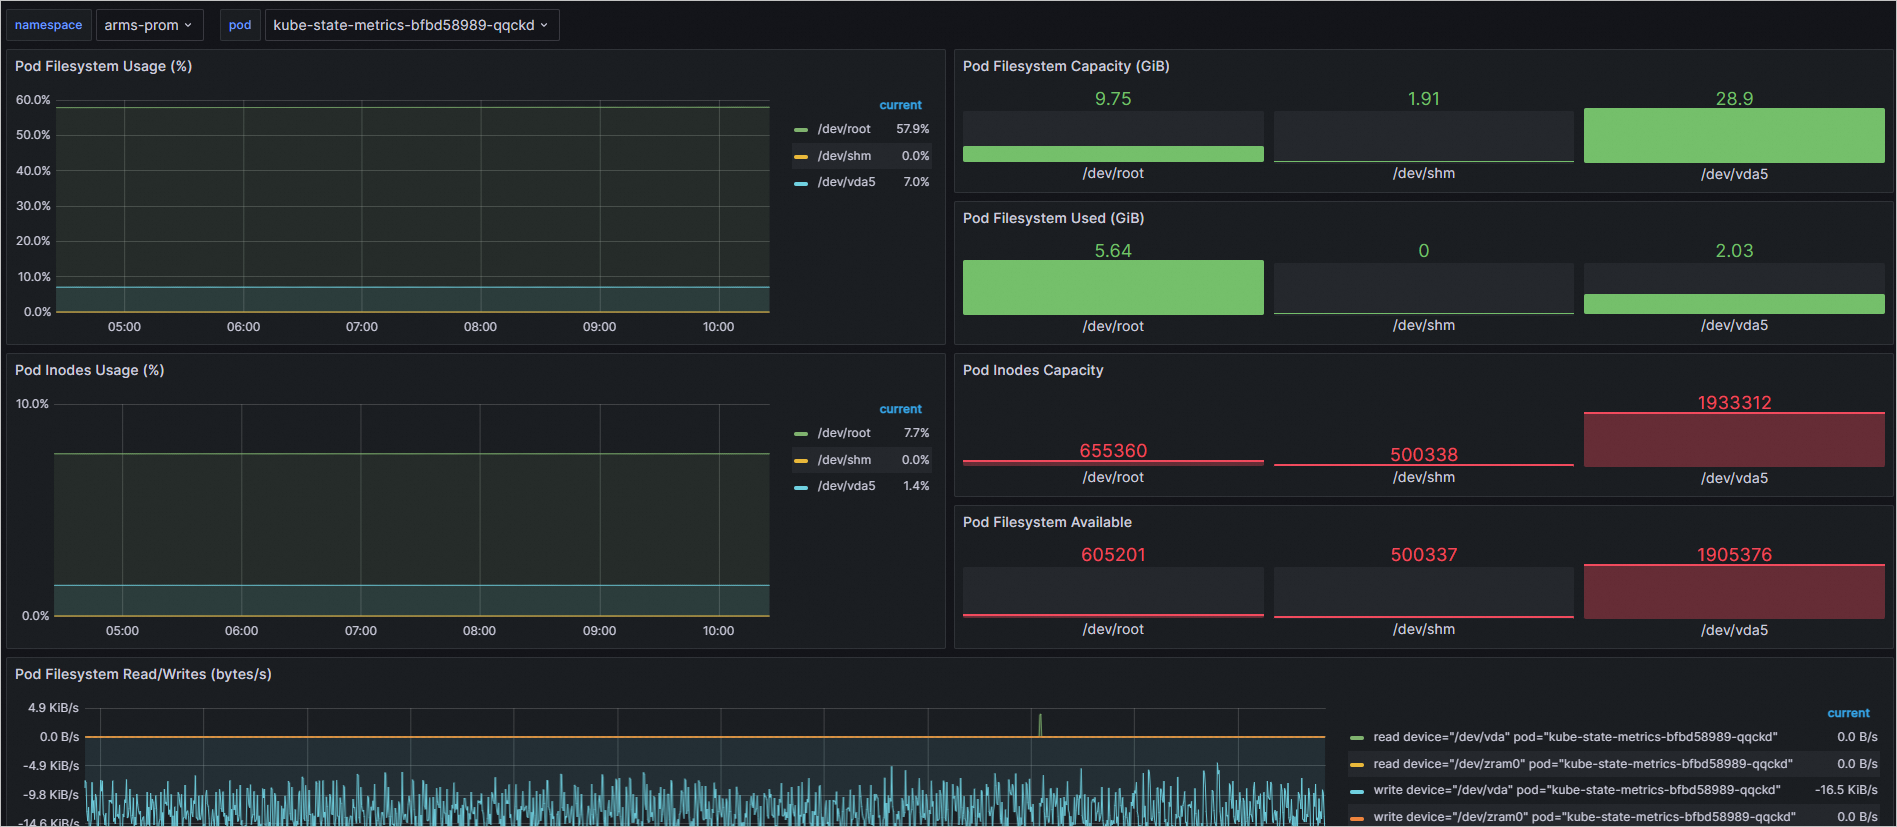
After the import is complete, you can view the disk monitoring information for the ECI pods in the new disk monitoring dashboard.
(Optional) To filter and view monitoring data at the deployment or StatefulSet level, you can copy the relevant panel from the current disk monitoring dashboard to a deployment or StatefulSet dashboard. Alternatively, you can modify the settings directly on the current dashboard.
To add a filter variable, modify the dashboard settings as follows:
In the disk monitoring dashboard on the Grafana page, click the
 icon in the upper-right corner.
On the Settings page, in the navigation pane on the left, click Variables.
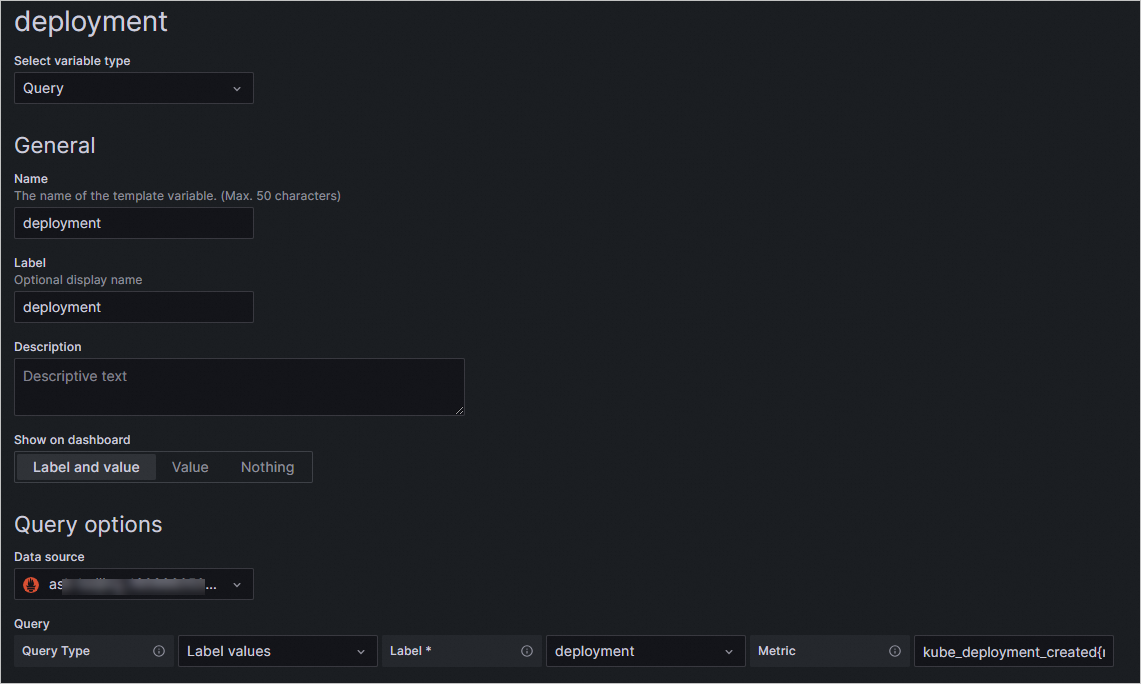
Click New variable, configure the General and Query Options, and then click Apply.
When you add a variable, set the Query based on the required variable type. The following table provides examples.
Type
Query Type
Label *
Metric
deployment
Label_values
deployment
kube_deployment_created{namespace=~"$namespace"}
statefulset
Label_values
statefulset
kube_statefulset_created{namespace=~"$namespace"}
The following figure shows an example of adding a deployment variable.
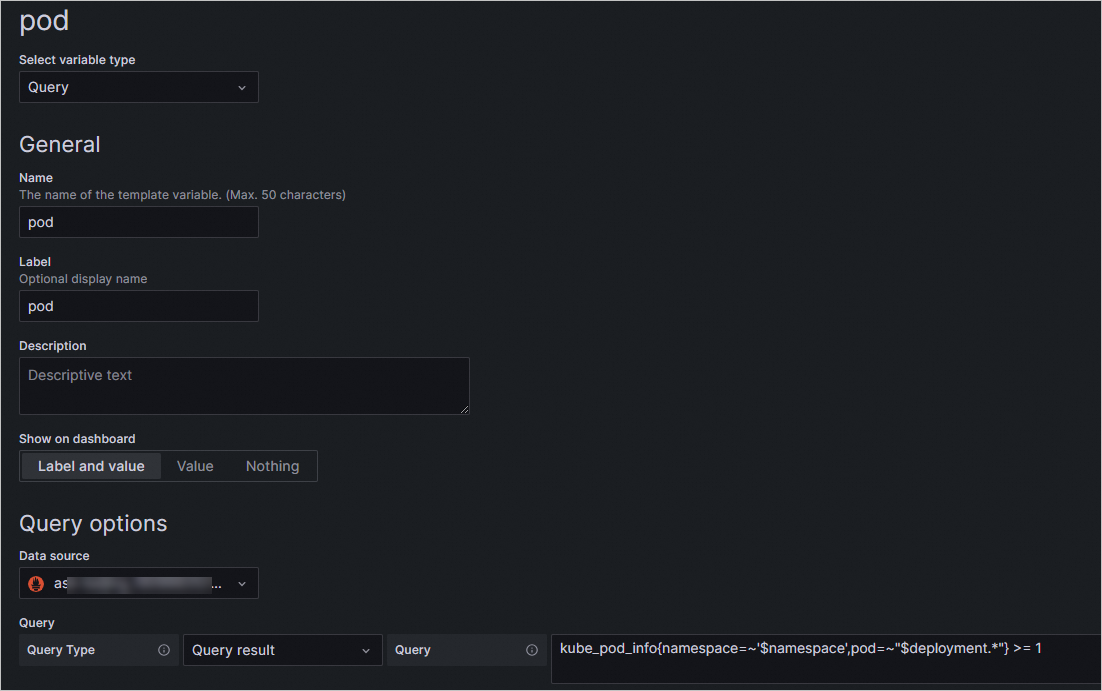
Click the pod variable, modify the query, and then click Apply.
Modify the query for the pod variable based on the variable type that you added in the previous step. The following table provides examples.
Type
Query Type
Query
deployment
Query_result
kube_pod_info{namespace=~'$namespace',pod=~"$deployment.*"} >= 1
statefulset
Query_result
kube_pod_info{namespace=~'$namespace',pod=~"$statefulset.*"} >= 1
The following figure shows an example of modifying the query for the pod variable for a deployment.
Adjust the order of the variables so that the deployment (or StatefulSet) variable is above the pod variable.
NoteClick and drag the
 icon to move the variable.
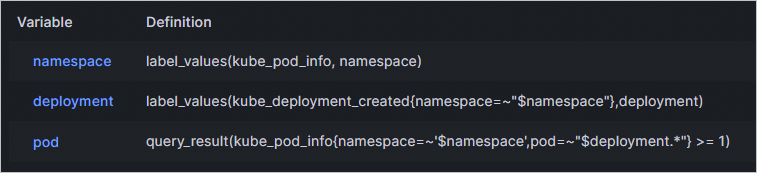
In the upper-right corner, click Save dashboard. Enter a description and click Save.
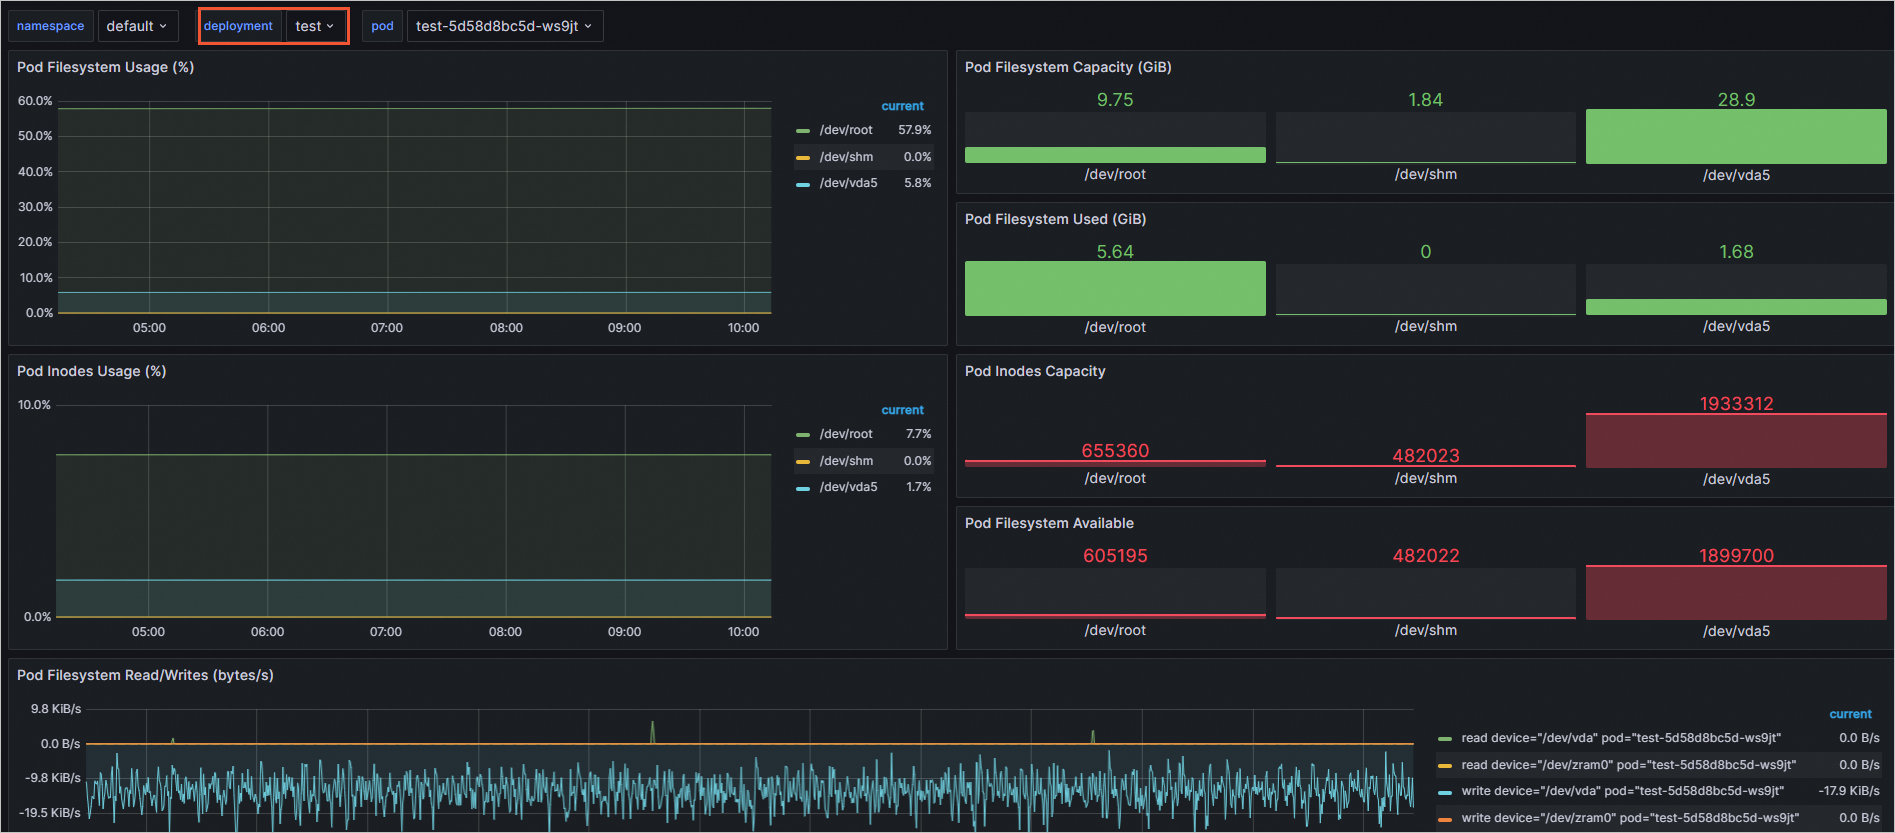
Return to the disk monitoring dashboard to verify that the filter feature is working correctly.
The following figure shows an example where the deployment-level filter is active.