After you submit jobs to an Elastic High Performance Computing (E-HPC) cluster, you can monitor the jobs and view the numbers of running, submitted, queuing, and completed jobs in the E-HPC console. This way, you can adjust the cluster and job configurations in real time based on the status of the jobs.
Prerequisites
The scheduler of the cluster is PBS.
The version of the E-HPC client is 1.2.16 or later.
Procedure
Log on to the E-HPC console.
In the top navigation bar, select a region.
In the left-side navigation pane, choose .
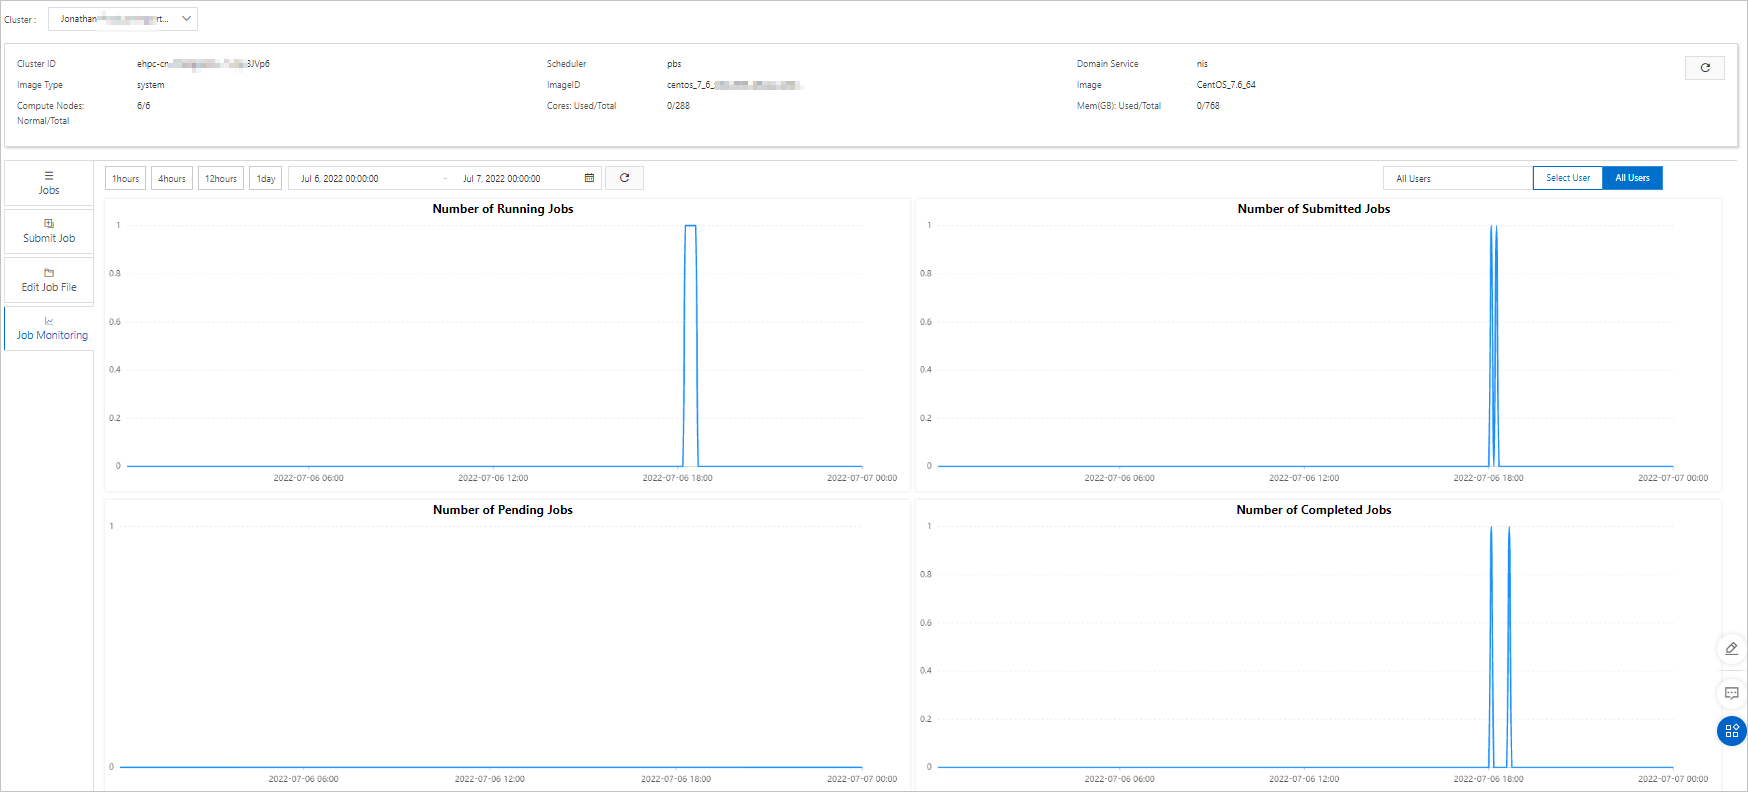
On the Jobs page, select a cluster from the Cluster drop-down list and click the Job Monitoring tab.
Configure filters.
The following filters are supported:
Time range: You can query the job data of the last 1 hour, 4 hours, 12 hours, or 1 day. You can also specify a custom time range that does not exceed one week.
User: You can query job data by user. Click Select User. In the panel that appears, select a user.
View job data.
You can view line charts for the jobs that are running, submitted, queuing, and completed. To view detailed data, move the pointer over each chart.
The time window of job statistics is 5 minutes. This means that job data is updated every 5 minutes.
For the jobs that are in the Submitted and Completed states, the line charts display the total numbers of submitted and completed jobs of the last time window.
For the jobs that are in the Running and Queuing states, the line charts display the total numbers of running and queuing jobs of the last time window.