An application profile analyzes your application across six dimensions and surfaces the results as a structured report. The report covers software stacks, system information, database object details, SQL statements, and call stacks — giving you the data you need to plan a heterogeneous database migration.
Prerequisites
Before you begin, make sure you have:
Access to the Data Management (DMS) console V5.0
A database profile created in ADAM
Dynamic data files collected by ADAM Application Collector
Create an application profile
The profile you create contains four sections:
Section | What it shows |
Overview | A radar chart scoring the application across six dimensions, plus basic profile metadata |
System information | System parameters collected by ADAM Application Collector |
Object overview | SQL statements and database objects the application collected and analyzed |
Object details | Relationships among database objects, SQL statements, and application code |
To create an application profile:
Log on to the DMS console V5.0.
In the top navigation bar, hover over Data + AI, then choose Heterogeneous Database Migration(ADAM) > Application Evaluation and Transformation.
Click the Create Application Profile tab.
Click Create Profile.
On the Basic Settings tab of the Create Application Profile panel, configure the following parameters, then click Upload to upload your dynamic data files.
Parameter
Description
Profile Name
A name to identify this application profile
Type
The type of application being analyzed
Report Language Type
The language in which the report is generated
Click the Database Profile tab, then click Select.
In the Select Associated Database Profile panel, select a database profile, click Add, then click the Close icon in the upper-right corner of the panel.
Select the added database profile and click Create.
ADAM analyzes the uploaded data files and generates the profile. This process takes 1 to 10 minutes.
View an application profile
Log on to the DMS console V5.0.
In the top navigation bar, hover over Data + AI, then choose Heterogeneous Database Migration(ADAM) > Application Evaluation and Transformation.
Click the Create Application Profile tab.
Find the profile and click Details in the Actions column.
The profile opens with four tabs. The following sections describe each tab.
Overview
The Overview tab displays a radar chart and basic profile metadata.
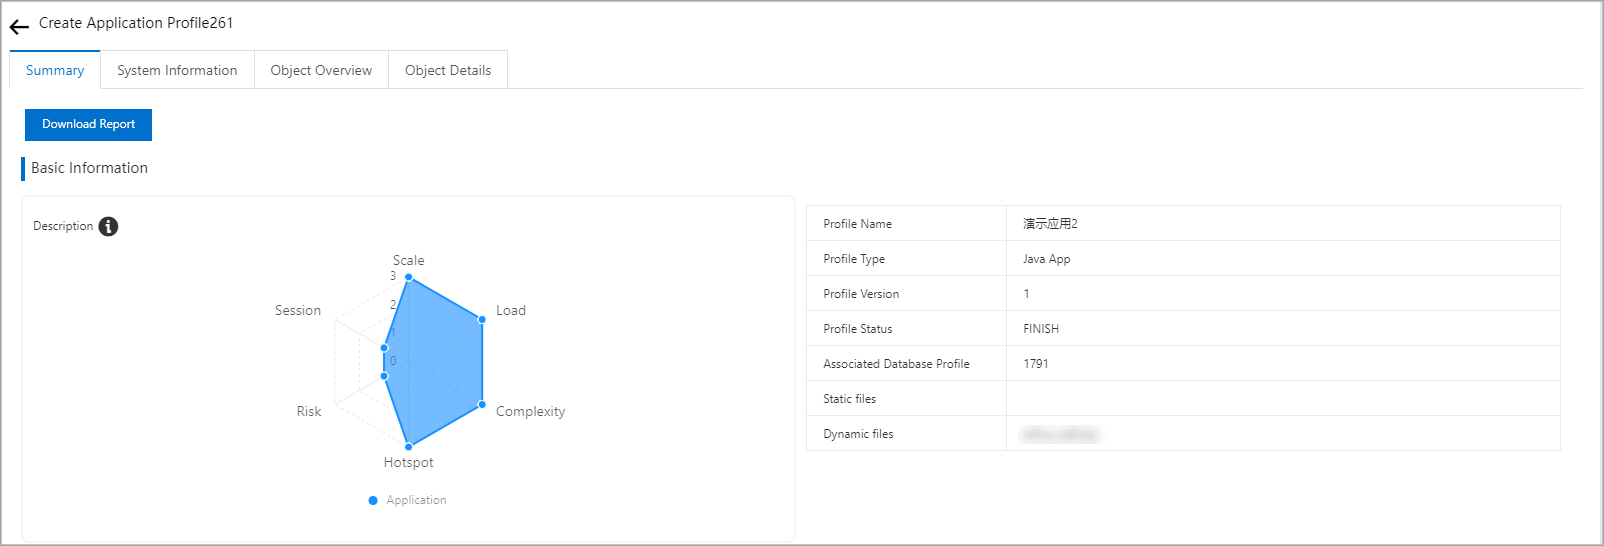
To download the full report, click Download Report.
ADAM scores the application across six dimensions. A higher score indicates greater intensity on that dimension.
Dimension | What it measures |
Complexity | Application usage, calculated from scenarios and database features. A higher score means the application is more complex and requires more transformations. |
Session | The connection status of the application. A higher score indicates a larger number of connections to the application — important for sizing the connection pool during transformation. |
Risk | Potential performance bottlenecks and stability risks, with emphasis on SQL operation performance. |
Hotspot | Frequency of object access. A higher score means the database contains more heavily accessed objects. |
Scale | Number of deployment units or instances. |
Load | Overall application performance. |
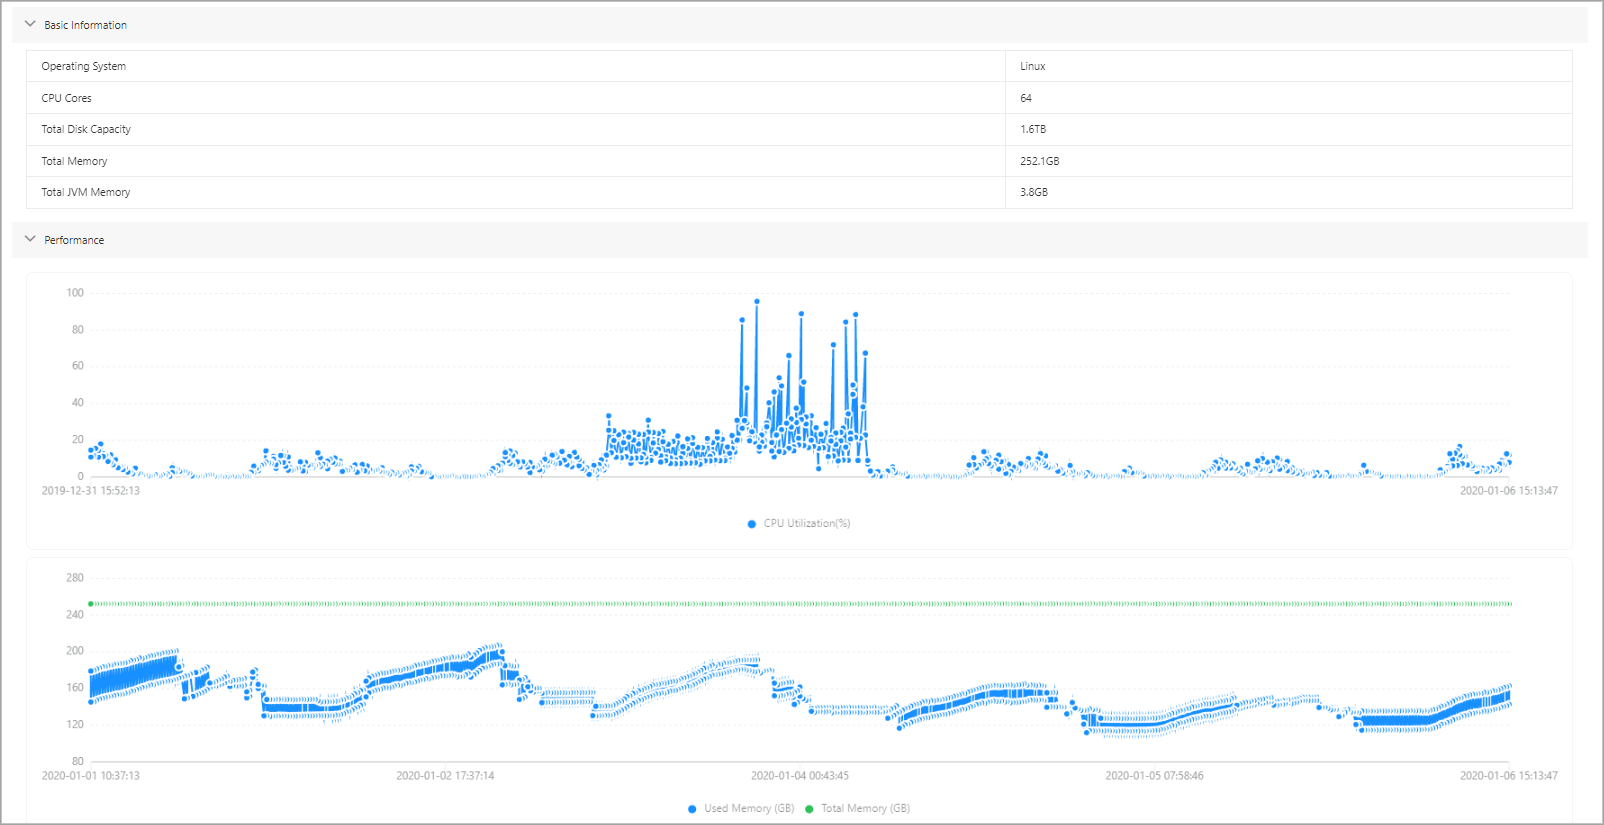
System information
The System Information tab displays the system parameters collected by ADAM Application Collector, helping you evaluate the current state of the application.
Object overview
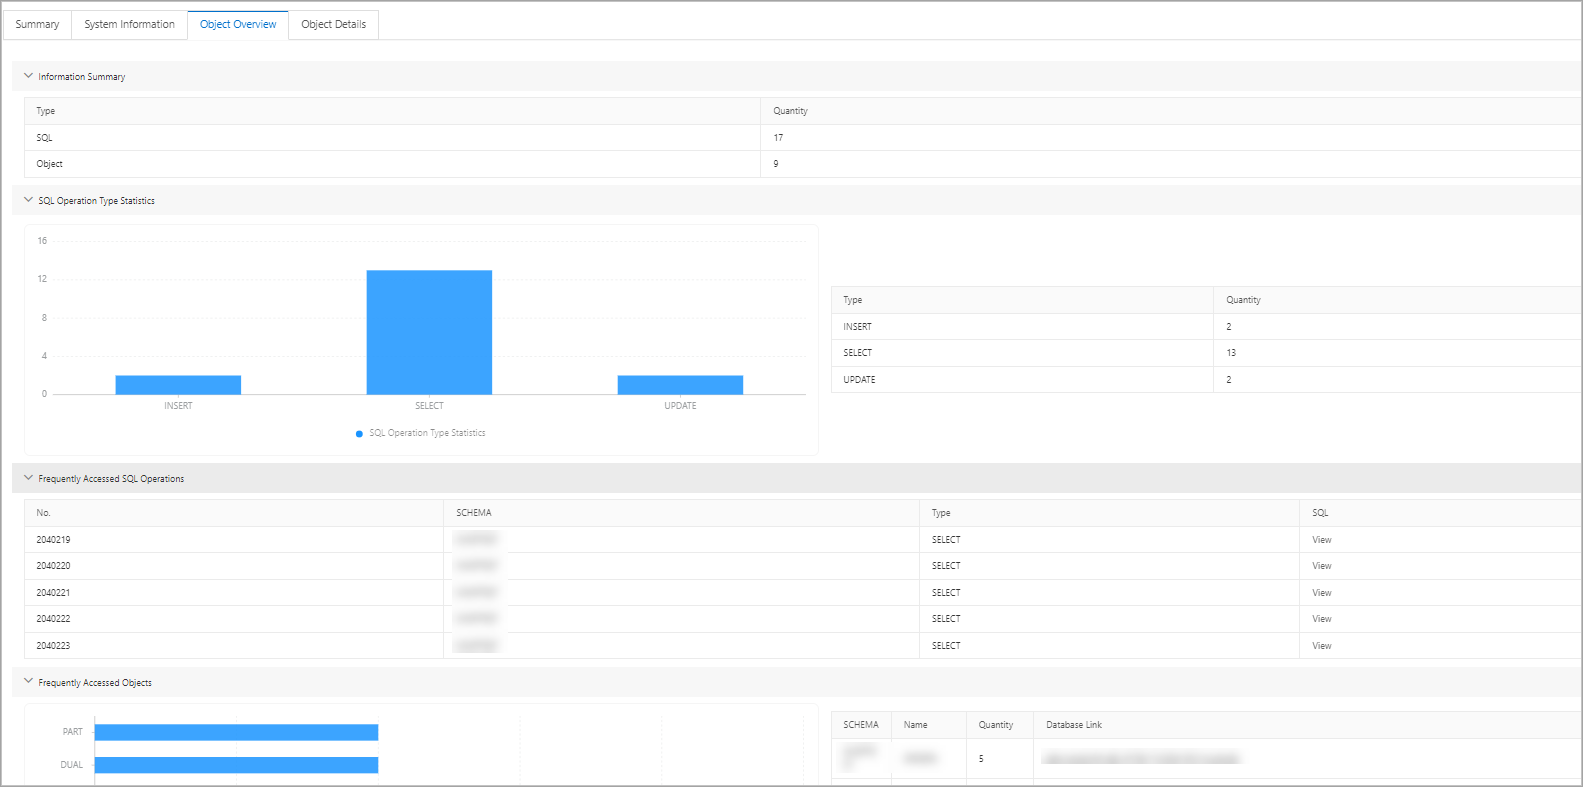
The Object Overview tab displays the SQL statements and database objects the application collected and analyzed.
Object details
The Object Details tab shows the relationships among database objects, SQL statements, and application code analyzed by ADAM.

The left panel lists database objects accessed by the application as a tree diagram, organized by schema and object type.
The right panel lists database objects alongside the SQL statements used to access them.
To filter call stack data, configure a denylist when setting up the call stack.