The Module Statistics for Private Zone provides multi-dimensional statistics for traffic types such as Global Traffic, Authoritative Traffic, Cache Traffic, Forward Traffic, and Recursion Traffic to help you analyze the module distribution of resolution requests and traffic trends.
Use cases
Understand how internal DNS resolution requests are distributed across modules.
Analyze traffic flow and module hit rates for resolution requests.
Monitor the volume and latency of resolution requests for different modules.
Analyze rankings of resolution requests by domain, subdomain, network, and client IP.
Procedure
Log on to the Alibaba Cloud DNS console.
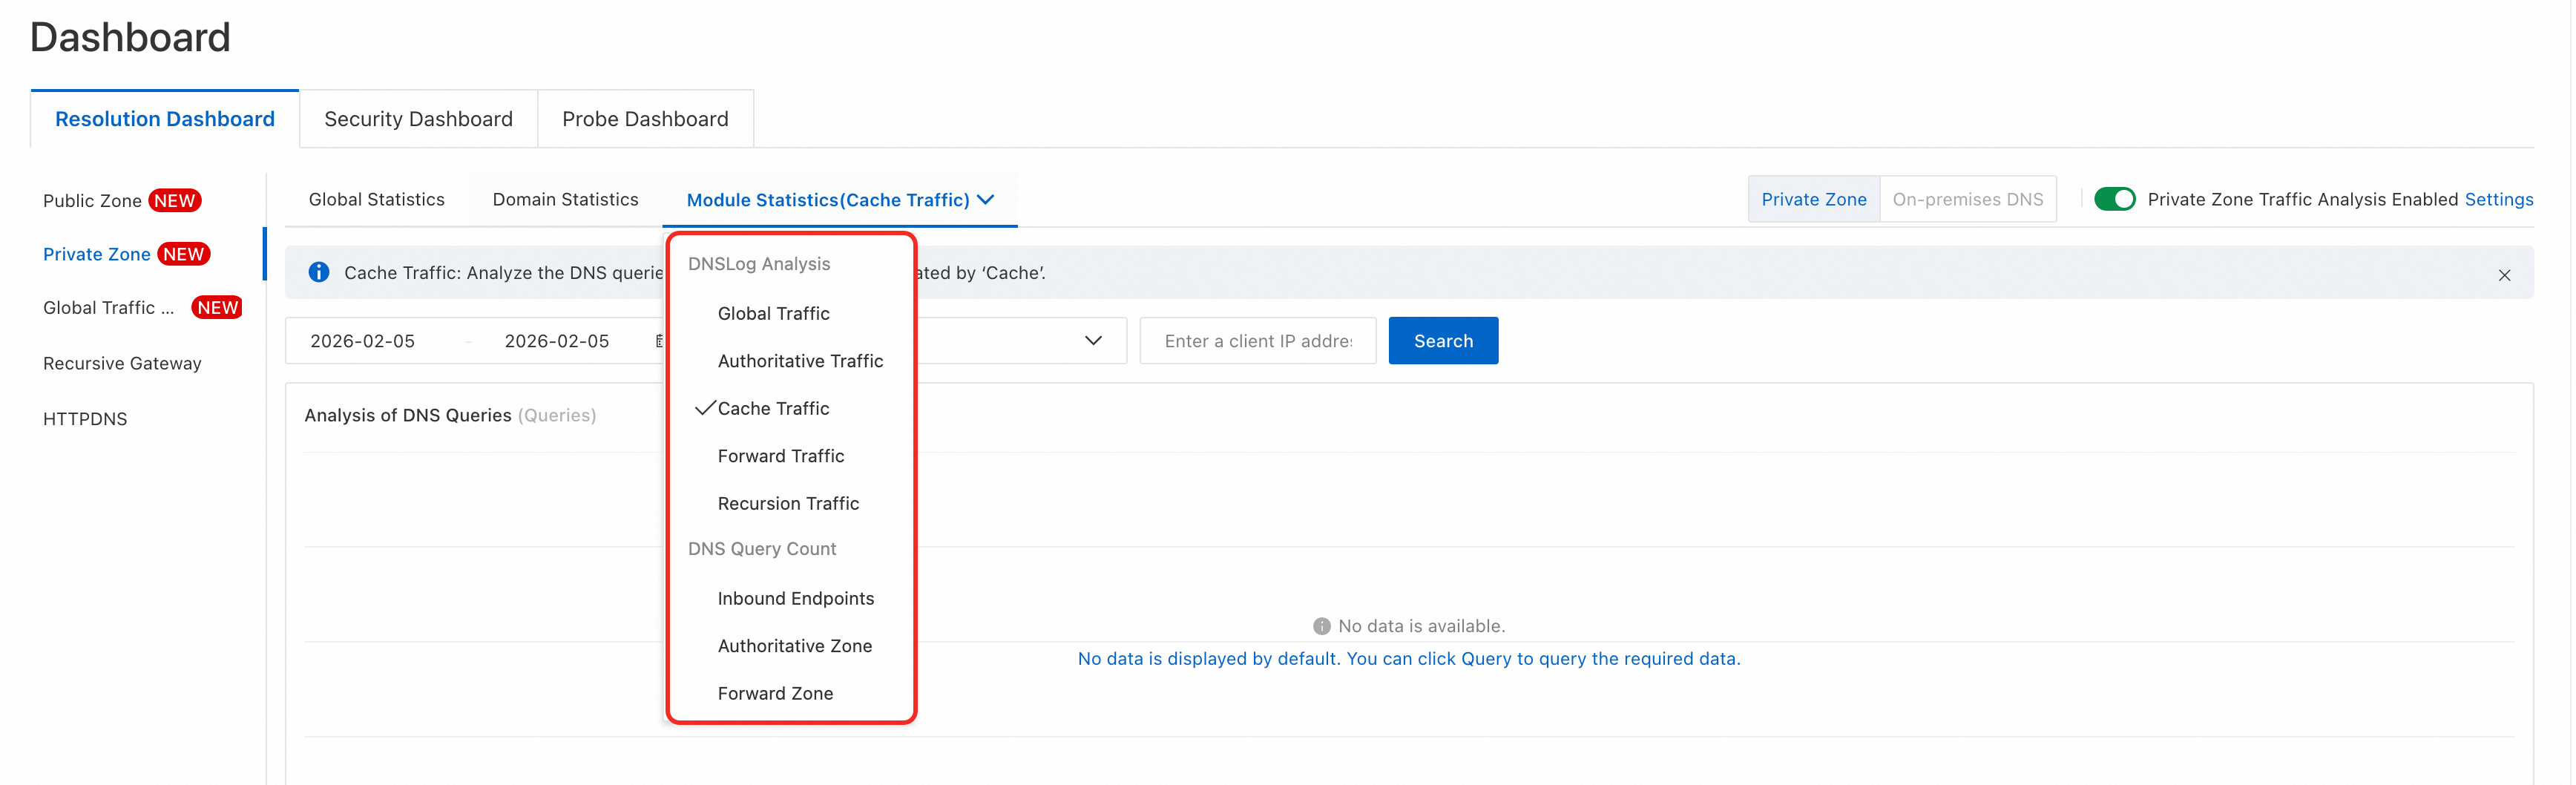
Switch to the Resolution Dashboard > Private Zone > Module Statistics tab.
In the upper-right corner, set the switch to Private Zone.
In the tab drop-down menu, you can select different traffic types for analysis (Global Traffic, Authoritative Traffic, Cache Traffic, Forward Traffic, Recursion Traffic, etc.).
Modules
You can switch between modules for analysis:
Global traffic: Analyzes DNS resolution requests and responses from endpoints, such as ECS instances and containers, in your internal network.
Internal authoritative traffic: Analyzes only the resolution requests and responses processed by the built-in authoritative module.
Cache traffic: Analyzes only the resolution requests and responses processed by the cache module.
Forwarded traffic: Analyzes only the resolution requests and responses processed by the forwarding module.
Recursive traffic: Analyzes only the resolution requests and responses processed by the recursive module.
Resolution statistics: Lets you query usage based on the volume of resolutions processed by inbound endpoints, the built-in authoritative module, and the forwarding module.
When you select a different traffic type, the statistics on the page update. You must then reconfigure the query conditions and click Query to view the new data.
Global Traffic
Query conditions
You can filter queries by time, network scope, and client IP.
Time condition: You can query data from the last year within a time range of up to 90 days. Data for resolution requests within the last 7 days is available at minute-level granularity.
Network scope: You can filter by VPCs in the current account or an associated account.
Client IP: The IP address of the client that initiated the request. This is typically the IP address of an ECS instance but can also be from another cloud service.
Throttling alarm events
Click Quotas of dns response per second in the upper-right corner of the Events of QPS exceeds threshold pane to view the throttling alarm rules for private DNS resolution.
Type | Throttling threshold |
Total resolution request threshold for a single ECS instance in a VPC | 5,000 queries/second |
External recursive resolution request threshold for a single ECS instance in a VPC | 600 queries/second |
Total resolution request threshold for a VPC | Unlimited |
Total external recursive resolution request threshold for a VPC | 5,000 queries/second |
The cloud's local DNS servers measure request volume by the source IP of the ECS instance. A single ECS instance exceeding 5,000 queries per second (QPS) triggers a throttling alarm. Because DNS is provided as a clustered service, DNS queries from an ECS instance are distributed across multiple DNS servers.
If a single DNS server triggers a throttling alarm, the actual request volume from the ECS instance has exceeded 5,000 QPS.
If DNS queries from an ECS instance exceed 5,000 QPS, a throttling alarm may not be triggered. This can occur because traffic is distributed, so a single DNS server might not reach the 5,000 QPS threshold.
If you encounter throttling for external recursive resolution, we recommend enabling cache persistence for critical, frequently accessed domains. This service caches resolution results for longer periods to prevent failures caused by throttling.
If you encounter overall resolution throttling, we recommend that you enable NSCD cache acceleration on your ECS instances to reduce the number of internal DNS resolutions and improve resolution speed. Alternatively, you can add more ECS instances to distribute the traffic load.
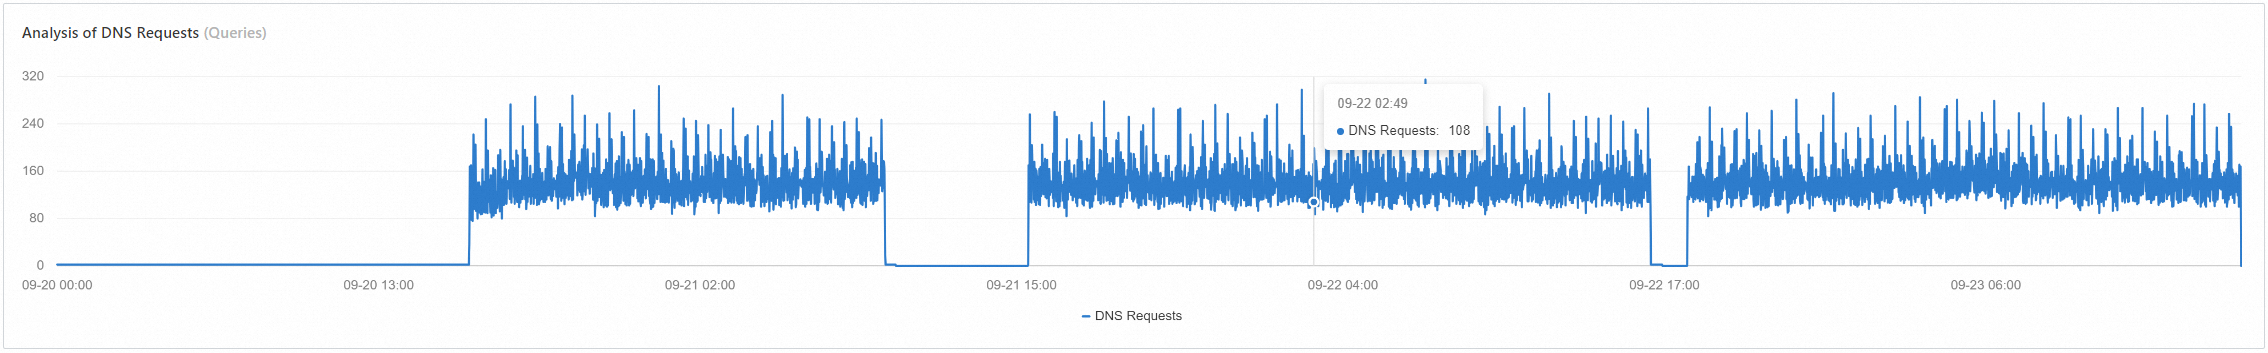
Request volume statistics
View the trend of resolution requests for a specified time range, network scope, and client IP. You can also click the Enlarge icon in the upper-right corner to view a larger version of the chart.
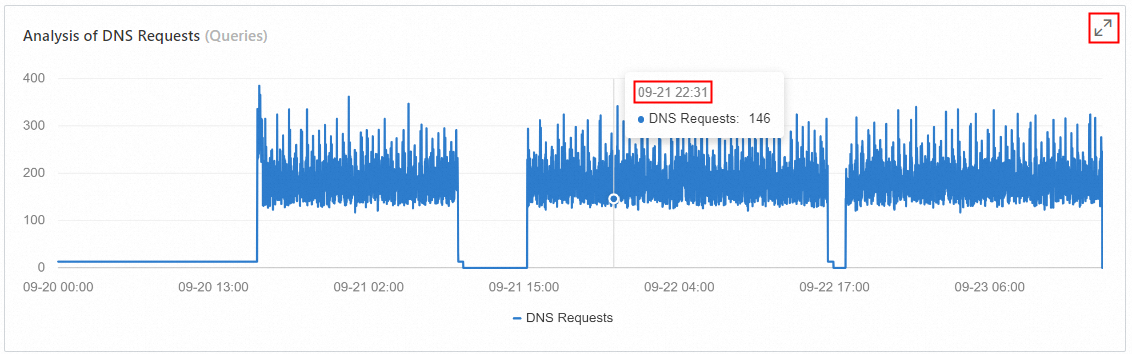
Data for resolution requests within the last 7 days is available at minute-level granularity.
Resolution latency analysis
View the resolution latency trend for a specified time range, network scope, and client IP. You can also click the Enlarge icon in the upper-right corner to view a larger version of the chart.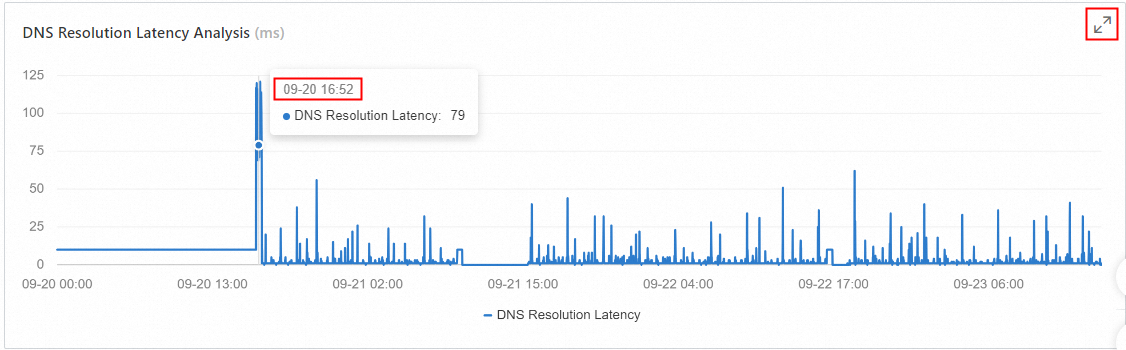
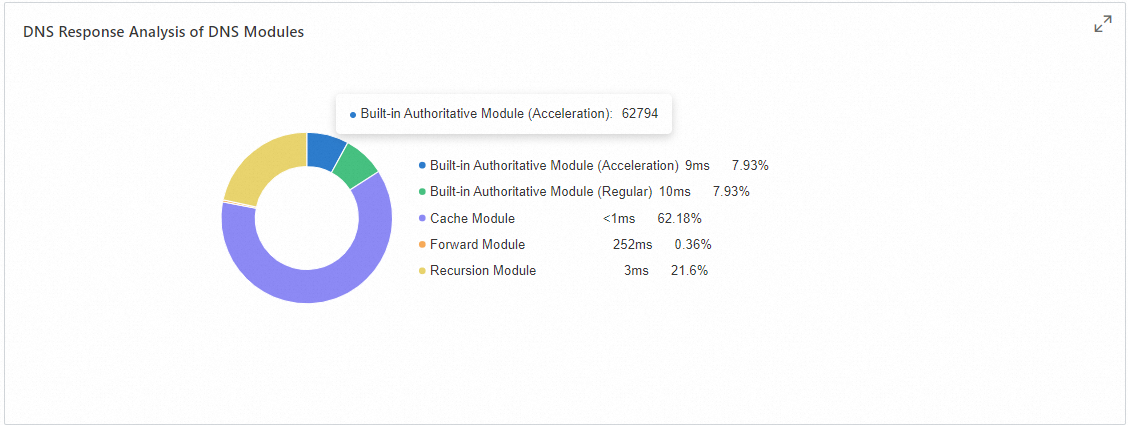
Request hits by module
This chart shows the distribution, total count, and response latency of requests processed by the authoritative, cache, forwarded, and recursive modules within the DNS server. You can filter the data by time range, network scope, and client IP. You can also click the Enlarge icon in the upper-right corner to view a larger version of the chart.
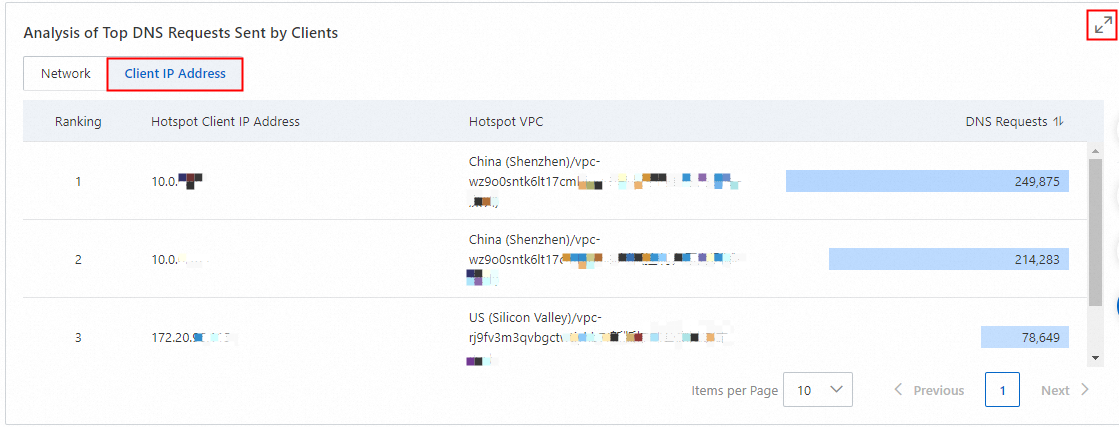
Top N analysis of request volume
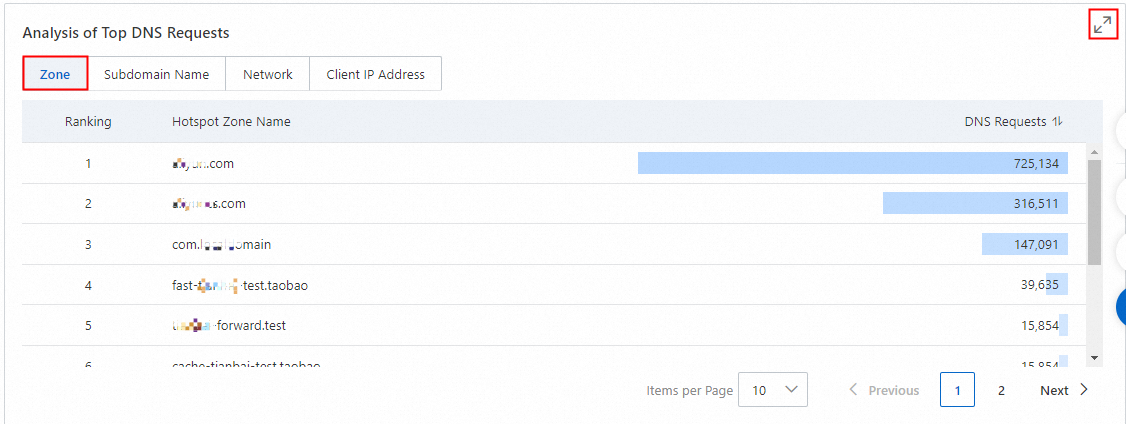
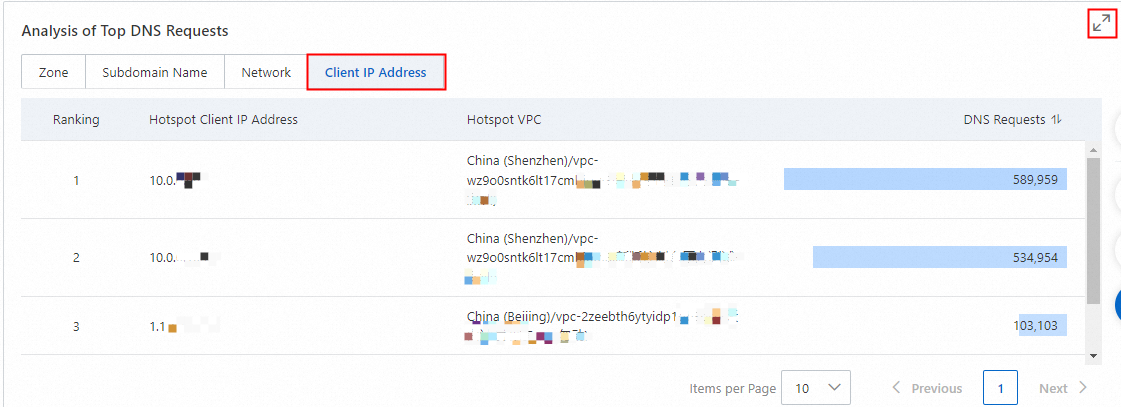
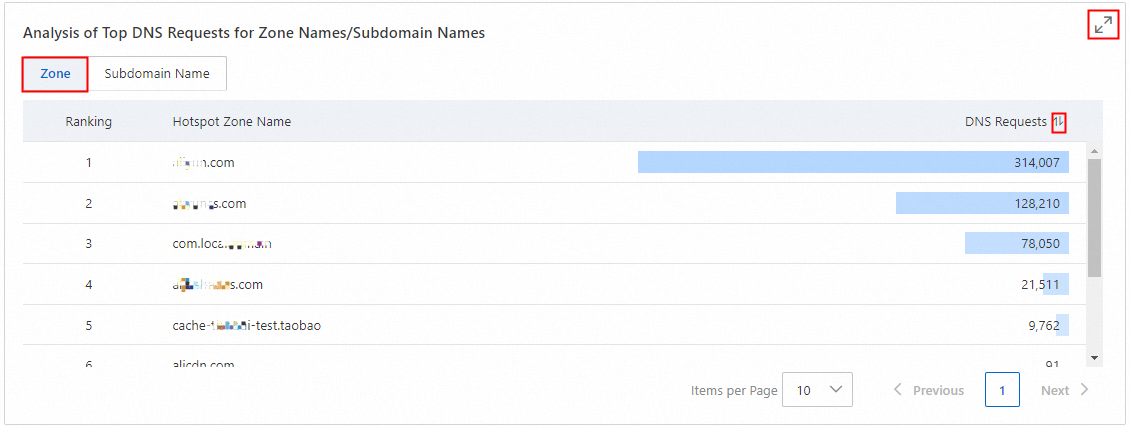
You can analyze the rankings of resolution request volume for dimensions such as Domain Name, Subdomain Name, Network, and Client IP Address based on query conditions such as a time range, a specific network range, and client IPs. The resolution request volume can be sorted in ascending or descending order. By default, the results are displayed in descending order from highest to lowest. In addition, you can click the zoom icon in the top-right corner to enlarge the view.
Hotspot domain request ranking
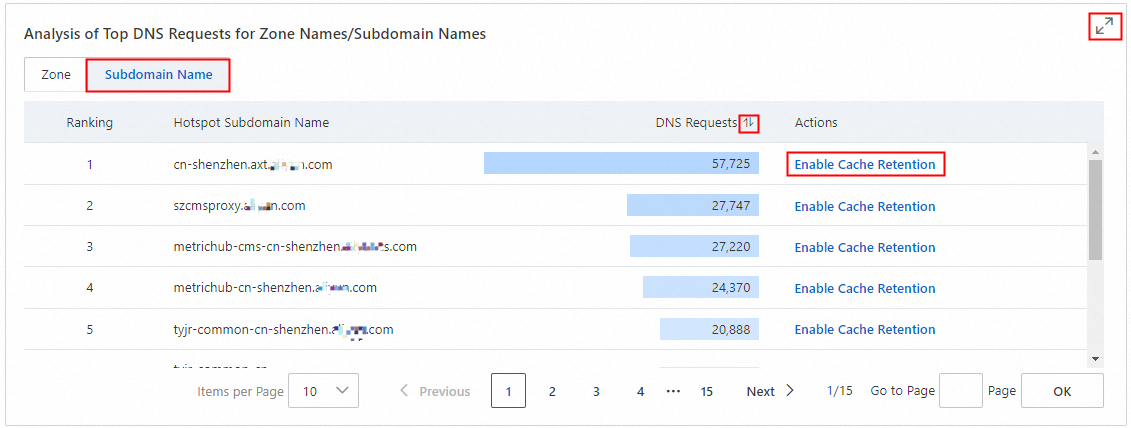
Hotspot subdomain request ranking
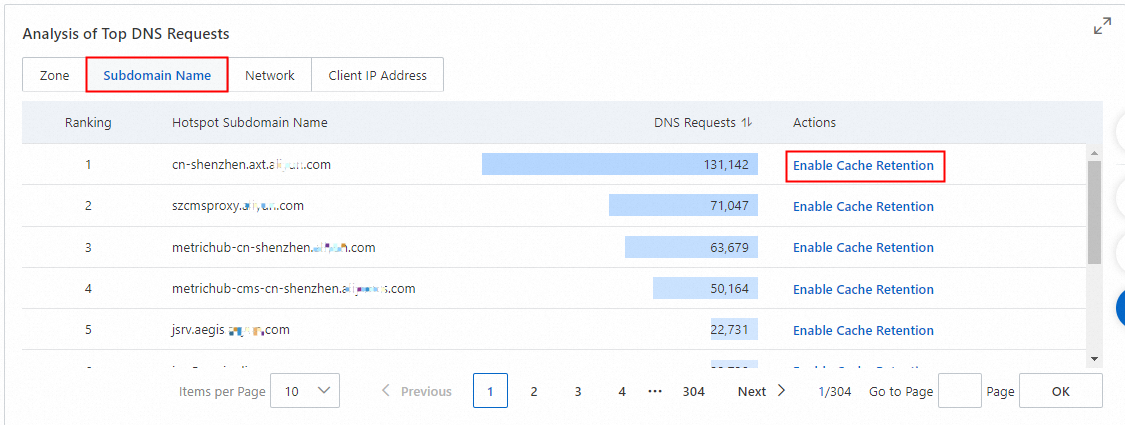
You can configure Enable Cache Retention for subdomains. If you have already enabled the Private DNS Resolution Service, a page to add cache prefetch domains is displayed for configuration. For domains where caching is already enabled, the corresponding enable action is not displayed.
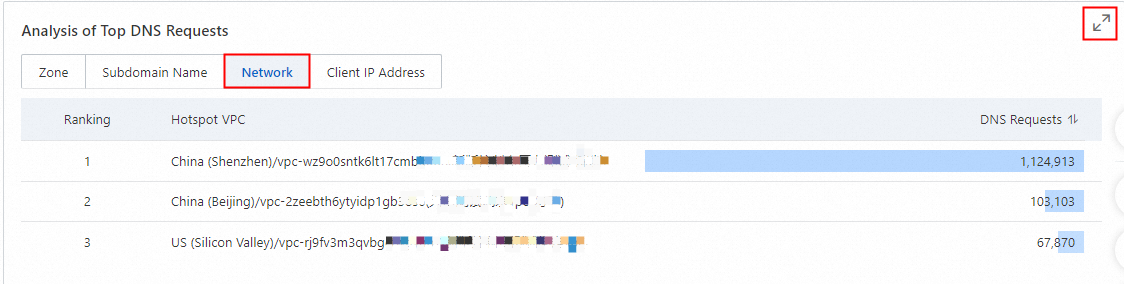
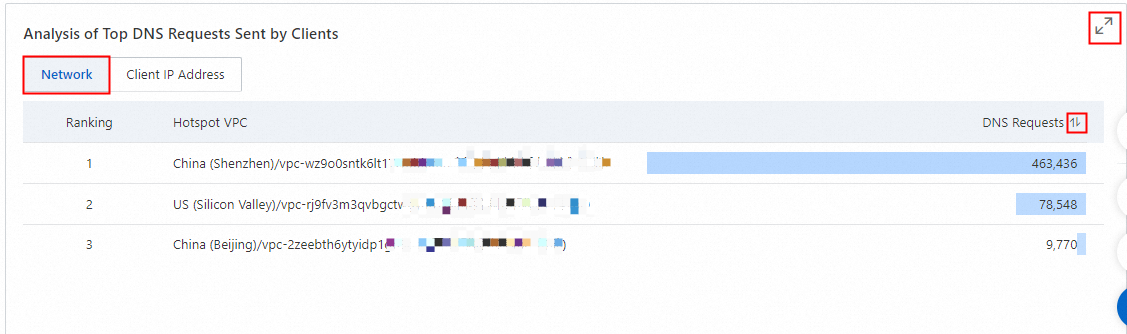
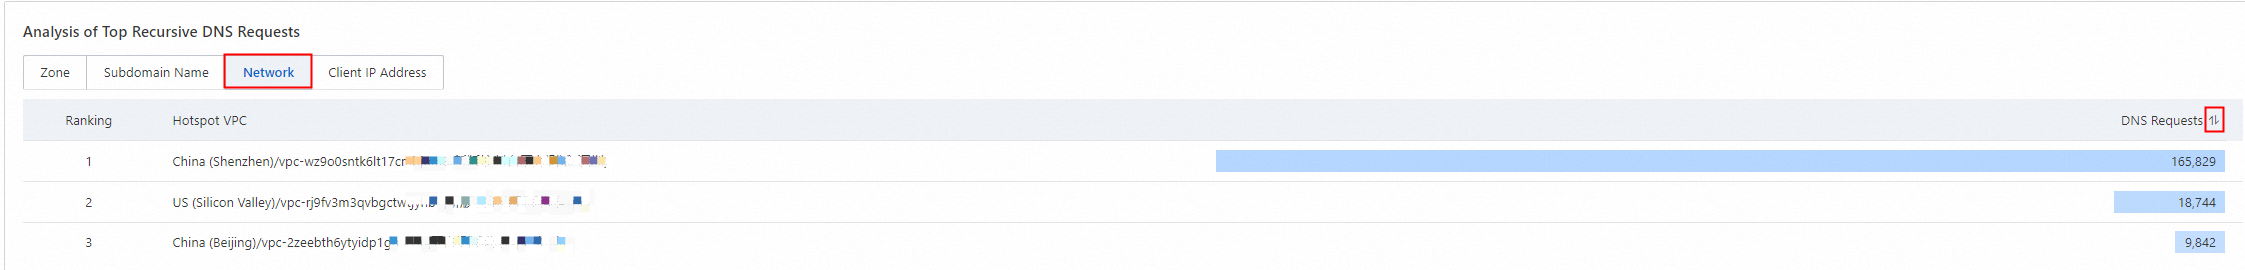
Hotspot network request ranking
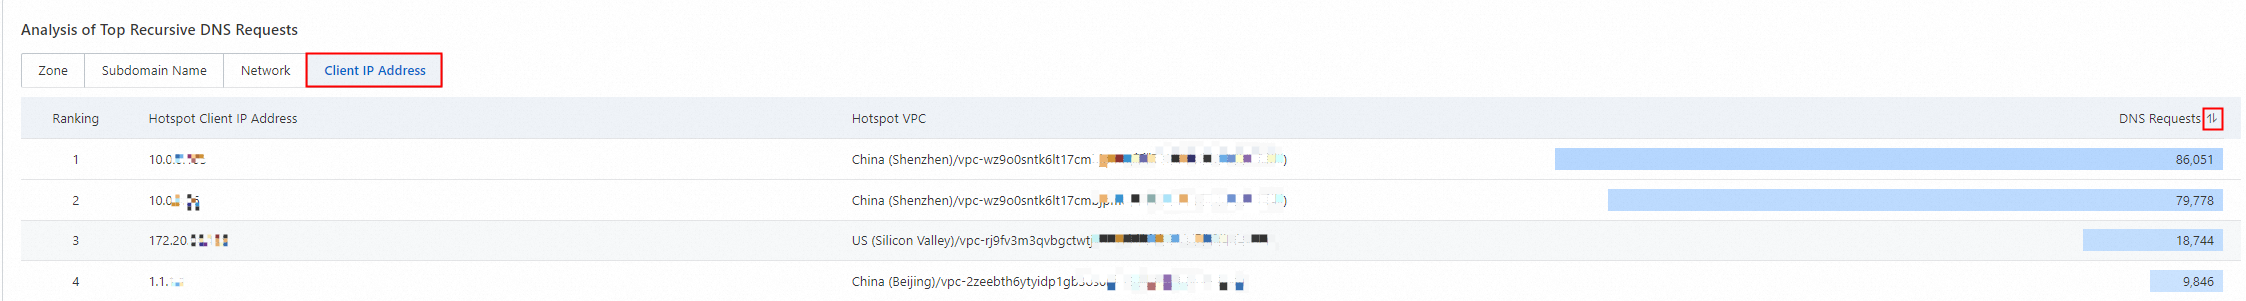
Hotspot client IP request ranking
Authoritative Traffic
Query conditions
You can filter queries by time, network scope, and internal authoritative domain.
Time condition: You can query data from the last year within a time range of up to 90 days. Data for resolution requests within the last 7 days is available at minute-level granularity.
Network scope: You can filter by VPCs in the current account or an associated account.
Private Authoritative Domain: Set to All Zone Names by default. Supports exact search.
Request volume analysis
View the trend of resolution requests based on the internal authoritative zone type, network scope, and internal authoritative domain for a specified time range. Data for the last 7 days is available at minute-level granularity. You can also click the Enlarge icon in the upper-right corner to view a larger version of the chart.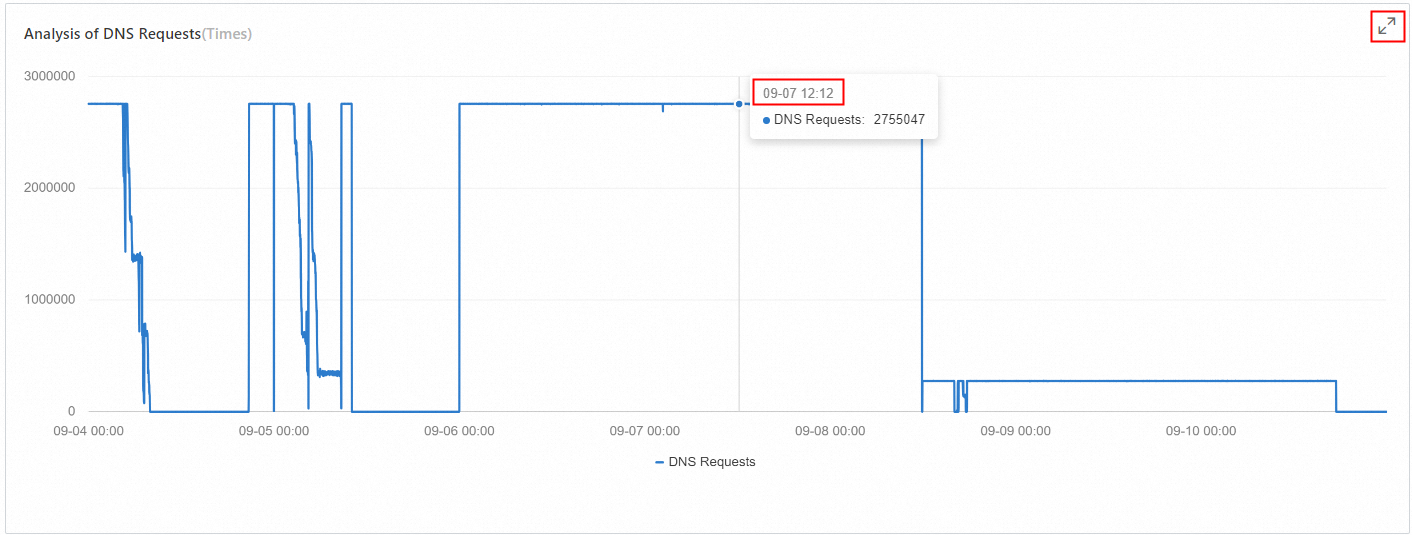
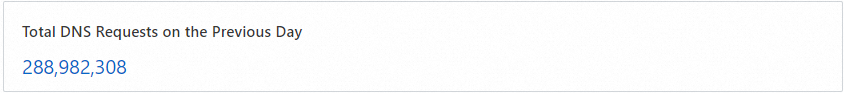
Total internal domain requests yesterday
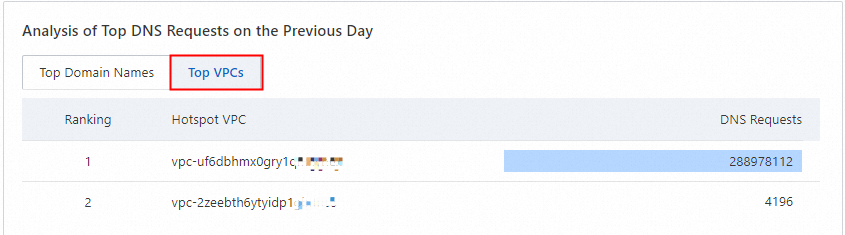
Top domains by requests yesterday
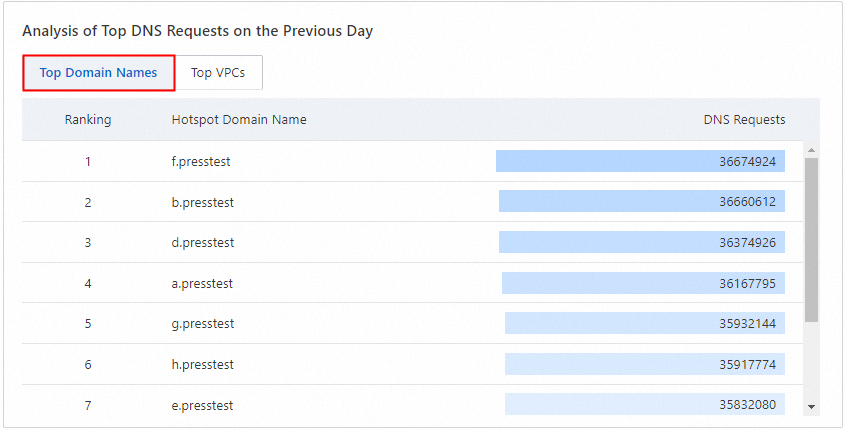
Top VPCs by requests yesterday
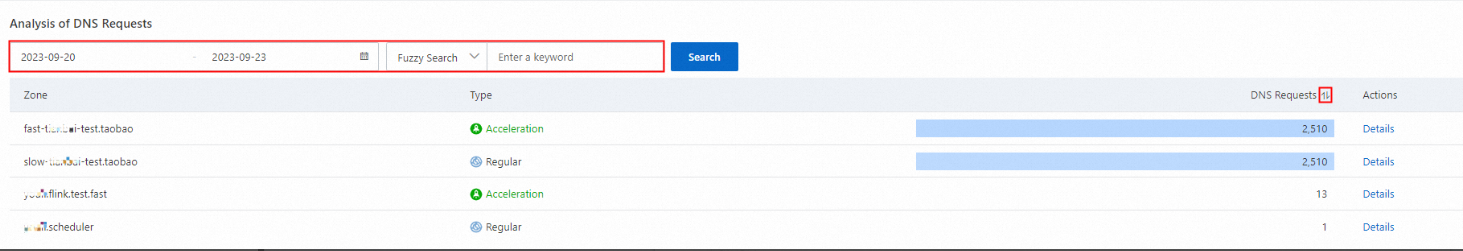
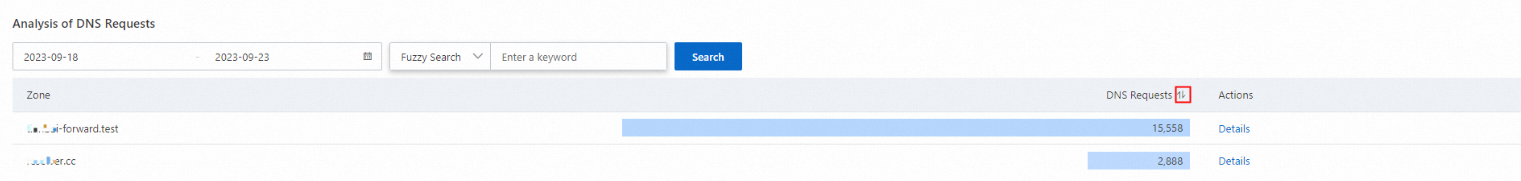
Request volume ranking
You can perform precise and fuzzy searches for specific time periods and Zone names. The search results are sorted by DNS Queries in descending order by default. You can also click the sort icon to switch to ascending order.
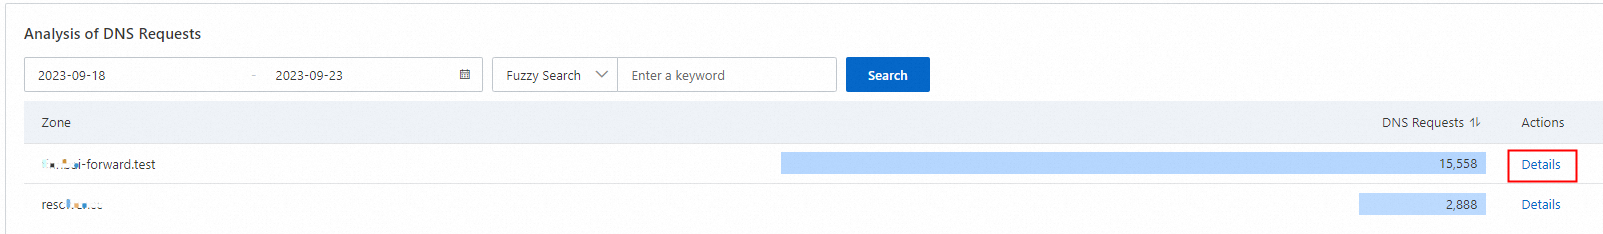
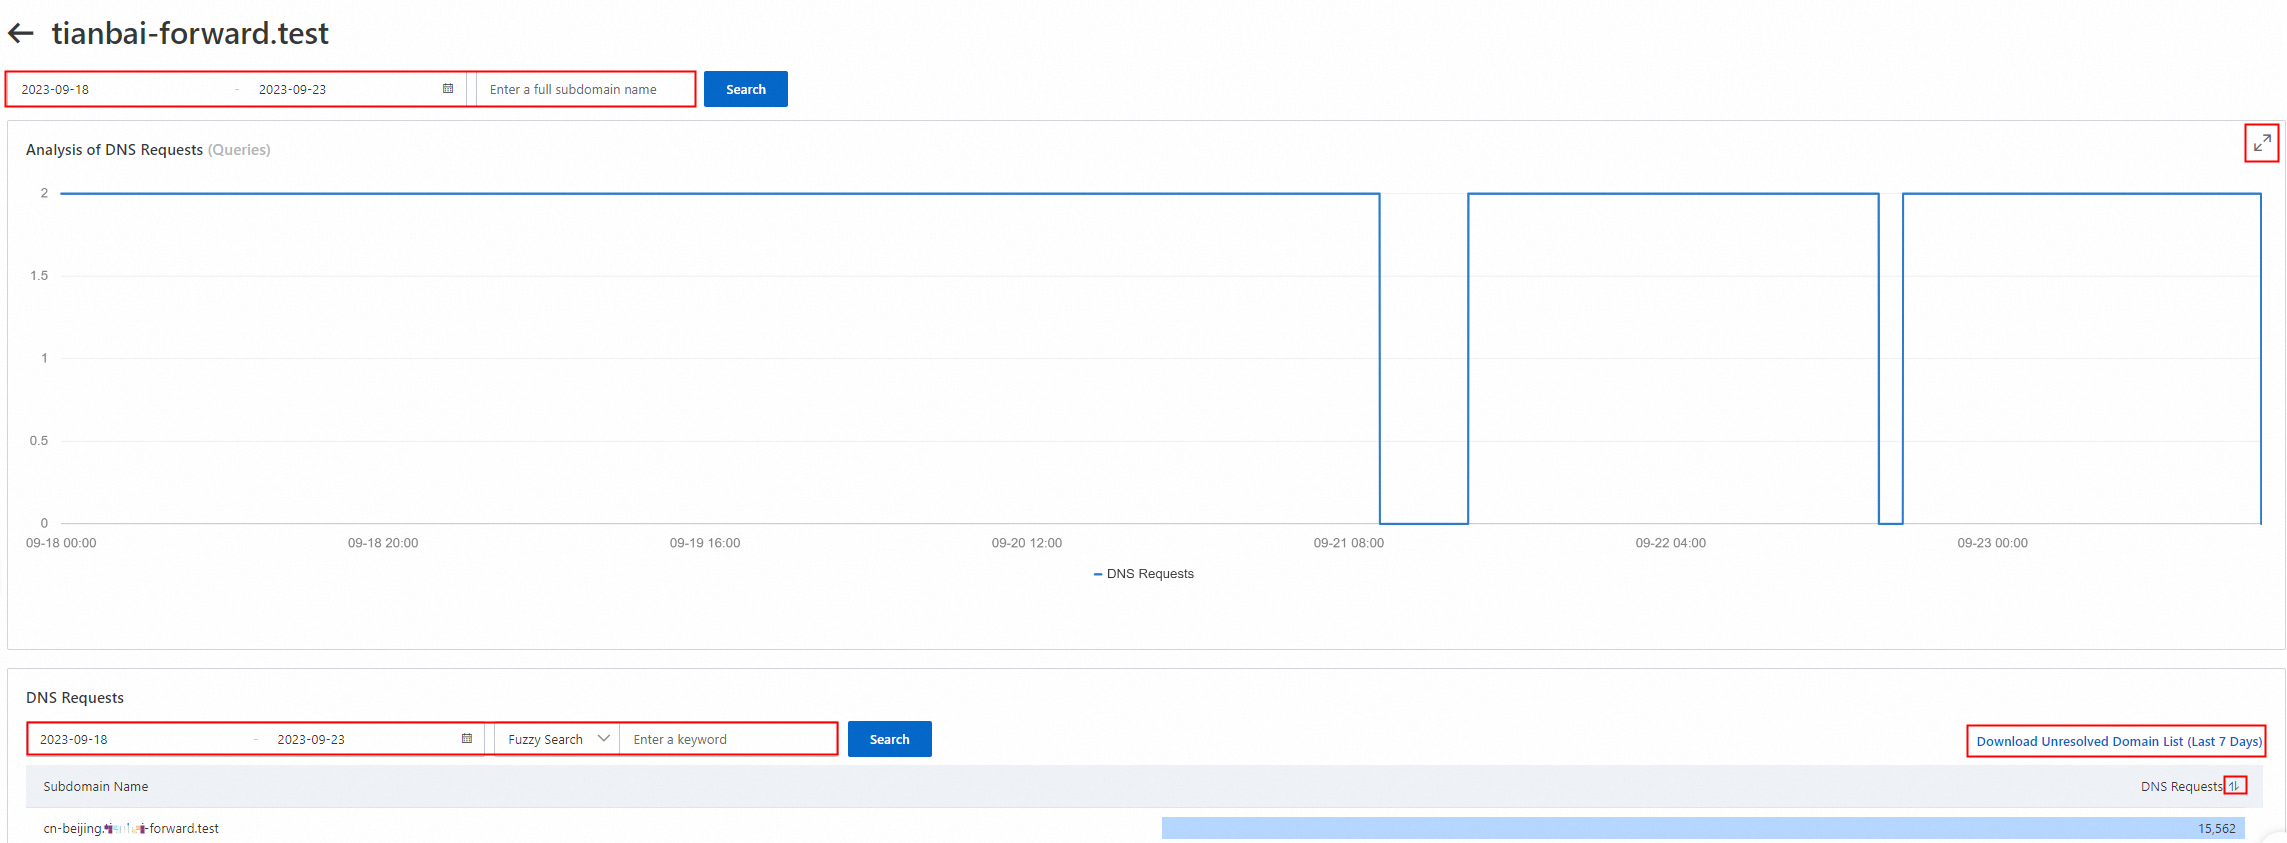
Subdomain request analysis
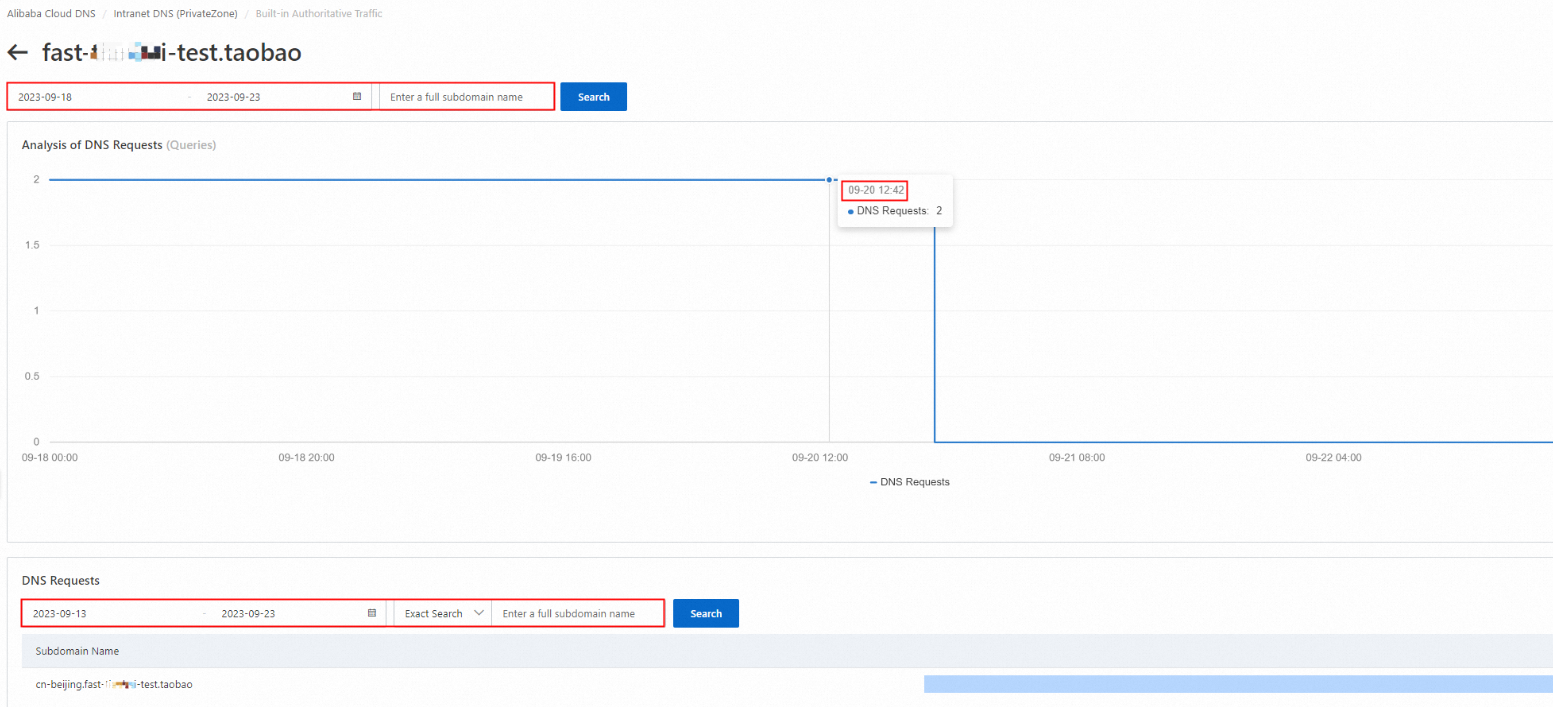
Click Details in the Actions column for the target domain to view the subdomain resolution request volume analysis report.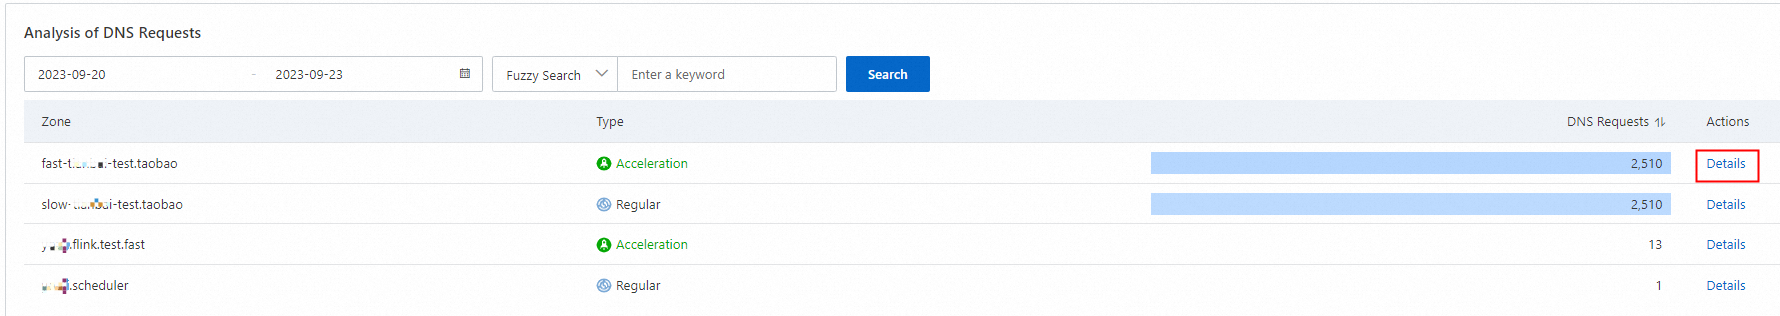
The report also allows you to query data by a specific time range and subdomain name.
Cache Traffic
Query conditions
You can filter queries by time, network scope, and the source client IP of the resolution request.
Time condition: You can query data from the last year within a time range of up to 90 days. Data for resolution requests within the last 7 days is available at minute-level granularity.
Network scope: You can filter by VPCs in the current account or an associated account.
Client IP: The source IP address of the client that initiated the resolution request. This is typically the IP address of an ECS instance but can also be from another cloud service.
Request volume analysis
View the trend of resolution requests for a specified time range, network scope, and client IP. Data for resolution requests within the last 7 days is available at minute-level granularity.
Top domains and subdomains by request volume
View the top domains and subdomains by request volume for a specified time range, network scope, and client IP. You can also click the Enlarge icon in the upper-right corner to view a larger version of the chart.
Hotspot domain ranking
Hotspot subdomain ranking
You can configure Enable Cache Retention for subdomains. If you have already enabled the Private DNS service, a page is displayed for you to add and configure a domain for cache persistence. The option to enable cache persistence is not displayed for domains where this feature is already enabled.
Top N request sources
View rankings of resolution requests by network and client IP for a given time range. You can also click the Enlarge icon in the upper-right corner to view a larger version of the chart.
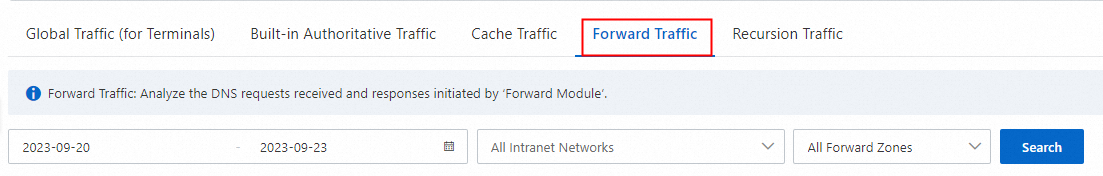
Forward Traffic
Query conditions
You can filter queries by time, network scope, and forwarding domain.
Time condition: You can query data from the last year within a time range of up to 90 days. Data for resolution request volume within the last 7 days is available at minute-level granularity.
Network scope: You can filter by VPCs in the current account or an associated account.
Forwarding domain: By default, all internal forwarding domains are included. You can perform an exact search for a specific forwarding domain.
Forwarded request analysis
View the trend of resolution requests for a specified time range, network scope, and forwarding domain. You can also click the Enlarge icon in the upper-right corner to view a larger version of the chart.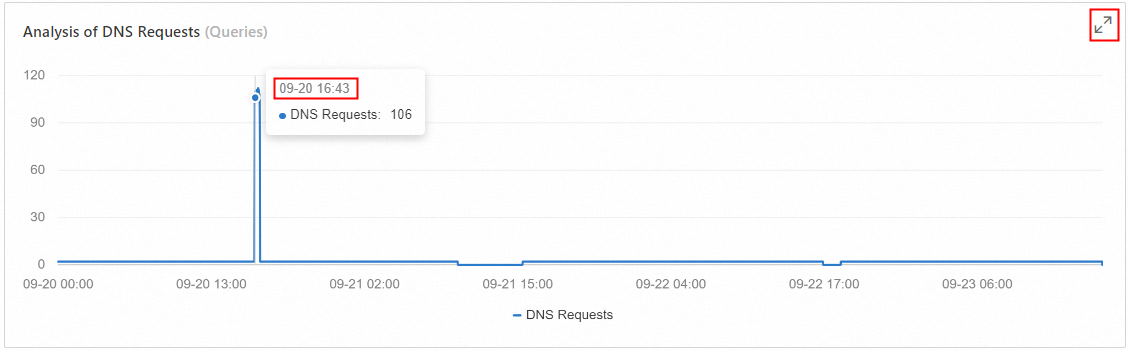
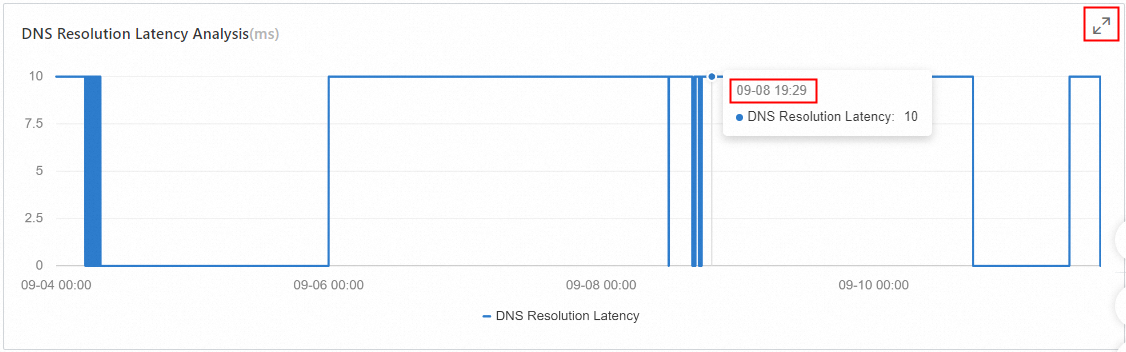
Forwarded latency analysis
View the resolution latency trend for a specified time range, network scope, and forwarding domain. You can also click the Enlarge icon in the upper-right corner to view a larger version of the chart.
External DNS request analysis
Analyze the total volume and average latency of resolution requests that are forwarded to external DNS systems at different destination IP addresses. You can sort the results by request volume.

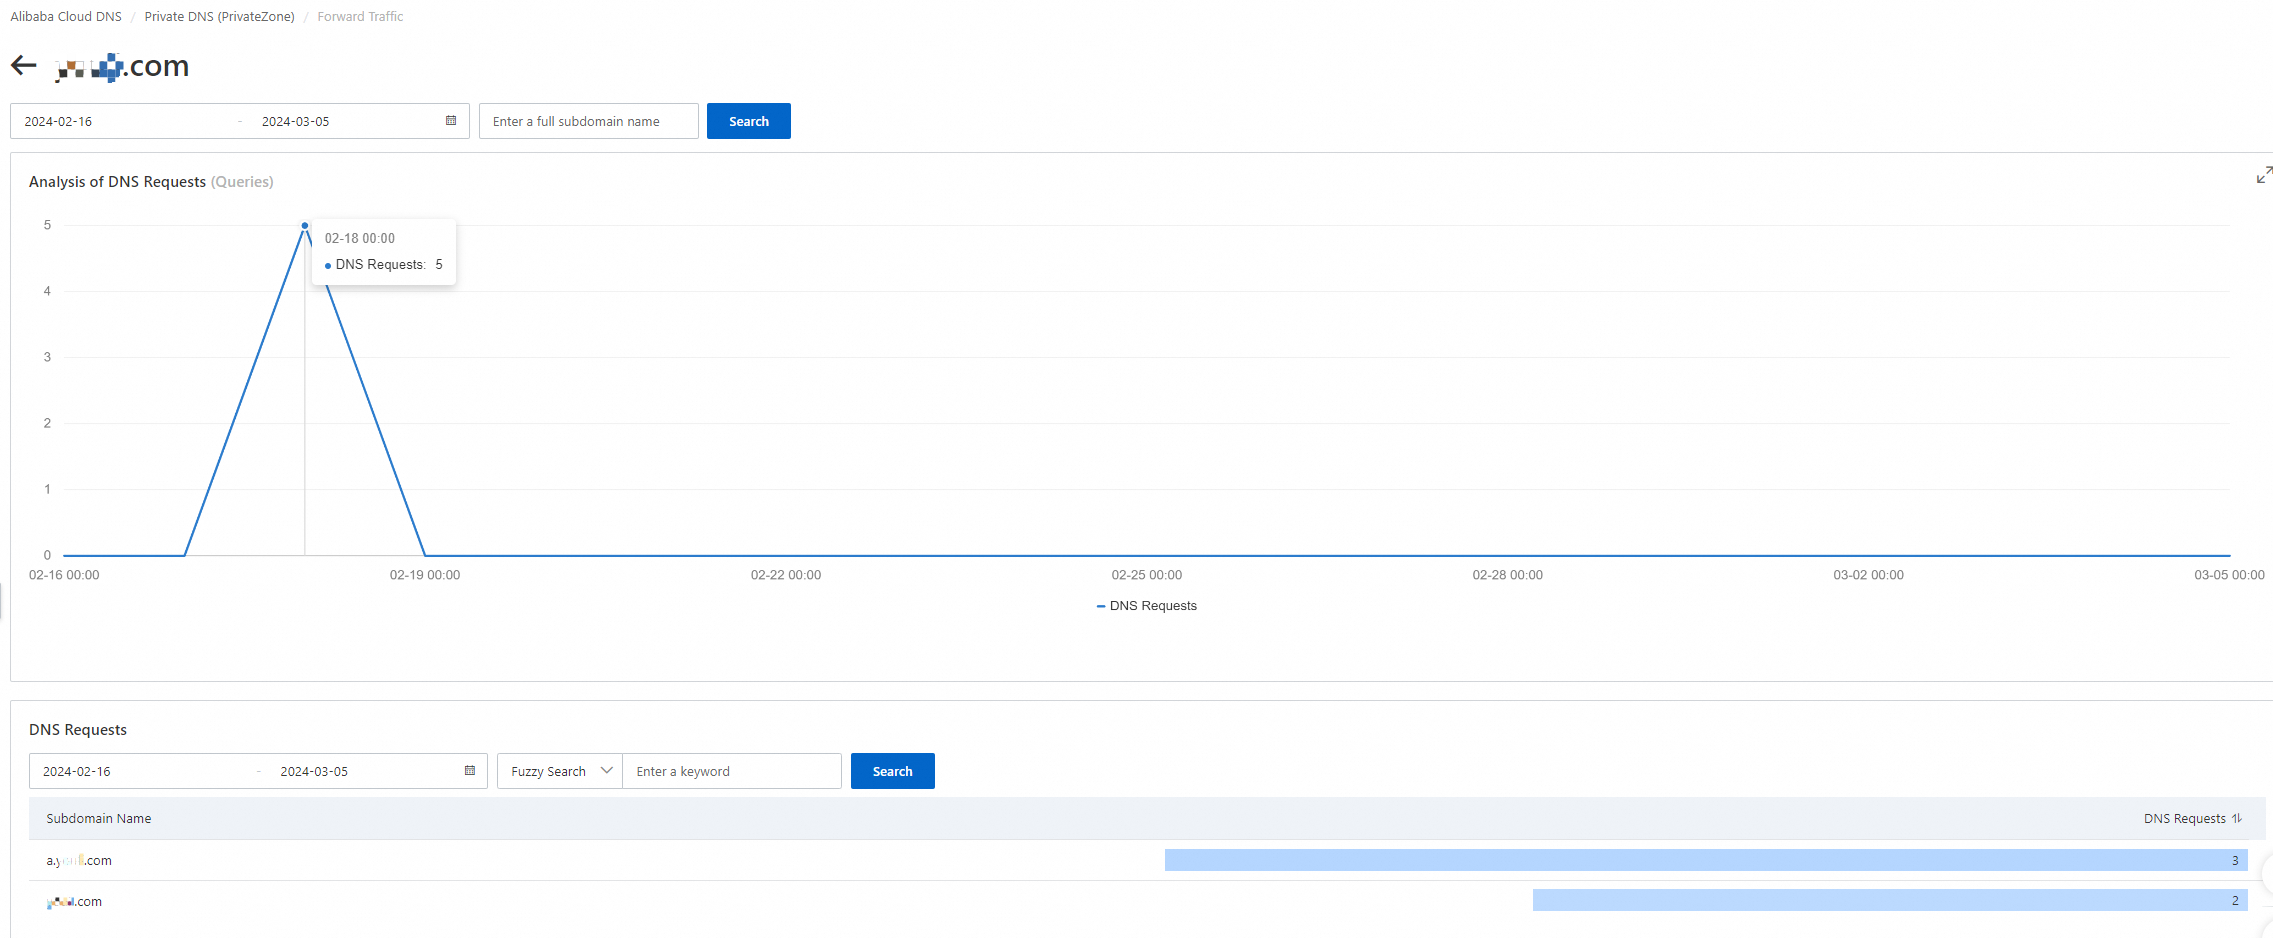
Forwarded domain request details
This feature supports precise and fuzzy searches for specific time periods and Zone names. Search results are sorted by Resolution Request Volume in descending order by default. You can also click the sort button next to the column header to change the sort order to ascending.
Subdomain request analysis
Click Details in the Actions column of the target domain to view the analysis report of subdomain resolution request volume.
The report also allows you to query data by a specific time range and subdomain name.
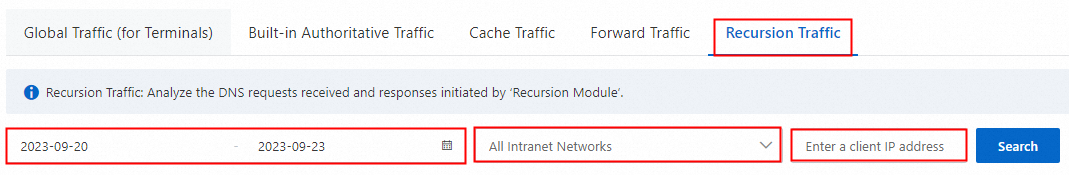
Recursion Traffic
Query conditions
You can filter queries by time, network scope, and the source client IP of the resolution request.
Time condition: You can query data from the last year within a time range of up to 90 days. Data for resolution request volume within the last 7 days is available at minute-level granularity.
Network scope: You can filter by VPCs in the current account or an associated account.
Client IP: The source IP address of the client that initiated the resolution request. This is typically the IP address of an ECS instance but can also be from another cloud service.
Recursive request analysis
View the trend of resolution requests for a specified time range, network scope, and client IP. You can also click the Enlarge icon in the upper-right corner to view a larger version of the chart.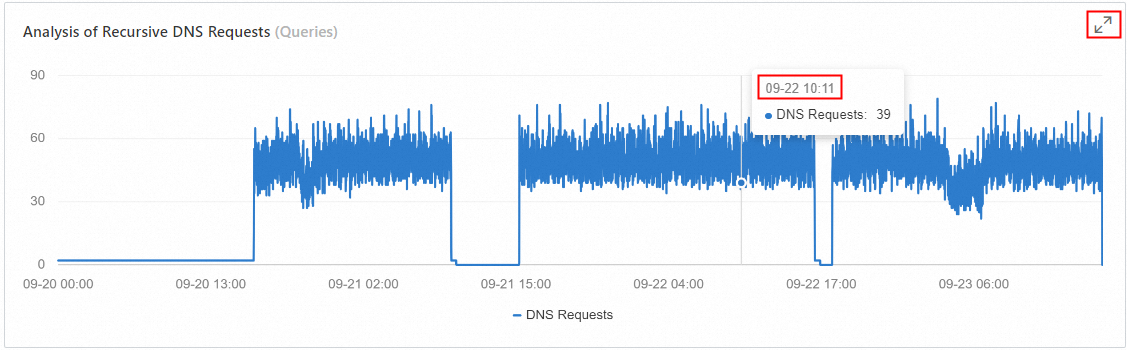
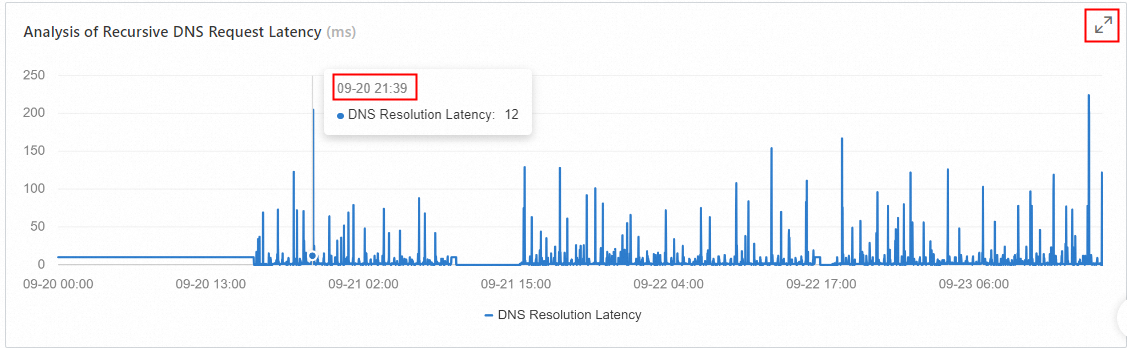
Recursive latency analysis
View the resolution latency trend for a specified time range, network scope, and client IP. You can also click the Enlarge icon in the upper-right corner to view a larger version of the chart.
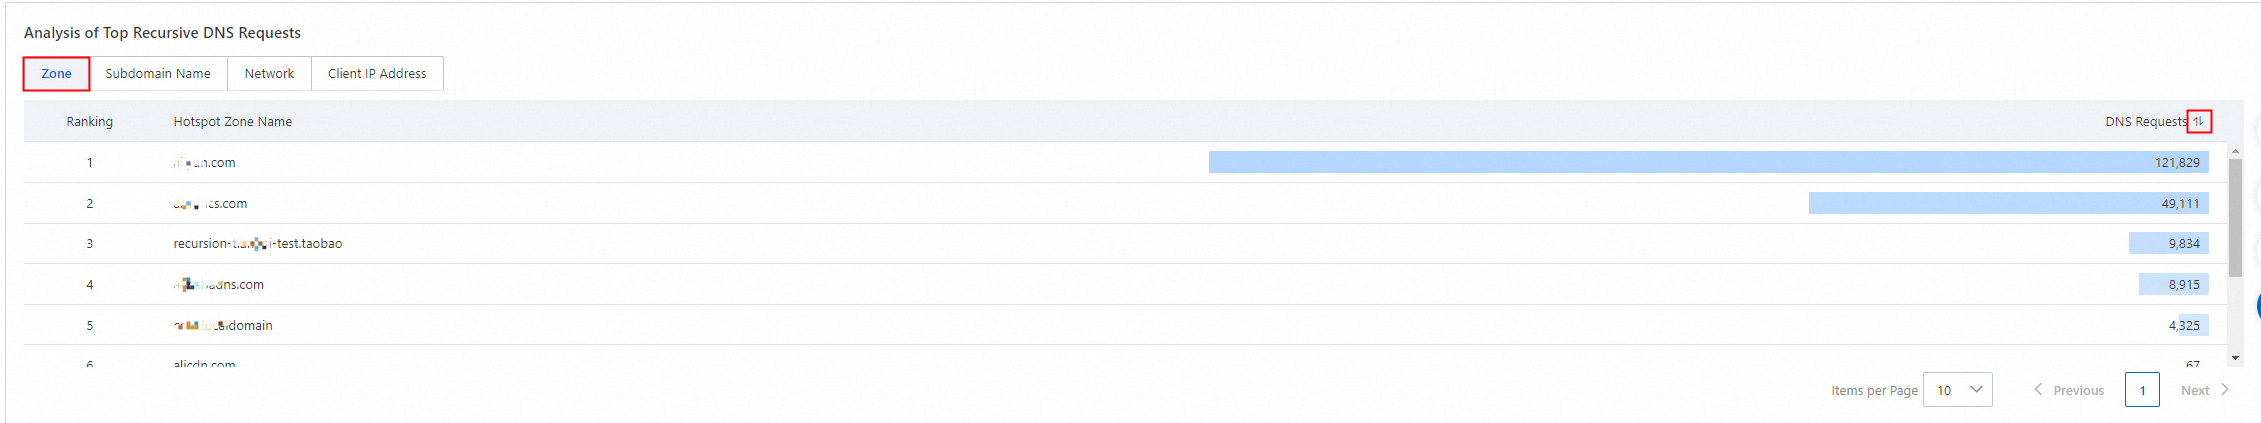
Top N analysis of recursive requests
You can analyze the ranking of resolution request volume by dimensions such as Domain, Subdomain, Network, and Client IP based on filters such as time range, specific network range, and client IP. The results can be sorted in ascending or descending order and are displayed in descending order by default. You can also click the zoom-in icon in the top-right corner to view the data in a larger format.
Hotspot domain request ranking
Hotspot subdomain request ranking
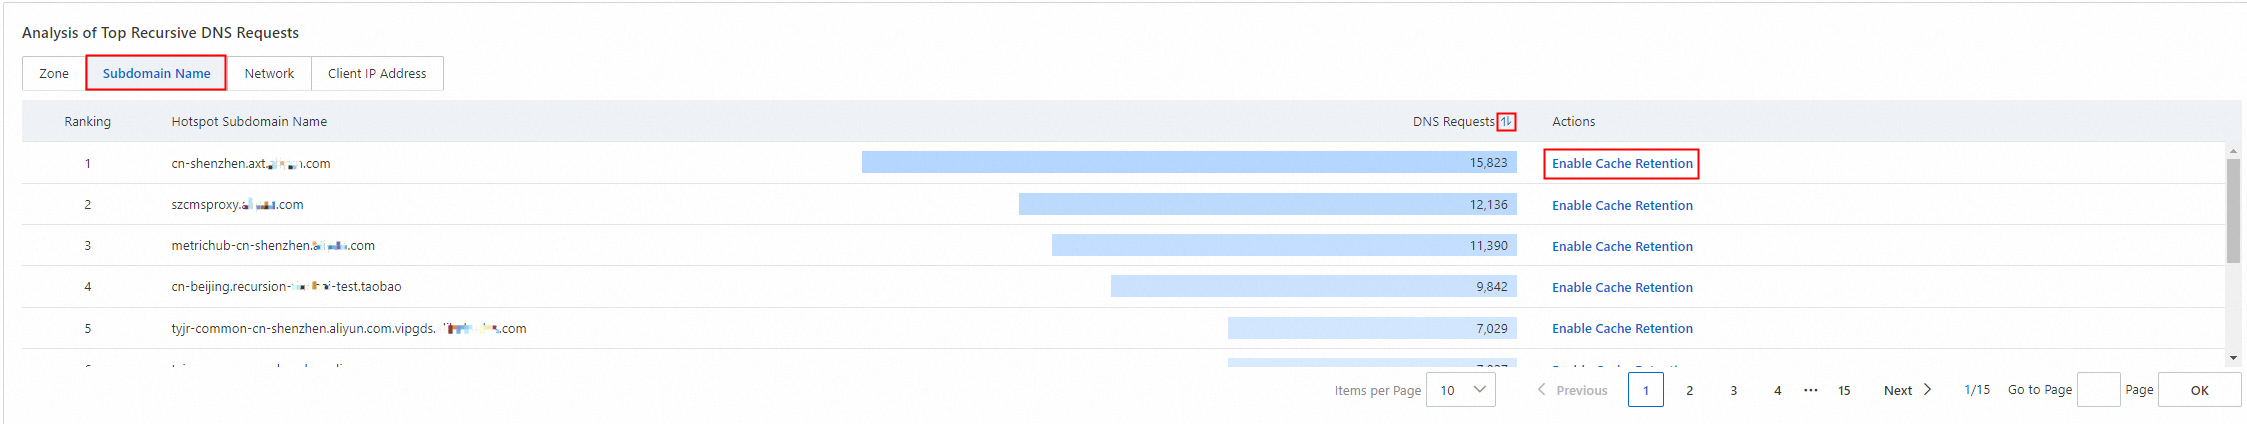
You can configure Enable Cache Persistence for subdomains. If you have already enabled the internal DNS resolution service, a page is immediately displayed for you to add and configure a domain for cache persistence. For domains where cache persistence is already enabled, the option to enable it is not displayed.
Hotspot network request ranking
Hotspot client IP request ranking
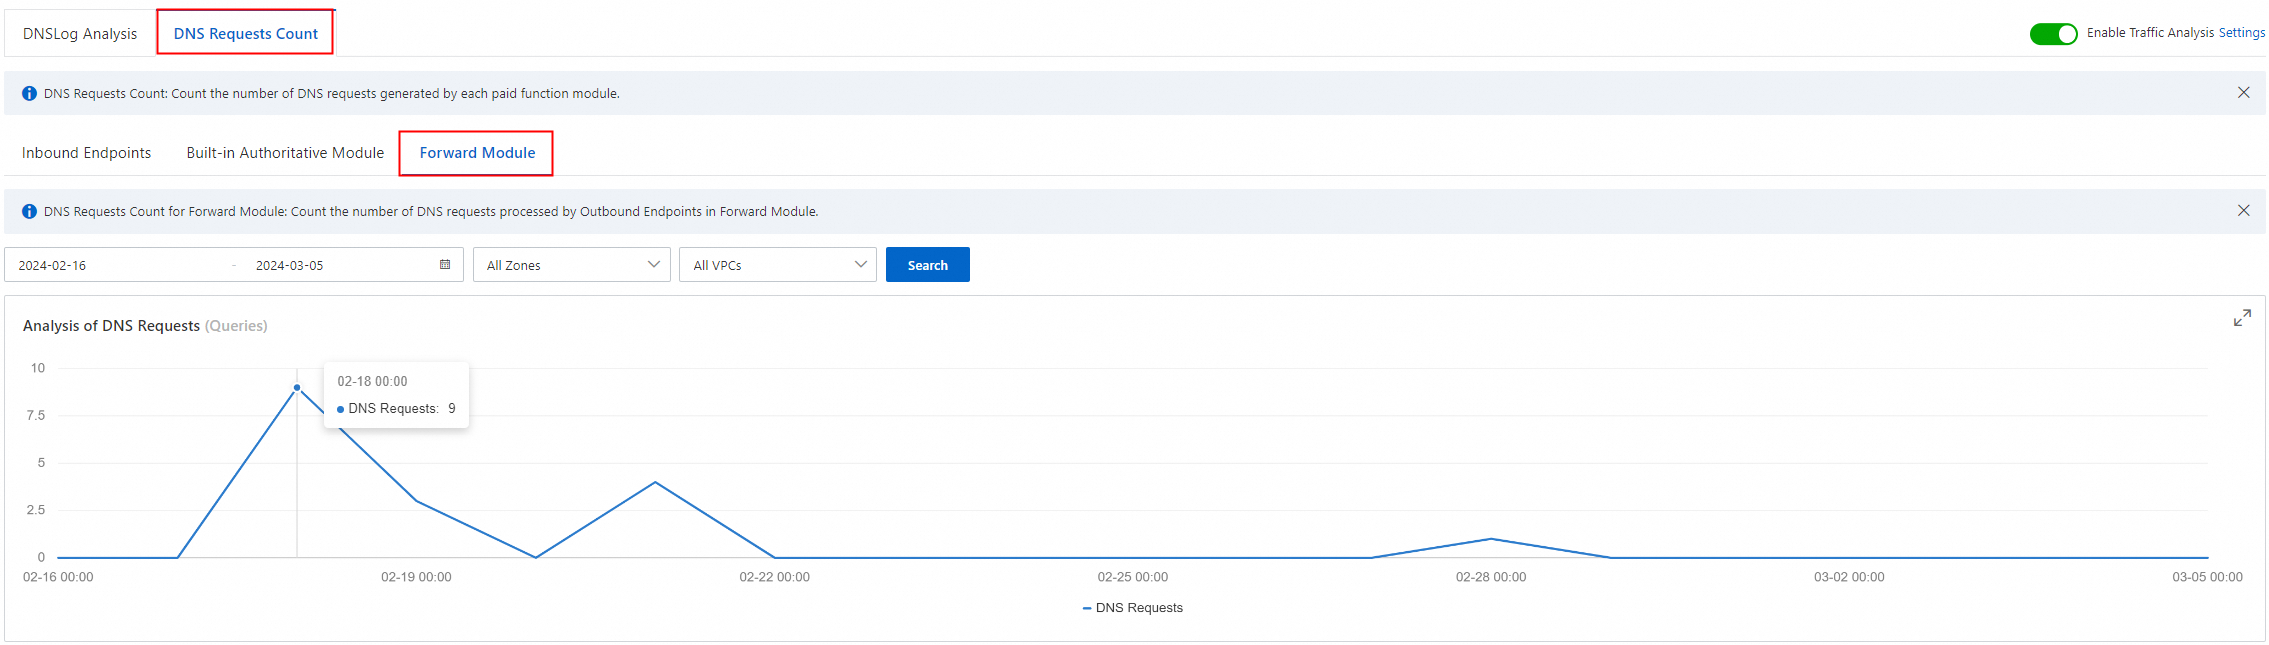
DNS Query Count
Inbound endpoint statistics
This section shows statistics for DNS requests received by all inbound endpoints in your account. You can query data for any time range within the last 90 days and filter by all inbound endpoints or a specific inbound endpoint name.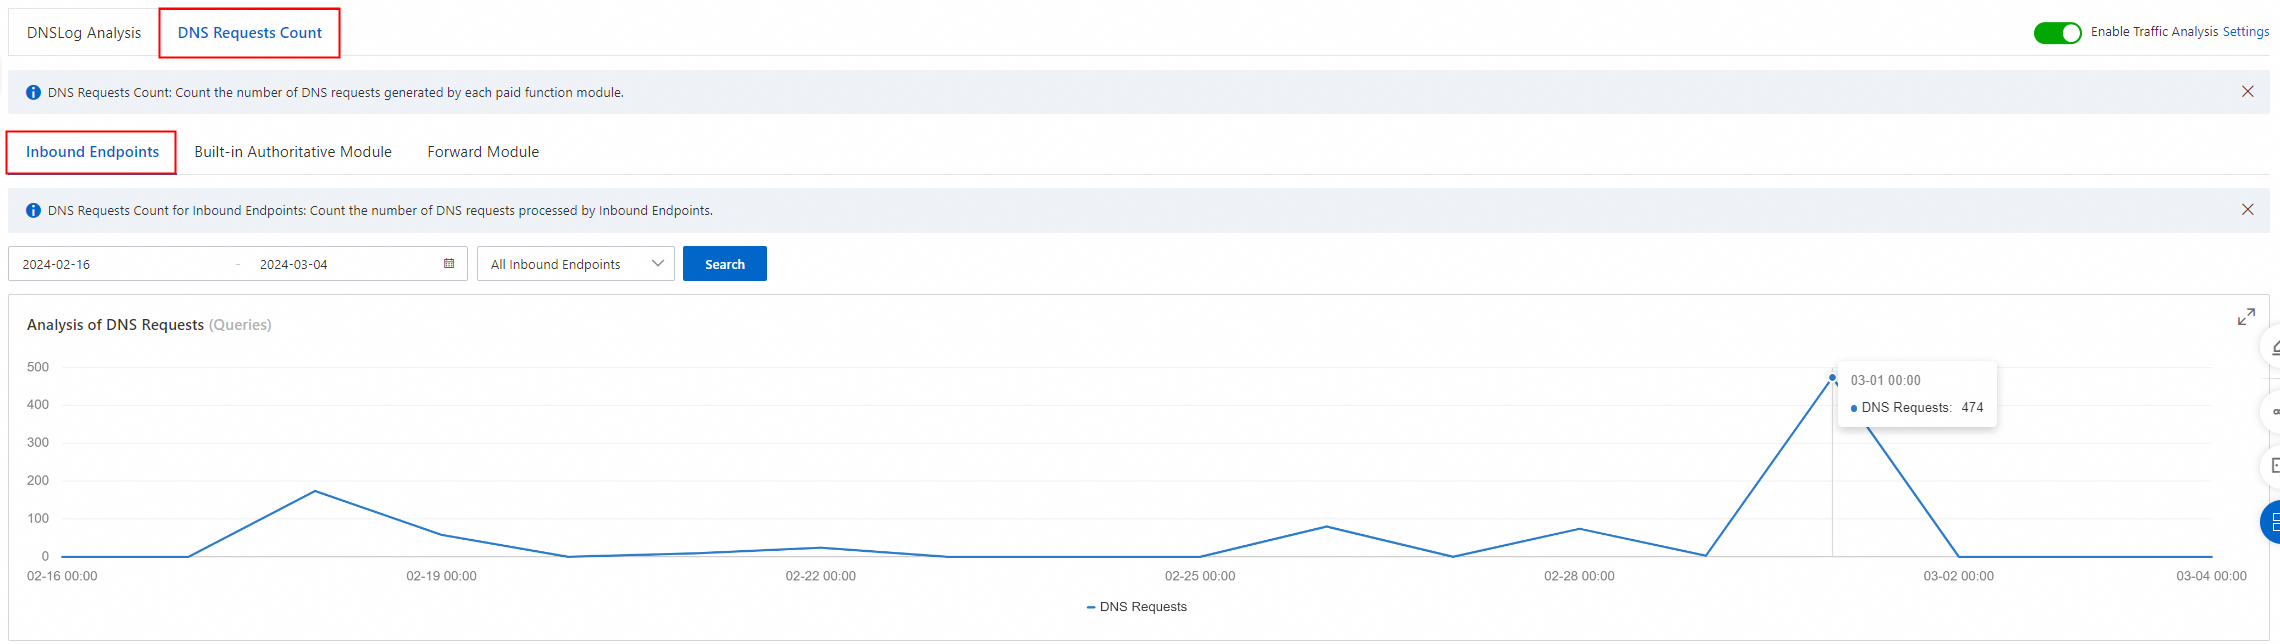
Built-in authoritative module statistics
This section shows statistics for DNS requests processed by all built-in authoritative modules in your account, including standard and accelerated built-in authoritative zones.
Built-in authoritative request trend
Displays the request volume trend for all domains within the specified time range. You can also filter the data by Zone name and VPC name.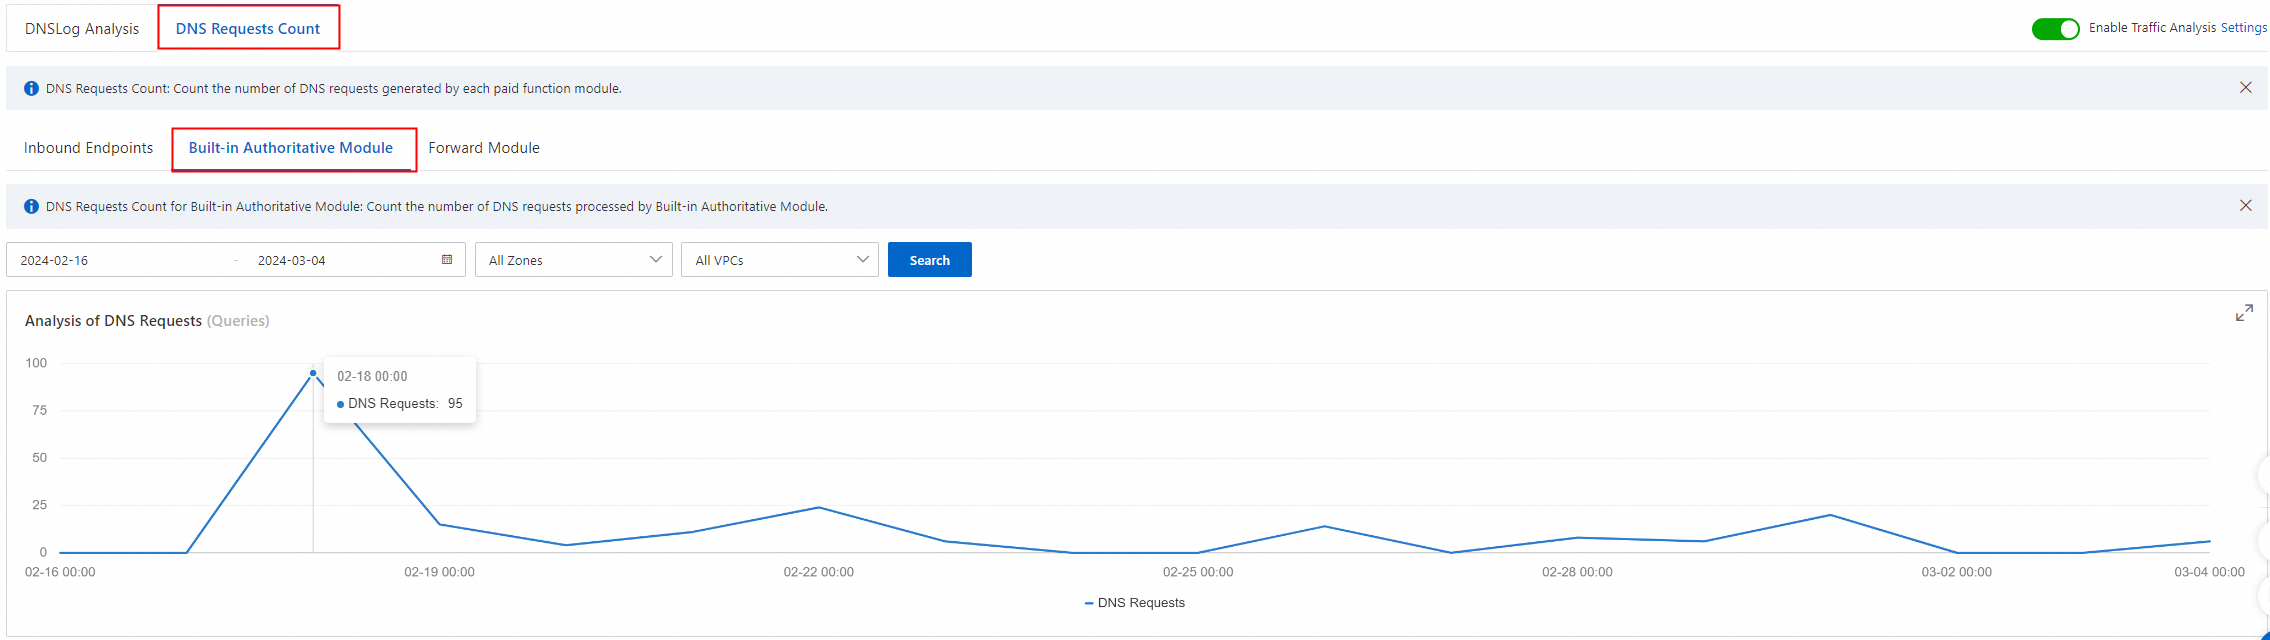
Domain request volume details
Displays detailed request volume data for each domain within the specified time range. You can sort the request volume in ascending or descending order, and perform exact and fuzzy searches by using keywords.
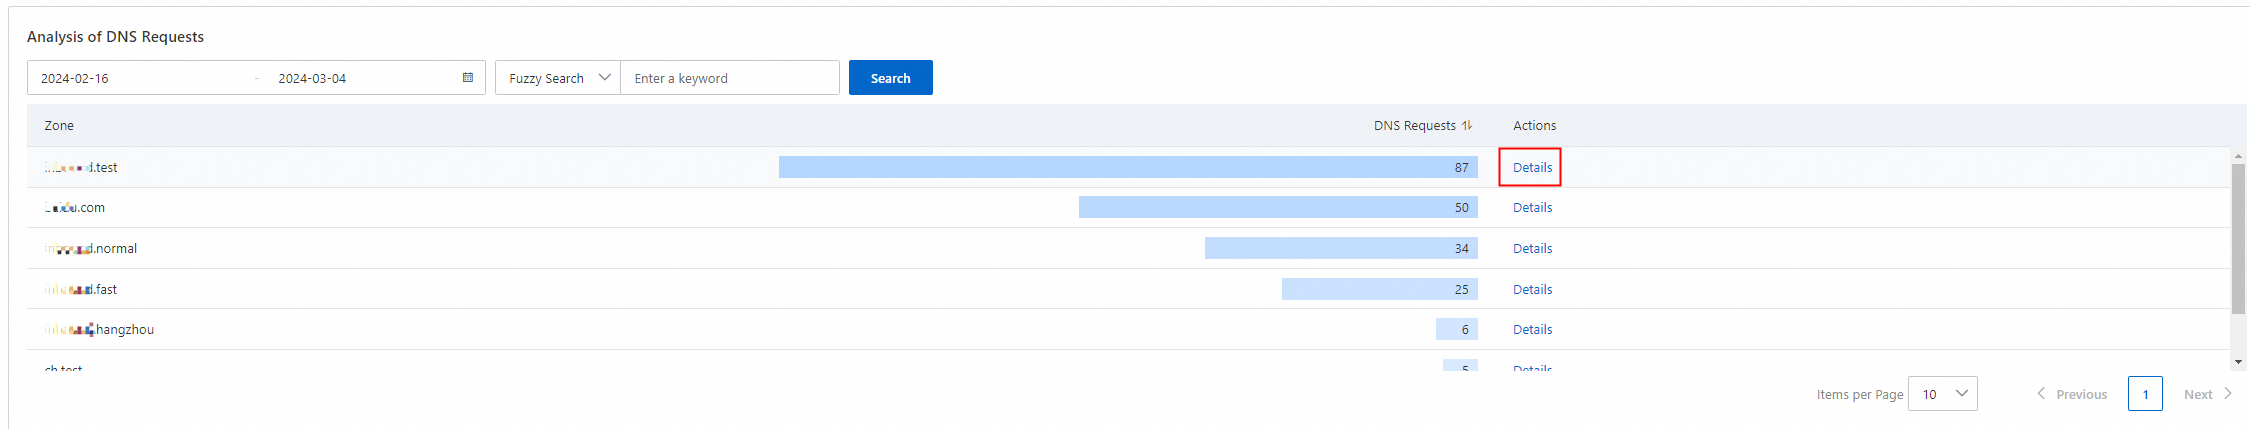
Subdomain request analysis
Clicking the Details button next to a domain displays the trend of its resolution request volume for the selected time period. The bottom of the page also displays a detailed breakdown of the resolution request volume for each subdomain. You can sort the request volumes in ascending or descending order and perform exact and fuzzy keyword searches.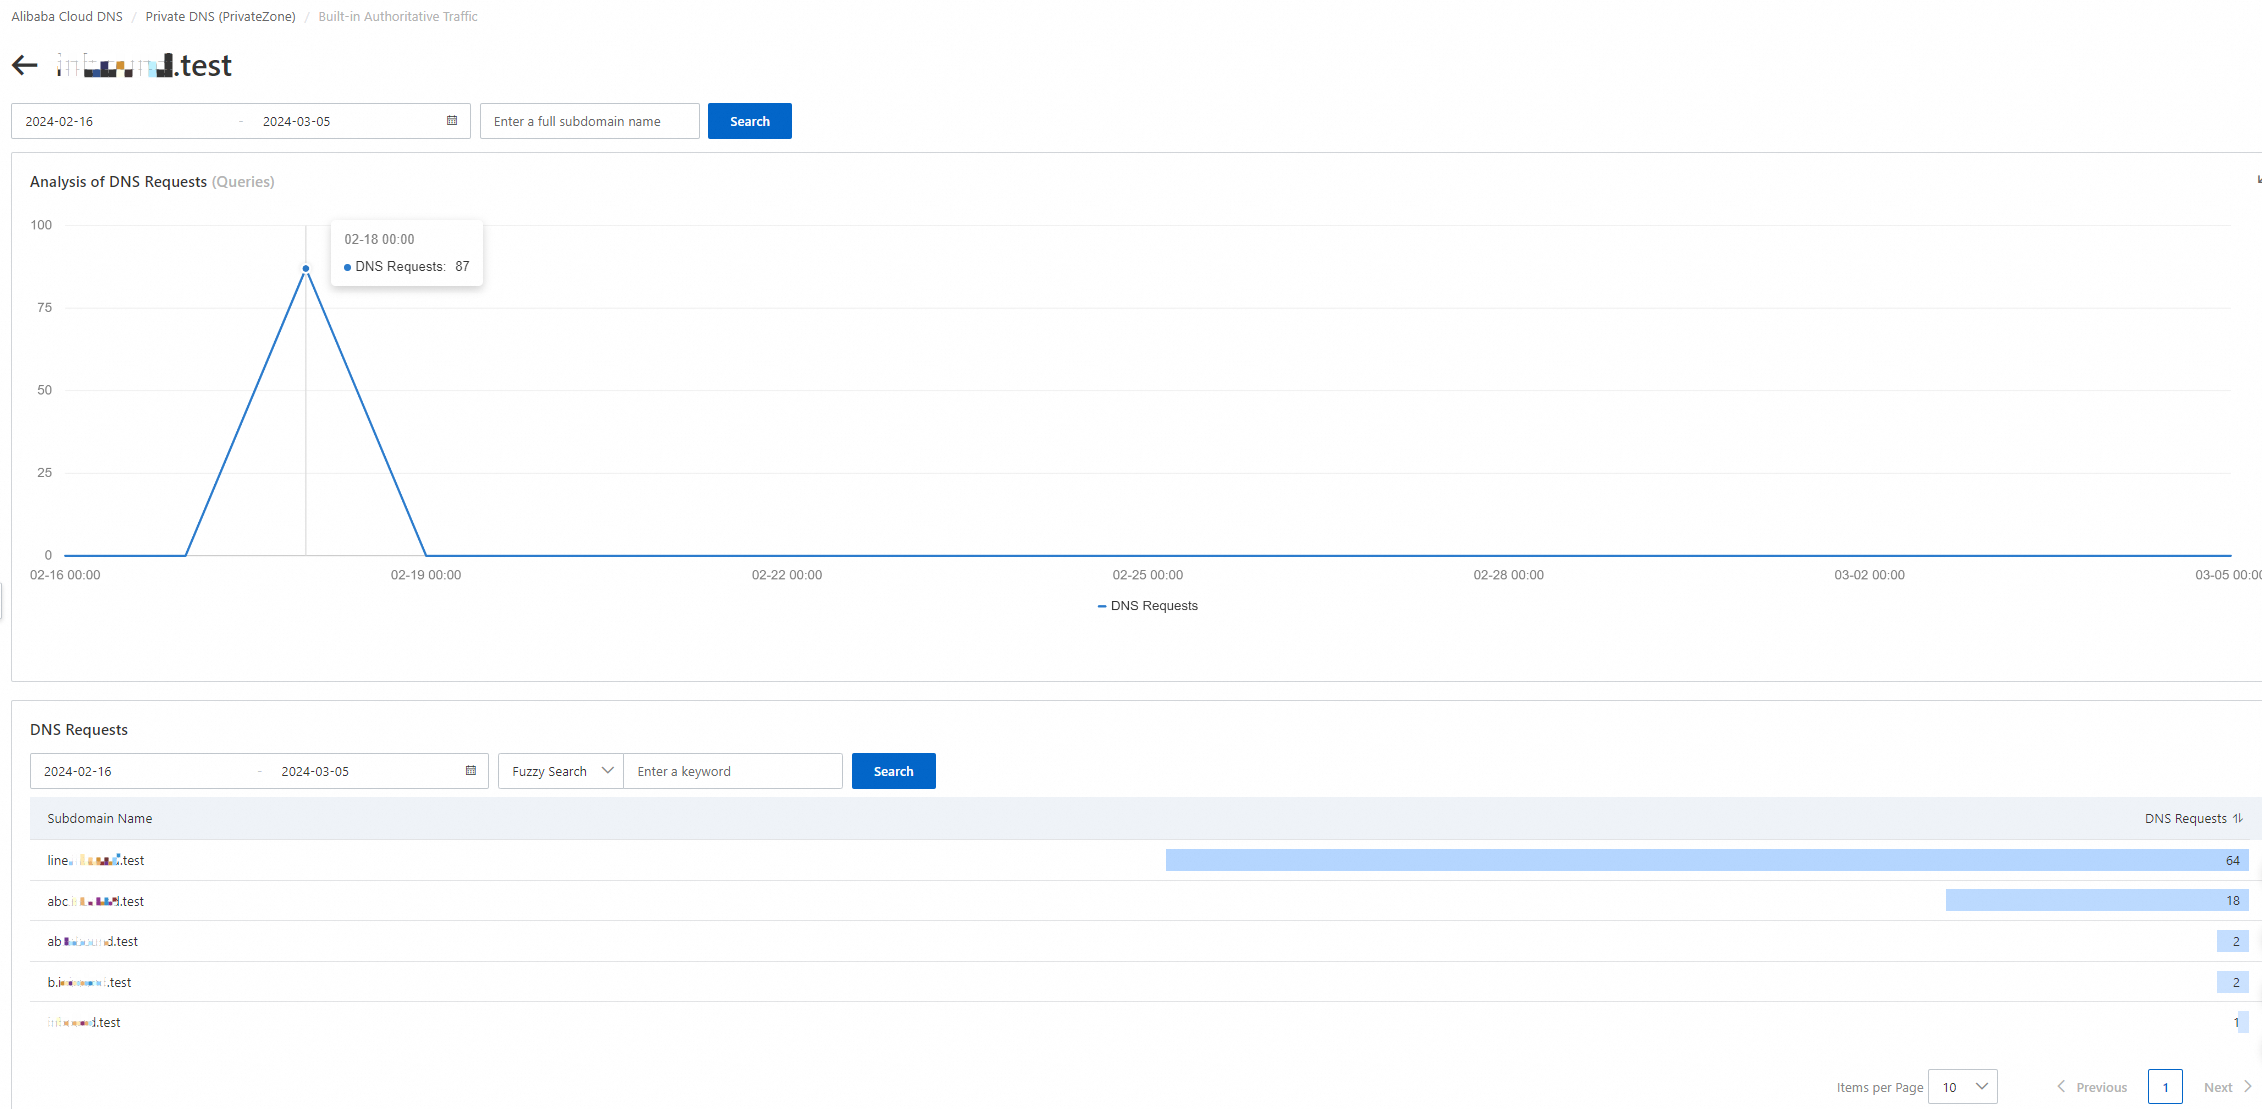
Forwarding module statistics
This section shows statistics for DNS requests handled by all outbound endpoints in your account.
Forwarded domain request trend
Displays the request volume trend for all domains within the specified time range. You can also filter the data by Zone name and VPC name.
Forwarded domain request volume details
Displays detailed request volume data for each forwarding domain within the specified time range. You can sort the request volume in ascending or descending order, and perform exact and fuzzy searches by using keywords.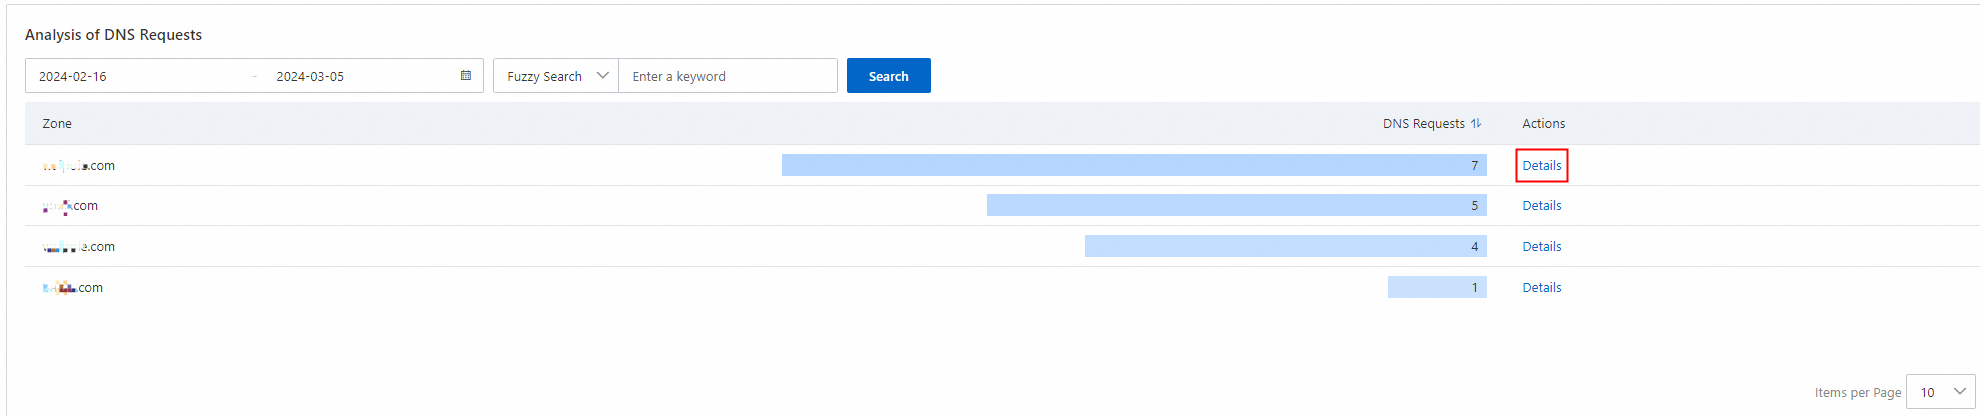
Subdomain request analysis
Click the Details button next to a domain to display a trend chart of the resolution request volume for that forwarded domain during the selected time period. The bottom of the page lists detailed data about the resolution request volume for each of its subdomains. You can sort this list by request volume in ascending or descending order and perform exact or fuzzy keyword searches.