The Probe Dashboard summarizes the core metrics for Domain Monitoring. It helps you understand the health of your domain name monitoring from multiple dimensions, such as overview, alerts, and details. You can use it to view global monitoring trends, detect abnormal tasks, and assess overall monitoring quality.
Scenarios
Understand the overall operational status of all monitoring tasks.
Quickly detect tasks with anomaly alerts.
Monitor global network probe counts and alert trends.
View network probe statistics and details for each monitoring task.
Analyze the distribution and results of network probe nodes.
Procedure
Go to the Probe Dashboard.
On the Probe Dashboard page, you can:
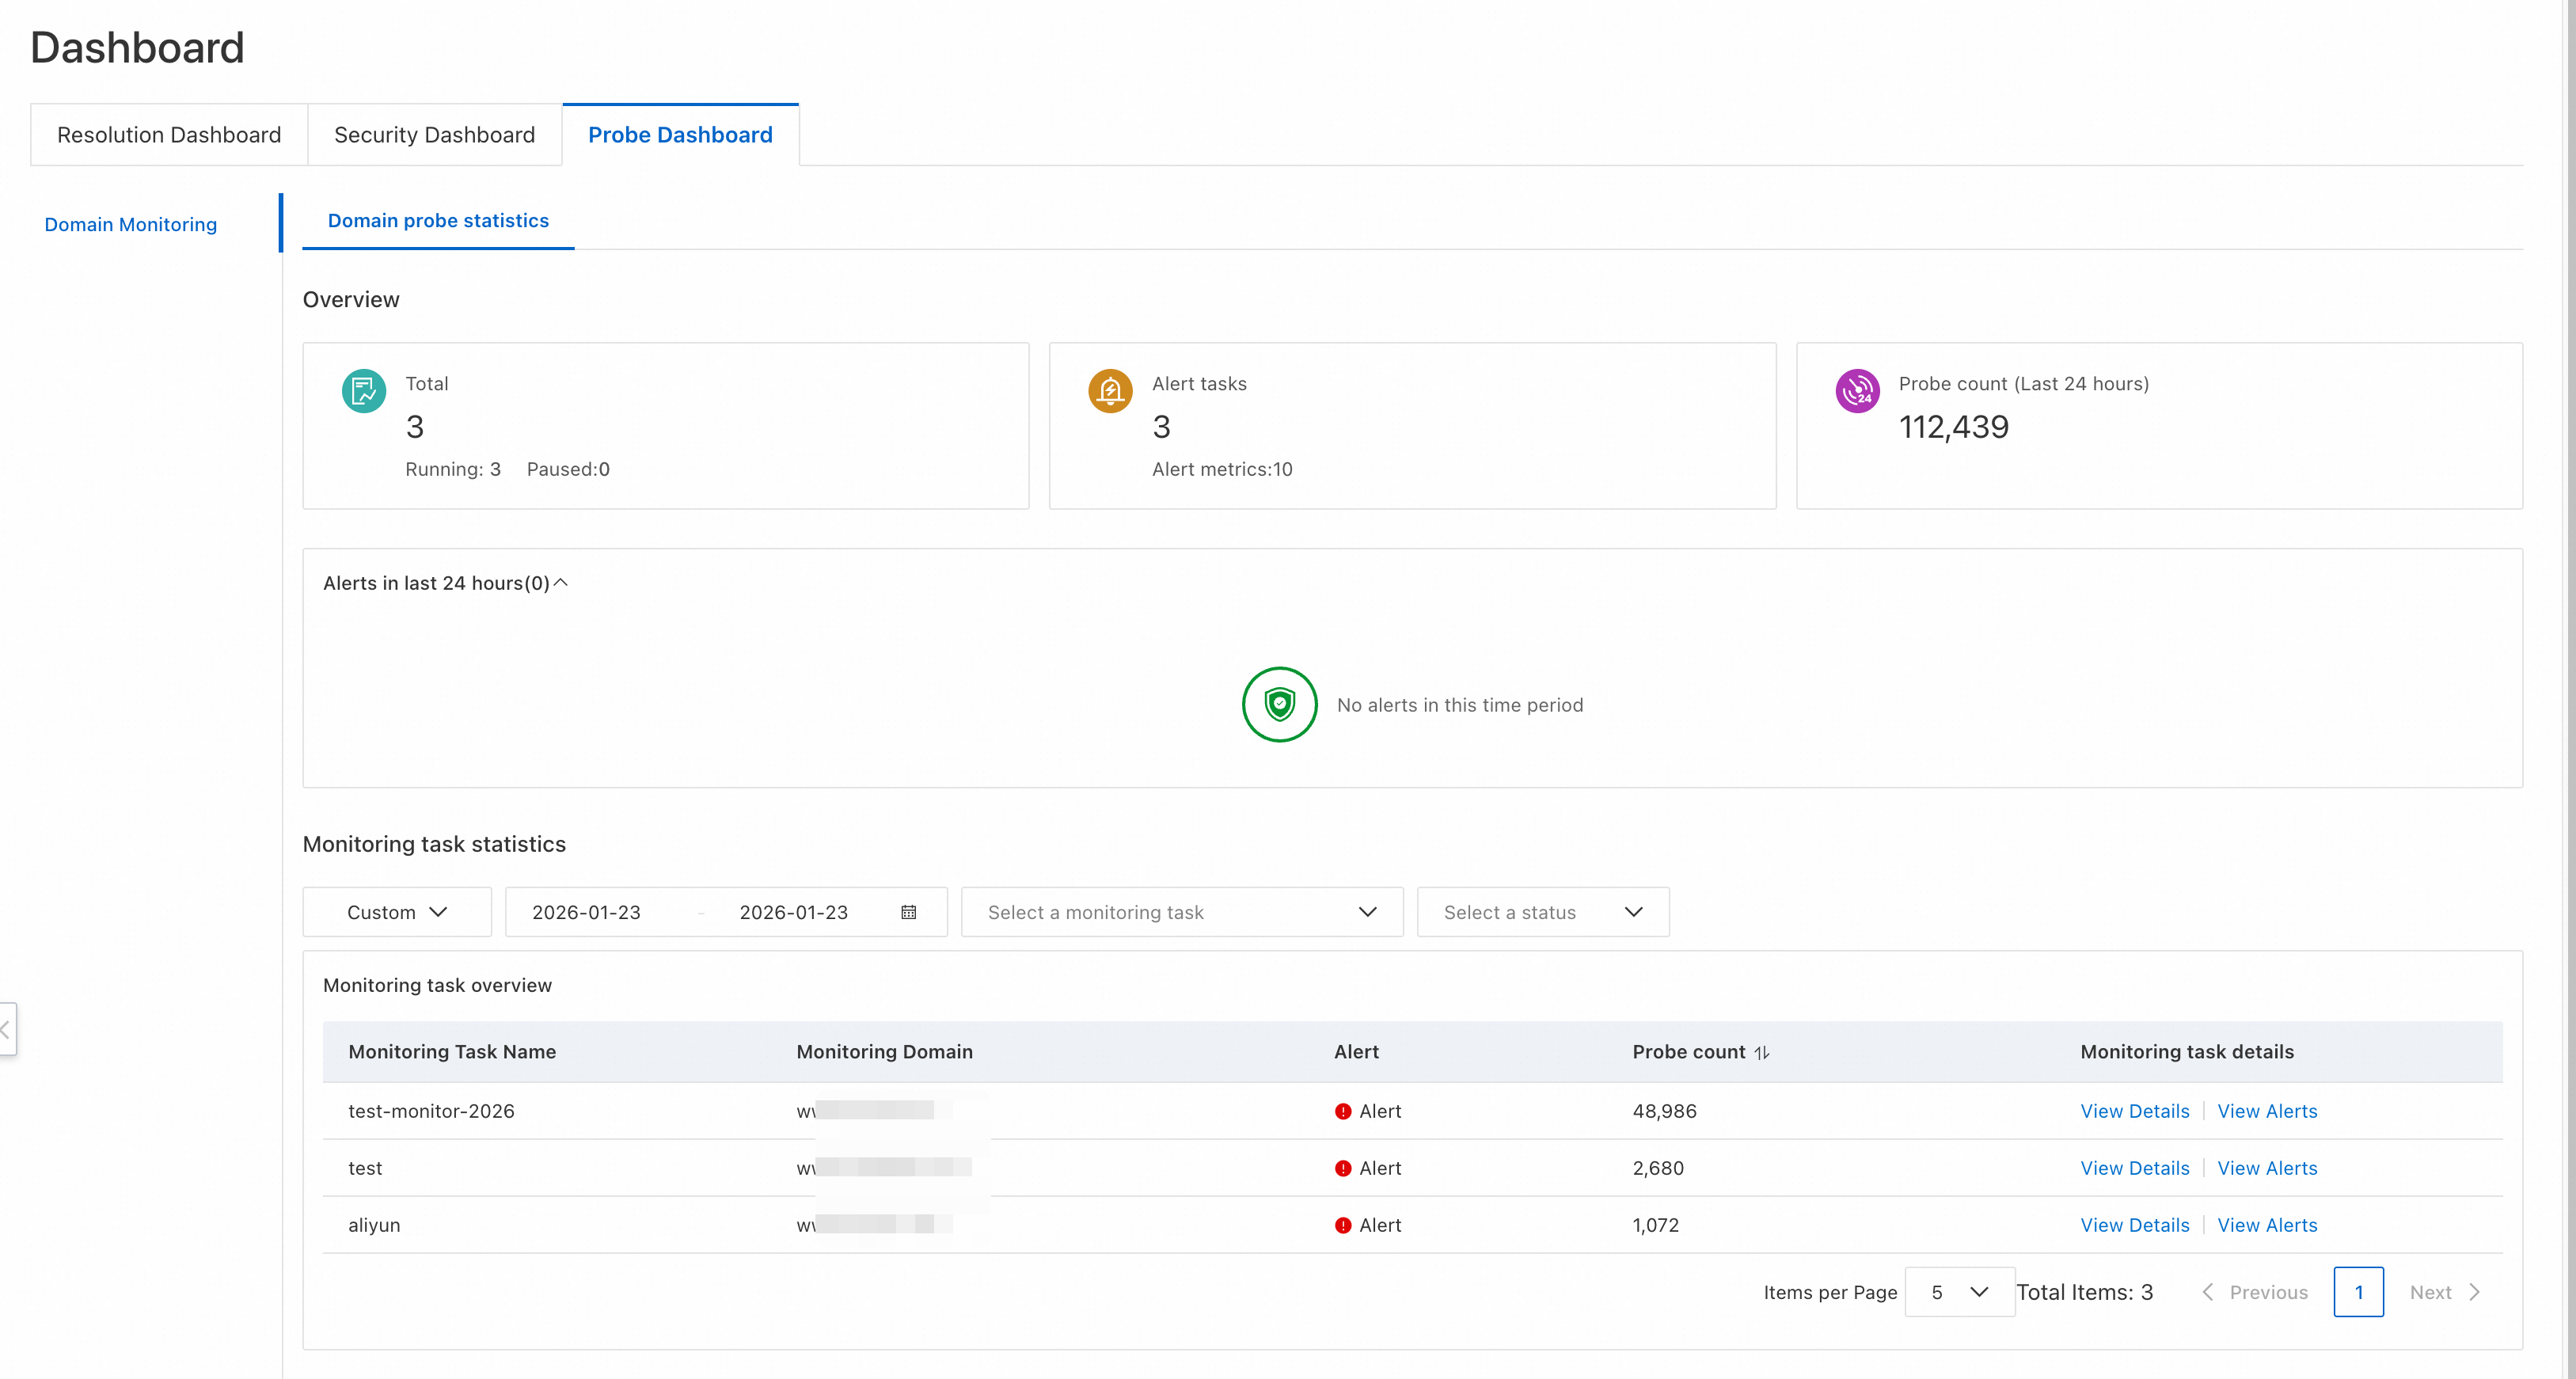
View the overall metrics in the overview section.
View the statistical overview of monitoring tasks.
View the statistical details of monitoring tasks and filter data by conditions such as network probe nodes and tasks.
Feature modules
Overview
Metric name | Description |
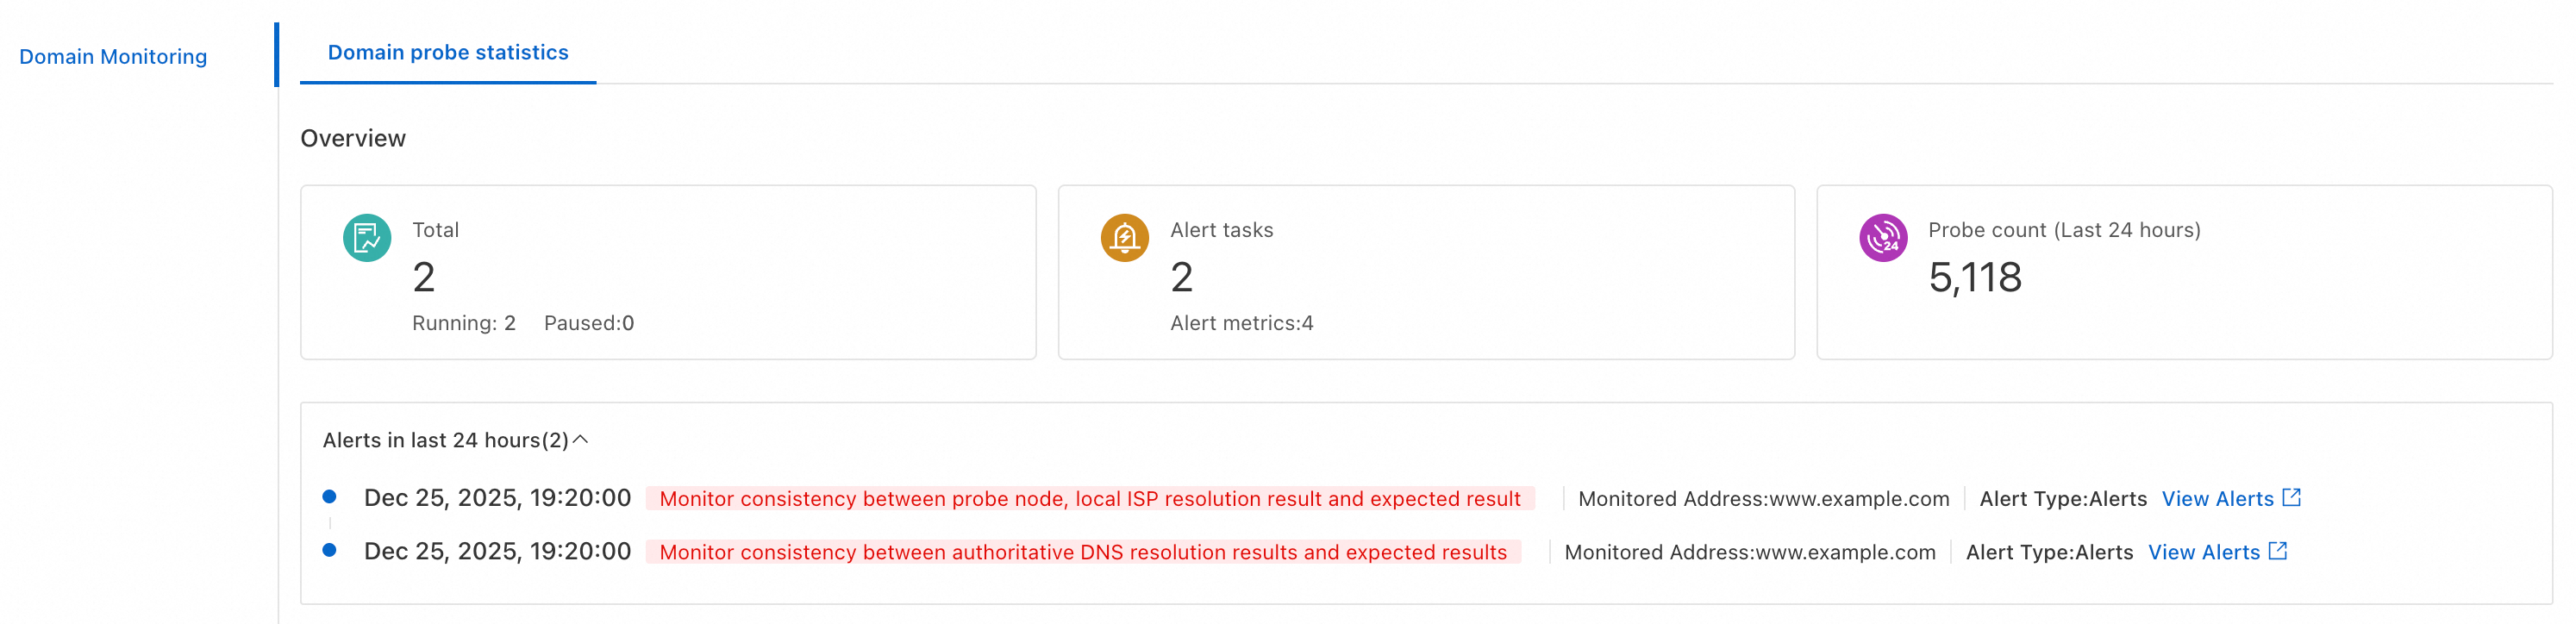
Total | The total number of created tasks, including both running and paused tasks. This metric helps you understand the overall scale of your current monitoring tasks. |
Alert tasks | The number of tasks with an abnormal monitoring status that have triggered alerts. This helps you quickly detect abnormal tasks that require attention. |
Probe count (Last 24 hours) | The total number of network probes performed by all monitoring tasks in the last 24 hours. This helps you assess the popularity and data collection volume of your monitoring tasks. |
Alerts in last 24 hours | A summary of metrics that triggered alerts in the last 24 hours. This helps you understand recent alert activity. You can click to view detailed alert logs. Important If a website metric remains in an abnormal state, the alerting system may apply alert suppression. This can result in an empty alert log for the last 24 hours. Address alerts promptly. |
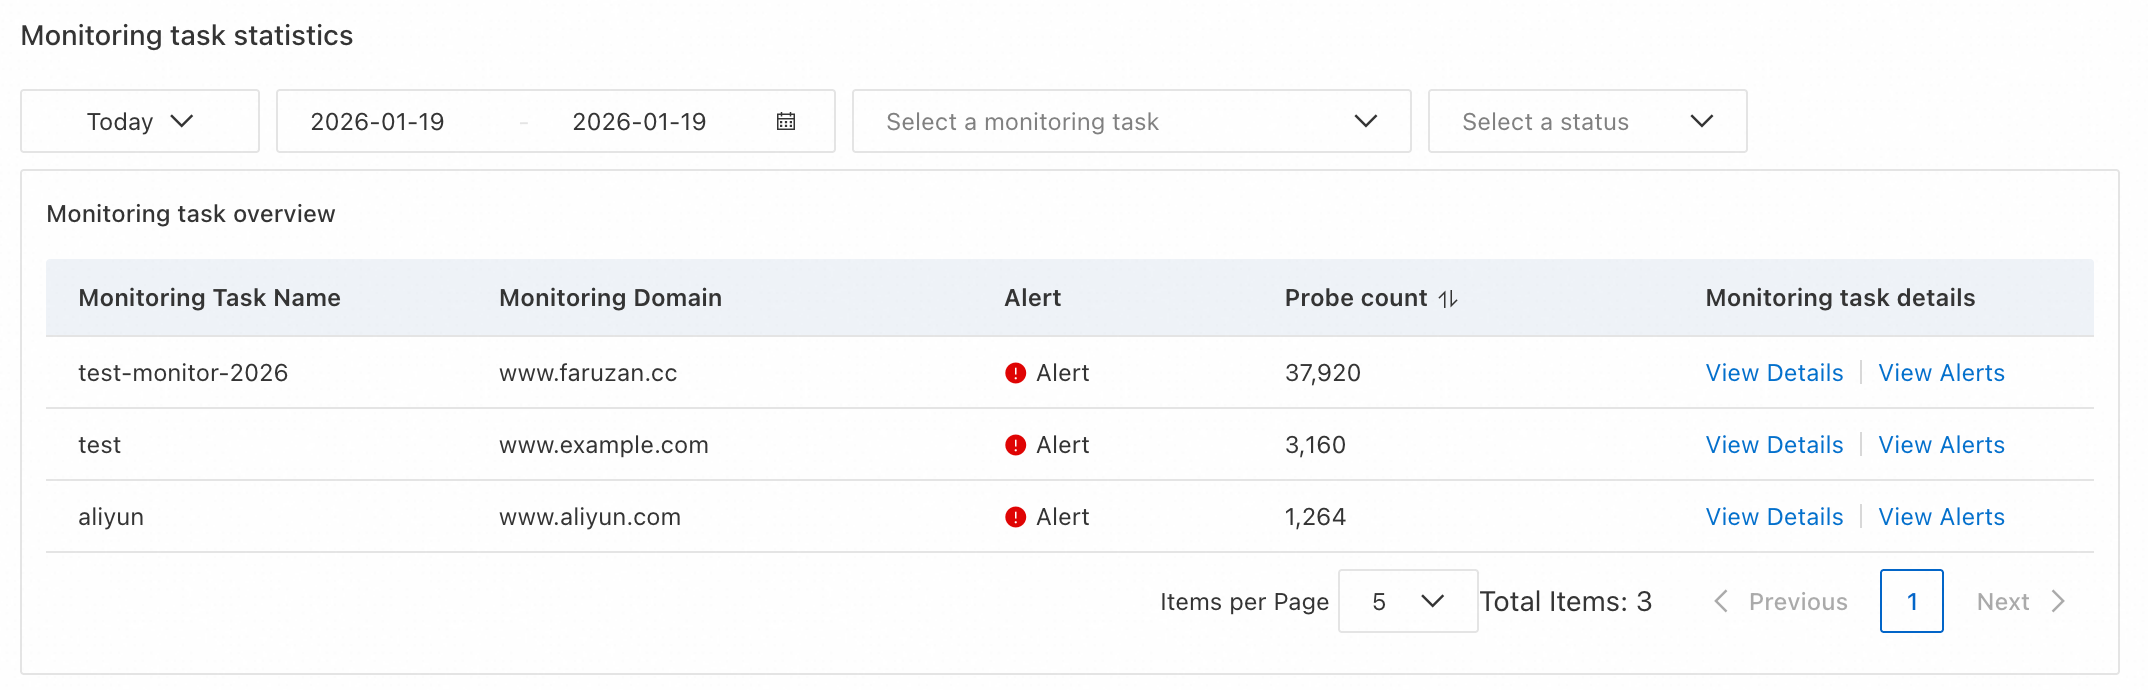
Monitoring task statistics
This section summarizes the number of network probes for each monitoring task within a specified time range. The maximum time span is 90 days.
Instructions:
In the time range picker, select a time range, such as Today, Last 7 days, Last 30 days, or a custom time range.
To the right of a monitoring task, click View Details to view its statistical details.
Monitoring task details
The monitoring task statistics details section provides a detailed view of the network probe node distribution and results.
Left side: The map on the left shows the geographical distribution of network probe nodes, helping you understand your monitoring coverage.
Right side: The right side displays detailed data for the most recent network probe epoch, categorized by monitoring type.
Metric | Description |
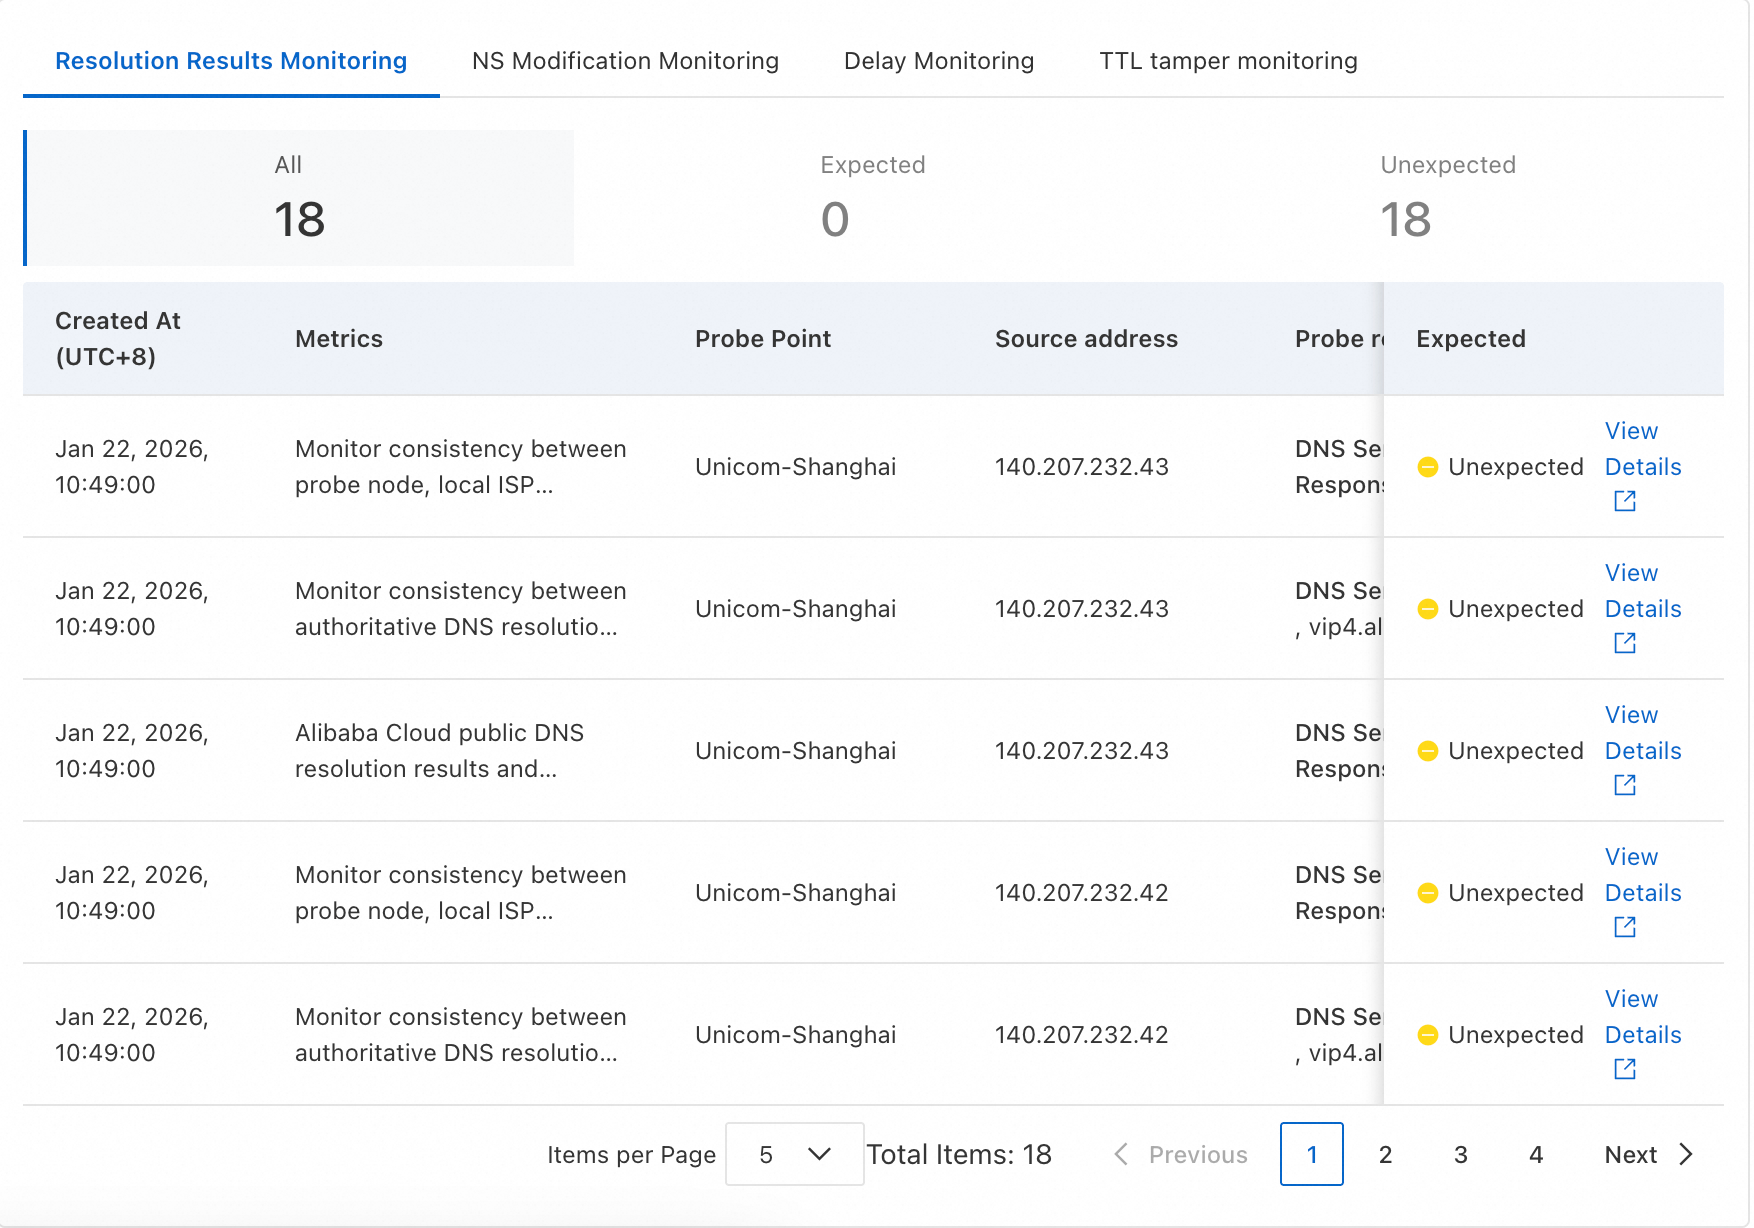
Resolution Results Monitoring | Parsing result monitoring is used to validate whether the IP address returned by a DNS query meets expectations. The data shows the network probe logs and results for the most recent network probe epoch.
|
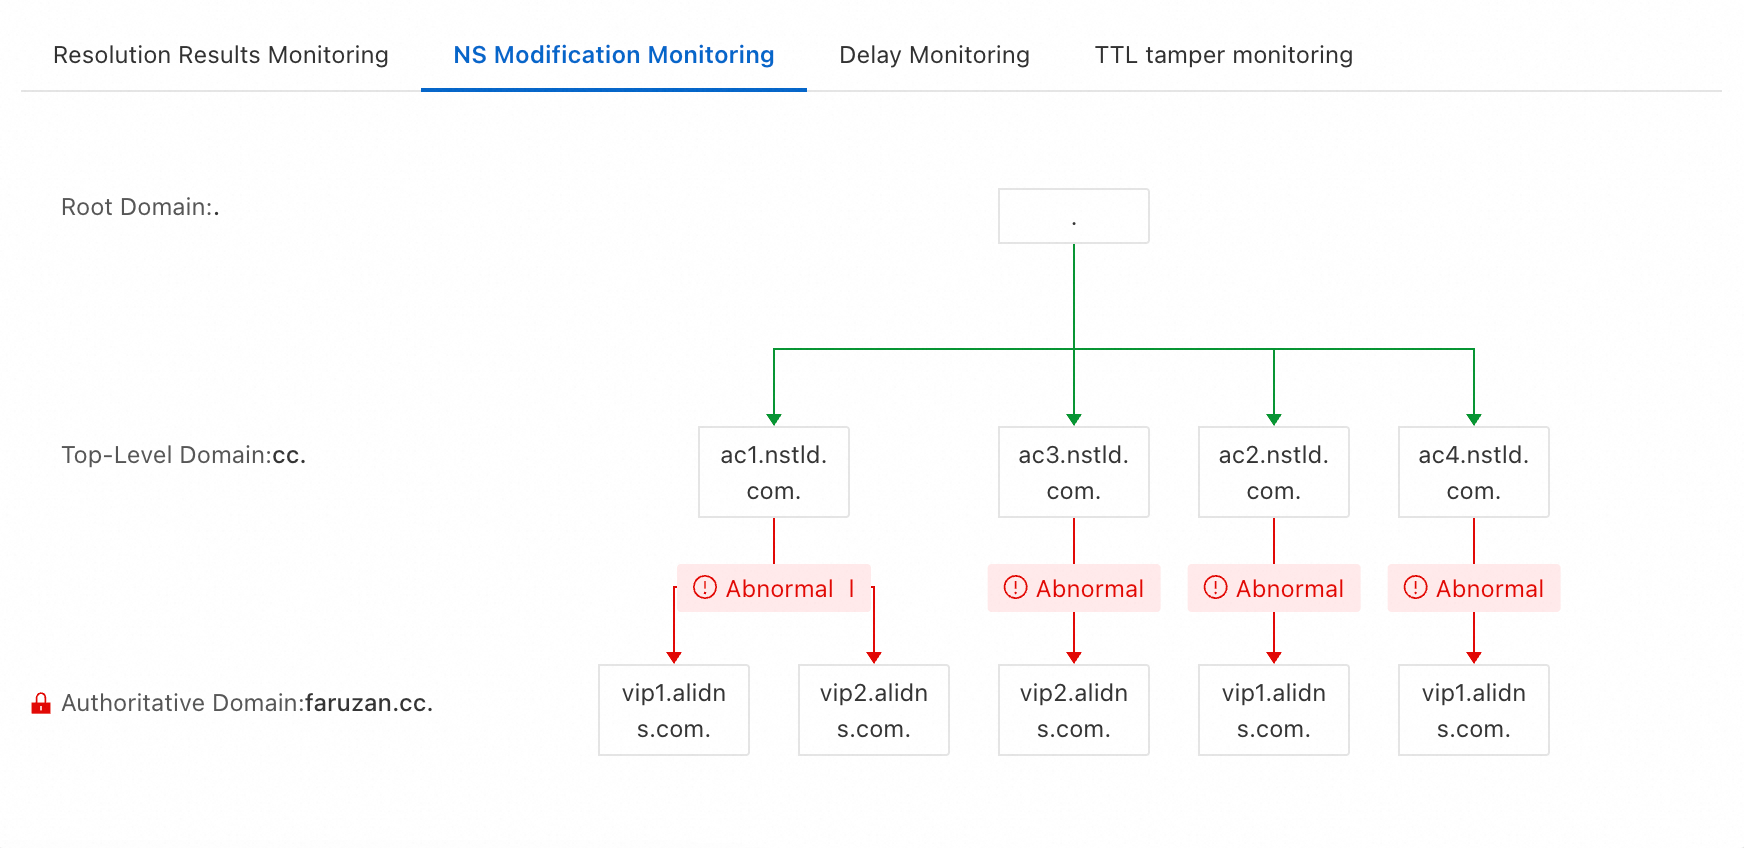
NS Modification Monitoring | Domain name NS tampering monitoring is used to monitor the integrity of the domain name's NS authorization chain. The data shows whether the NS server records for each level of the domain name in the NS authorization chain are consistent with expectations for the most recent network probe epoch. Hover your mouse over |
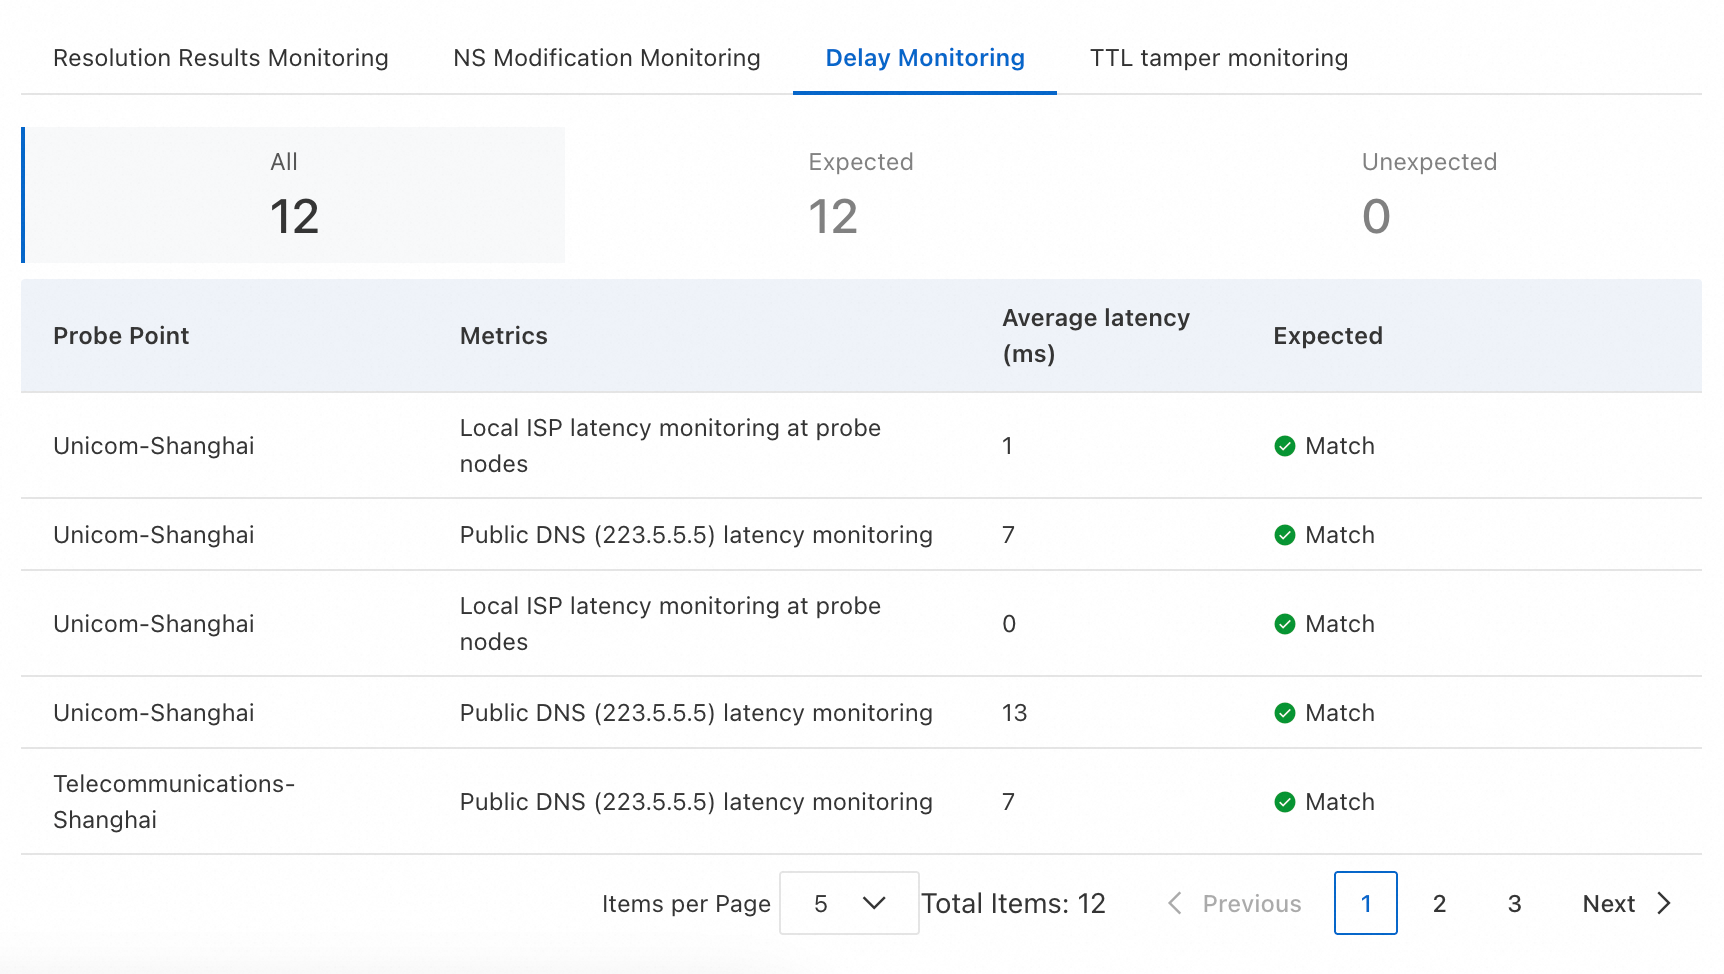
Delay Monitoring | Parsing latency monitoring is used to monitor the response time of DNS parsing and ensure that the latency is within the expected threshold. The data shows the parsing latency and results for each network probe node during the most recent network probe epoch.
|
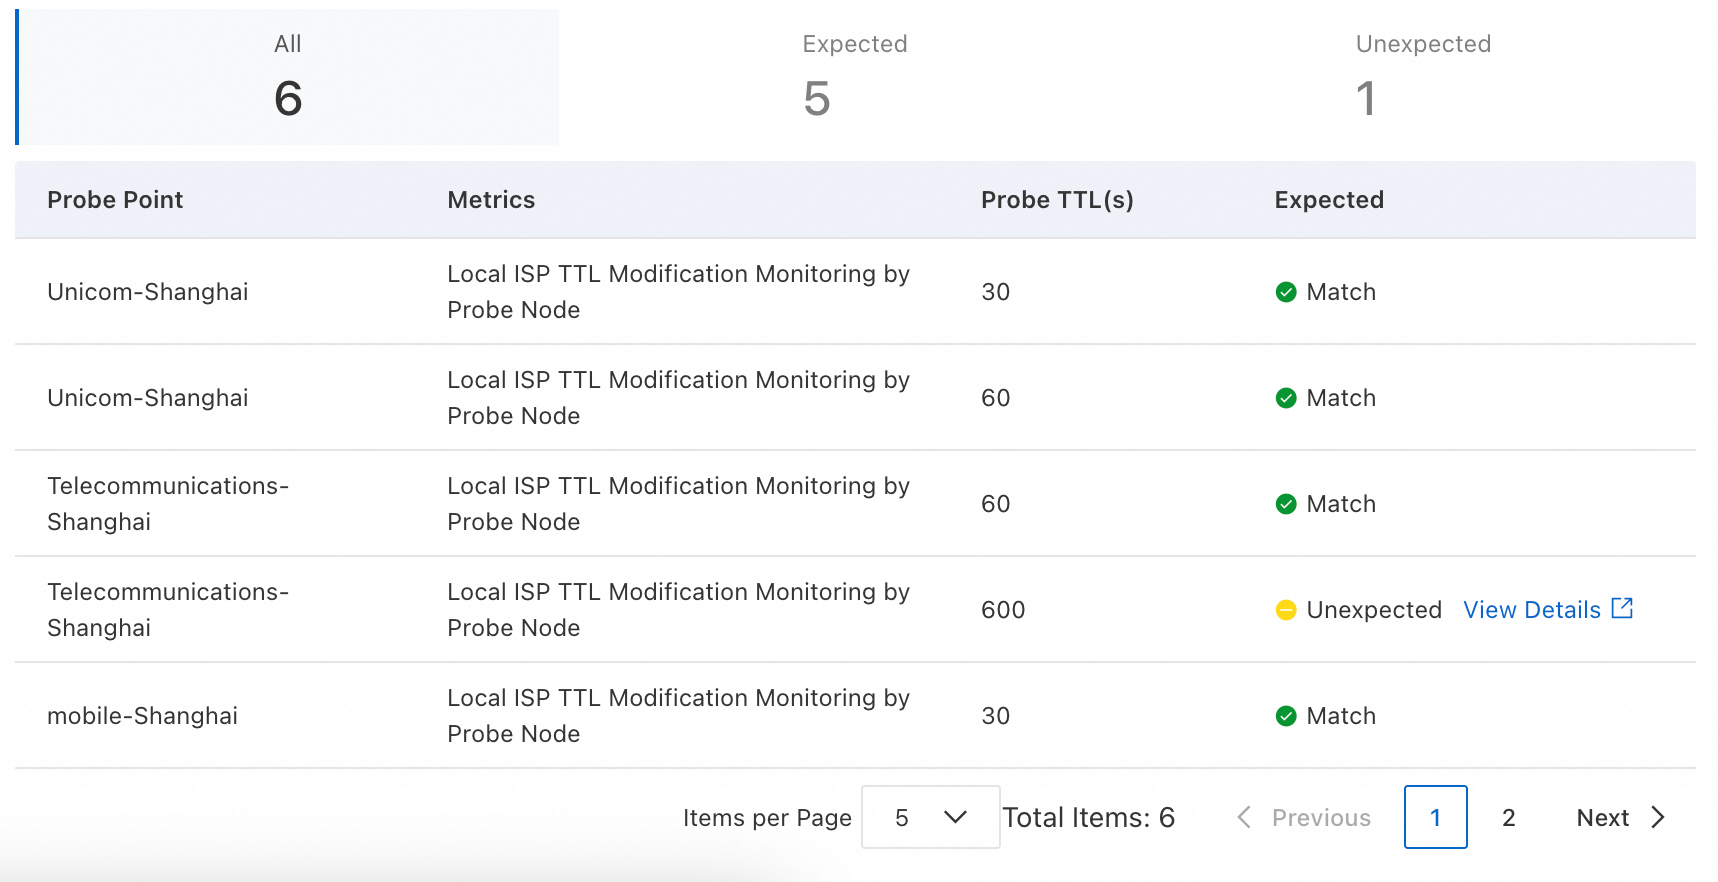
TTL tamper monitoring | TTL tampering monitoring is used to monitor whether the TTL value returned in a DNS response is correct, which helps detect potential TTL tampering behavior. The data shows the TTL information and probe results for each probe node during the most recent network probe epoch.
|