DMS Jupyter Notebook is an interactive workspace that combines SQL queries, Python code, text, and charts in a single document. It is compatible with open source Jupyter Notebook and adds enhanced SQL query and visualization capabilities on top.
Notebook UI
| Icon | Action | When to use |
|---|---|---|
| Save | Save edits to the notebook | |
| Insert cell above | Add a new cell before the selected cell | |
| Delete cell | Remove the selected cell | |
| Cut cell | Cut the selected cell | |
| Copy cell | Copy the selected cell | |
| Paste | Paste copied content into the selected cell | |
| Run cell | Execute the selected cell | |
| Stop kernel | Interrupt a running execution | |
| Restart kernel | Reset the kernel state | |
| Restart and run all | Restart the kernel and re-run every cell from top to bottom | |
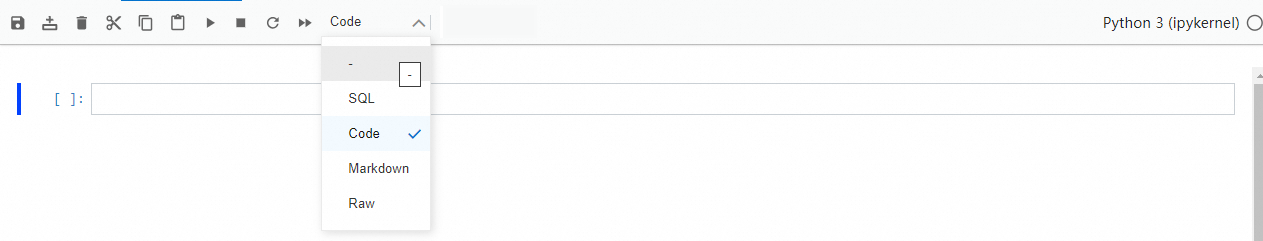
| Change cell type | Switch the selected cell between Code, SQL, Markdown, and Raw | |
| Open Copilot | Open the Copilot pane for AI-assisted SQL generation and data analysis |
Kernels and capabilities
DMS Jupyter Notebook supports two kernels: IPython kernel and PySpark kernel. The kernel you choose determines which execution environment runs your code.
IPython kernel
The IPython kernel works like standard open source Jupyter Notebook. Install extension packages with pip and access the notebook over the Internet.
Query data with Spark SQL
Use any of the following three methods to run Spark SQL queries in an IPython kernel notebook.
Method 1: Python API
df = spark.sql("select * from customer limit 10").show();Method 2: Magic command
%%spark_sql
select * from customer limit 10;
Method 3: Cell type selector
In a cell, choose SQL > Spark SQL and enter an SQL statement.

CREATE TABLE IF NOT EXISTS 'default'.'select_2' AS SELECT 2;A Spark SQL cell displays up to 3,000 rows by default. To change this limit, set the environment variable in a code cell:
os.environ['DMS_SPARK_SQL_DEFAULT_LIMIT'] = '3000';Query data with SQL cells
Switch a cell type to SQL to run queries using logical data warehouse syntax. SQL cells support cross-database queries and real-time analysis. The required permissions follow the fine-grained permissions configured in DMS.
Pass variables between cells
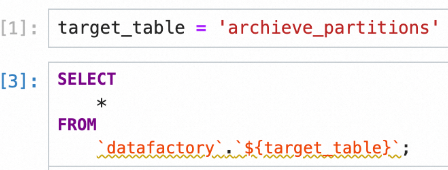
SQL cells and Python cells can share data through variables using the ${variable name} syntax.
| From cell type | To cell type | Syntax | Example |
|---|---|---|---|
| Python (IPython) | SQL | ${variable name} |
SELECT * FROM orders WHERE id = ${order_id} |
| SQL (result set) | Python | Variable name shown in lower-left corner of result set | df.head() |
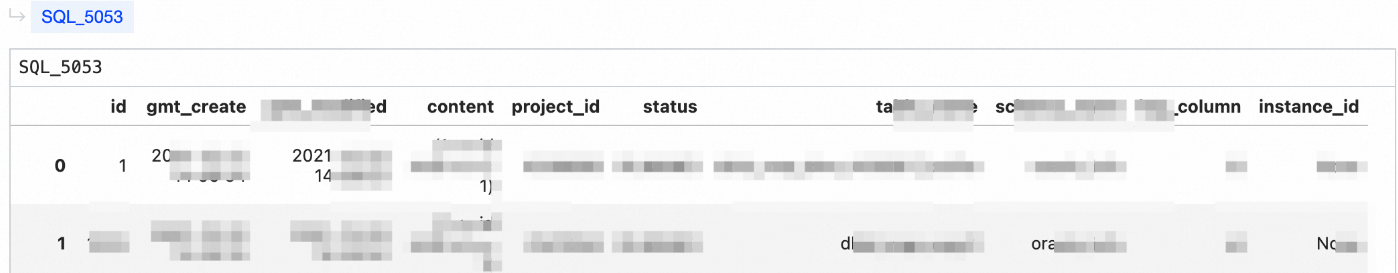
When an SQL cell runs, its result set is automatically available as a variable in IPython. The variable name appears in the lower-left corner of the result set, and the type is pandas.core.frame.DataFrame. Click the variable name to rename it.
Visualize query results
After running an SQL query, switch the result set display between table and chart views by clicking the corresponding icon.
PySpark kernel
The PySpark kernel connects to AnalyticDB Spark by default. You can also use open source Spark in a notebook.
Run %%help to list all supported Spark Magic commands.
Spark Magic is an extension of Jupyter Notebook.
Use AnalyticDB Spark
Before using AnalyticDB Spark, complete the following prerequisites:
The following commands are available after completing these prerequisites.
| Command | Description |
|---|---|
%%info |
View AnalyticDB Spark configurations |
%%sql |
Submit an SQL statement to AnalyticDB Spark; create, read, and write C-Store tables. See Read and write internal tables |
%%spark |
Submit Python code to AnalyticDB Spark |
AnalyticDB Spark retains a new session for 20 minutes and deletes the session after it expires. Restart the kernel to create a new session.
Upload and download files
Use ossutil to upload and download datasets. For setup instructions, see Configure ossutil.
Query and analyze data in a notebook
This section walks through a complete workflow: creating a notebook, writing SQL queries, visualizing results, and predicting data trends using Python.
Create a notebook and query data
-
Create a notebook. On the
 tab, click
  and select Notebook.
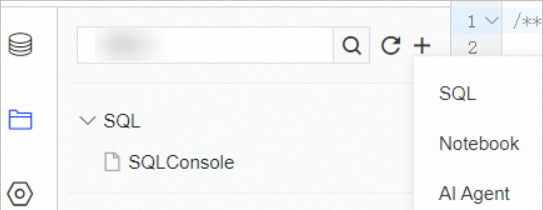
-
Enter content in the cells using SQL, Code, Markdown, or Raw syntax.
-
(Optional) Use Copilot to generate SQL statements.
-
After verifying the SQL statement, run it and view the results. In the upper-right corner of the SQL cell, click Execute Query. The SQL statement is automatically inserted into the document, and the result set appears below it.
-
Display the result set as a table:
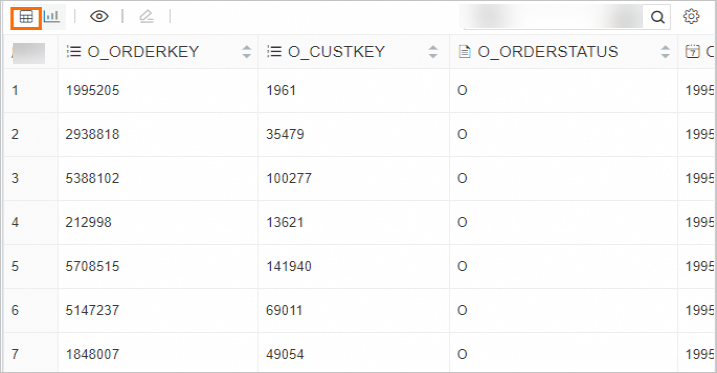
-
Display the result set as a chart:
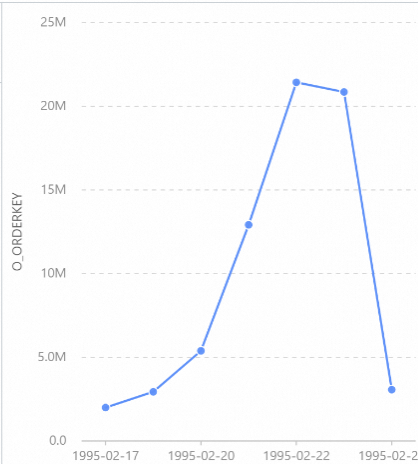
-
-
Reference the result set as a variable in other cells. After the SQL cell runs, its result set is available as a
pandas.core.frame.DataFramevariable. Rename it by clicking the variable name in the lower-left corner of the result set.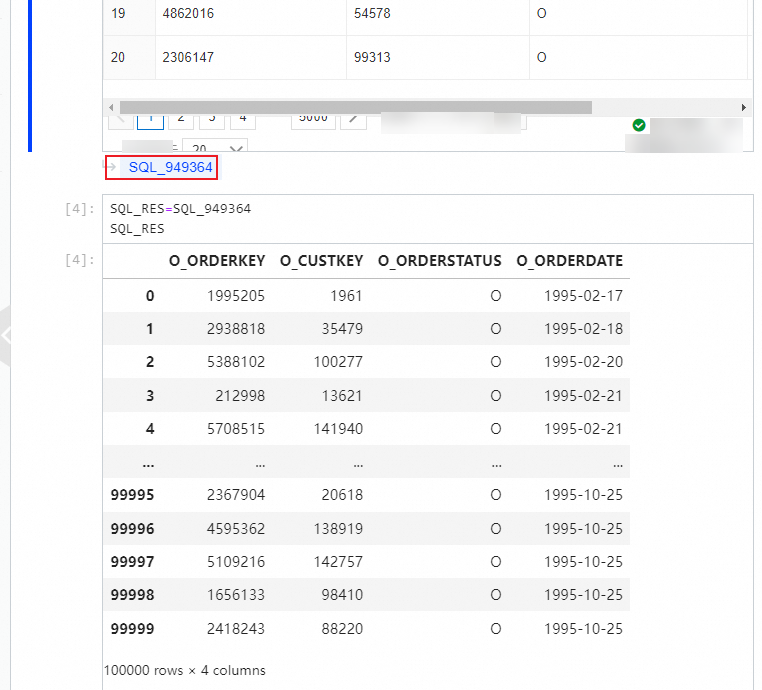
-
Predict the data change trend using Python.
-
In a new Code cell, enter the install command for the machine learning packages and click the Run icon.

-
After the packages are installed, write Python code in another Code cell to run your prediction model and display the trend as a chart.
-
FAQ
Which users can view a notebook's content?
Only members of the same workspace within your tenant can view notebooks. To grant access to a user outside your tenant, add them to the tenant first and then add them as a workspace member.