Data Lake Formation (DLF) provides an alert feature using Cloud Monitor. You can set alert rules for key metrics to monitor the real-time status of lake table optimization. This helps you promptly handle potential risks and ensure stable operations.
Create and manage alert rules
Log on to the Cloud Monitor console.
In the navigation pane on the left, choose .
Click Create Alert Rule and configure the parameters.
Parameter
Description
Product
Data Lake Formation (DLF)
Resource Range
Select Instances. The alert rule applies to a catalog.
Associated Resources
Click Add Instance. In the upper-left corner, select the destination region. Then, select the catalog to monitor and click OK.
Rule Description
Click Add Rule > Simple Metric or Combined Metrics to open the Configure Rule Description panel.
Cloud Monitor metric descriptions
compaction_latency_between_latest_compacted_and_uncompacted_commit
Definition: The time difference between the latest compact commit and the latest non-compact commit.
Semantics: Reflects the time span of unmerged data in the current system.
Scenarios:
Evaluate data catchup progress.
A larger value indicates that the latest compaction task is falling further behind the write progress.
Note: This metric measures how far a compaction task lags behind the latest write progress (the catchup gap). It does not measure the waiting time for a specific piece of data.
compaction_latency_earliest_uncompacted_commit
Definition: The latency calculated from the commit time of the earliest unmerged snapshot and the current system time.
Semantics: Reflects the lag of the compaction task at the scheduling layer. It represents the duration that the oldest batch of committed data has been waiting for compaction.
Scenarios:
Monitor the response speed of the scheduling system.
Troubleshoot insufficient compaction resources.
Note: In high-frequency commit scenarios, the value of this metric may be smaller than expected because it ignores the time taken for the data writing process.
compaction_latency_earliest_uncompacted_file
Definition: The latency calculated from the creation time of the earliest uncompacted data file and the current system time.
Semantics: Reflects the end-to-end timeliness from when data is physically written to when it waits for compaction.
Scenarios:
Scenarios that require strict monitoring of data freshness.
Long-window stream writing or large-batch import scenarios where checkpoint intervals are long.
Note: This metric includes the time taken for "upstream data writing and its checkpoints". Its value is usually greater than the "Earliest Non-compact Commit" latency and more accurately reflects the physical age of the oldest data.
For more information, see GetTableCompactionInfo.
If no pending compaction data exists in the system, the value of all compaction latency metrics is 0.
These metrics apply only to Paimon primary key tables. Storage optimization must be enabled by setting
write-only=true. This option is enabled by default in the DLF fully managed service.
Sample and recommended alert solutions
Scenario | Recommended alert configurations |
Monitoring frequently updated primary key tables | Metric Type: Composite (generates alaerts if one of the conditions is met)
Select Dimension: Table |
Monitoring at the catalog or database level | Metric Type: Simple
Select Dimension: Database or catalog (leave blank) |
Sample alert rule
Parameter | Example |
Alert Rule | Compaction Latency Alert |
Metric Type | Select Combined Metrics. |
Alert Level | Select Warning (Warn). |
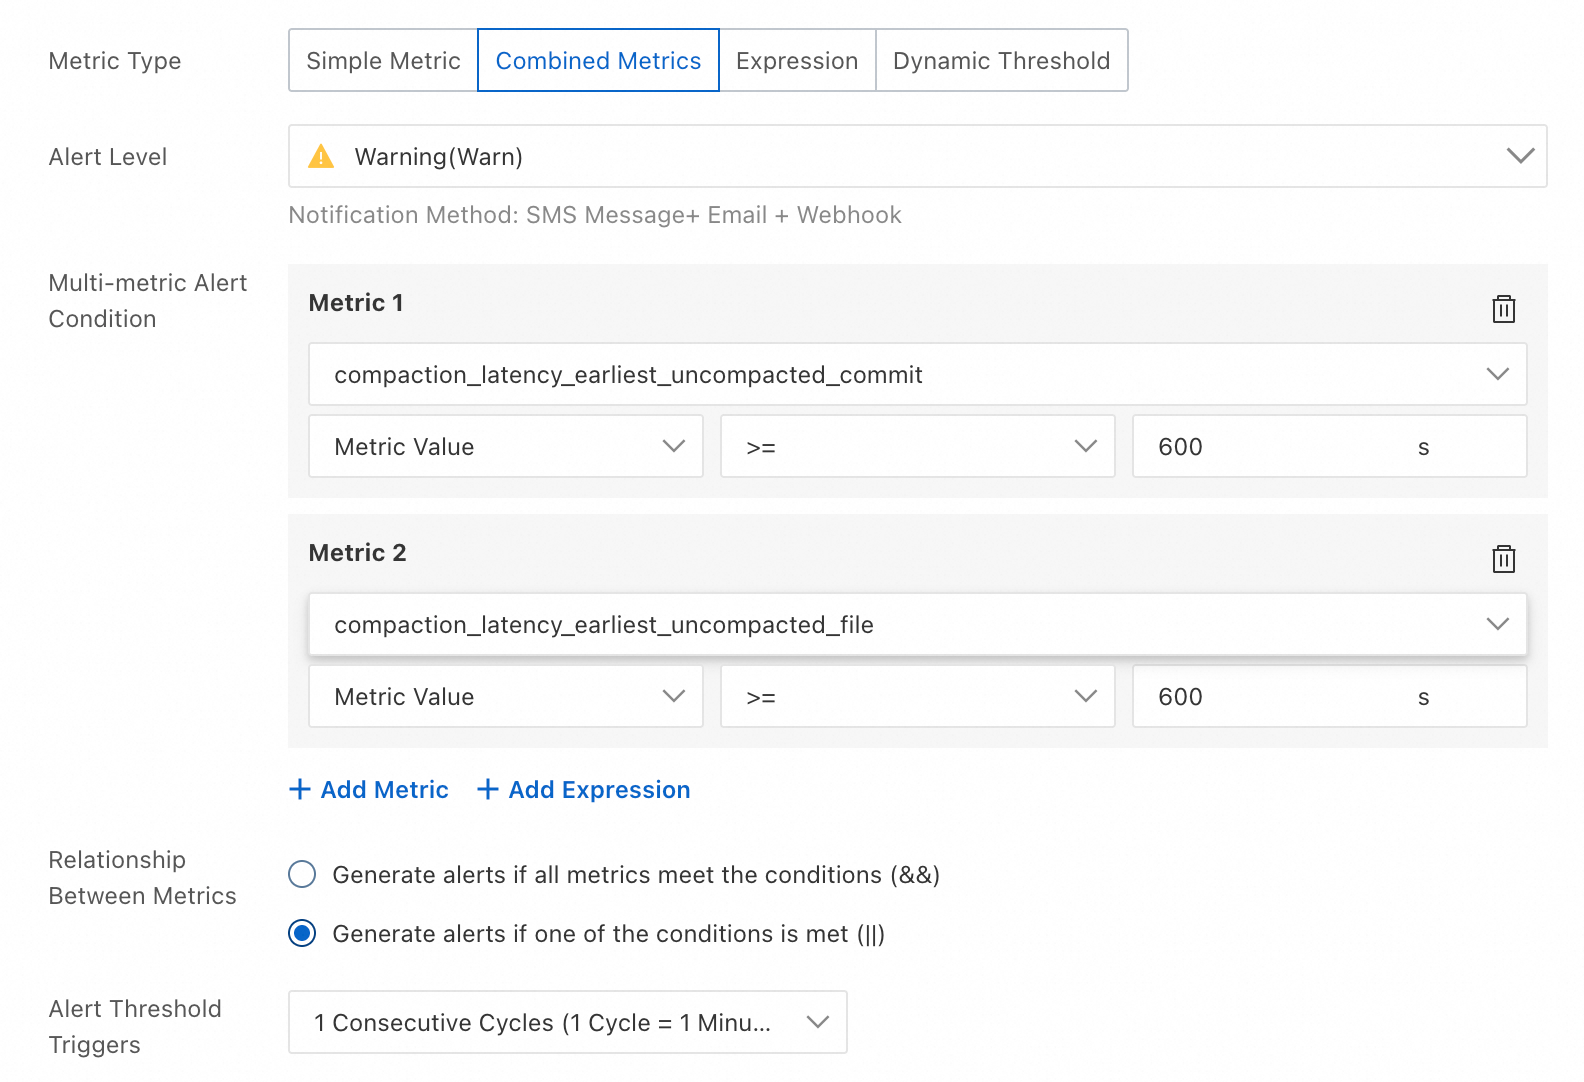
Multi-metric Alert Condition | compaction_latency_earliest_uncompacted_commit: Metric Value >= 600 s compaction_latency_earliest_uncompacted_file: Metric Value >= 600 s |
Select Dimension | Select a table. |
Relationship Between Metrics | Select Generate alerts if one of the conditions is met. |
Alert Threshold Triggers | Select 1 Consecutive Cycles (1 Cycle = 1 Minutes). |
