The Security Overview page in the Anti-DDoS Proxy console provides a centralized dashboard for monitoring DDoS protection status. Use this page to review bandwidth, connections, and request rates, investigate DDoS attack events, and track traffic distribution patterns across your instances and domain names.
Anti-DDoS Proxy retains data for the last 30 days. To learn about traffic-related concepts, click Traffic Relationships and Description in the upper-right corner of the Security Overview page.
Prerequisites
An Anti-DDoS Proxy (Chinese Mainland) or Anti-DDoS Proxy (Outside Chinese Mainland) instance is purchased. For more information, see Purchase an Anti-DDoS Proxy instance.
A website service or non-website service is added to Anti-DDoS Proxy. For more information, see Add websites or Manage forwarding rules.
View instance-level security data
The Instances tab displays service metrics and DDoS attack details for each Anti-DDoS Proxy instance. Use this view to monitor network-layer traffic patterns and investigate attack events.
Log on to the Anti-DDoS Proxy console.
In the top navigation bar, select the region of your instance.
Anti-DDoS Proxy (Chinese Mainland): Select the Chinese Mainland region.
Anti-DDoS Proxy (Outside Chinese Mainland): Select the Outside Chinese Mainland region.
In the navigation pane on the left, click Security Overview. The Instances tab displays the following sections.
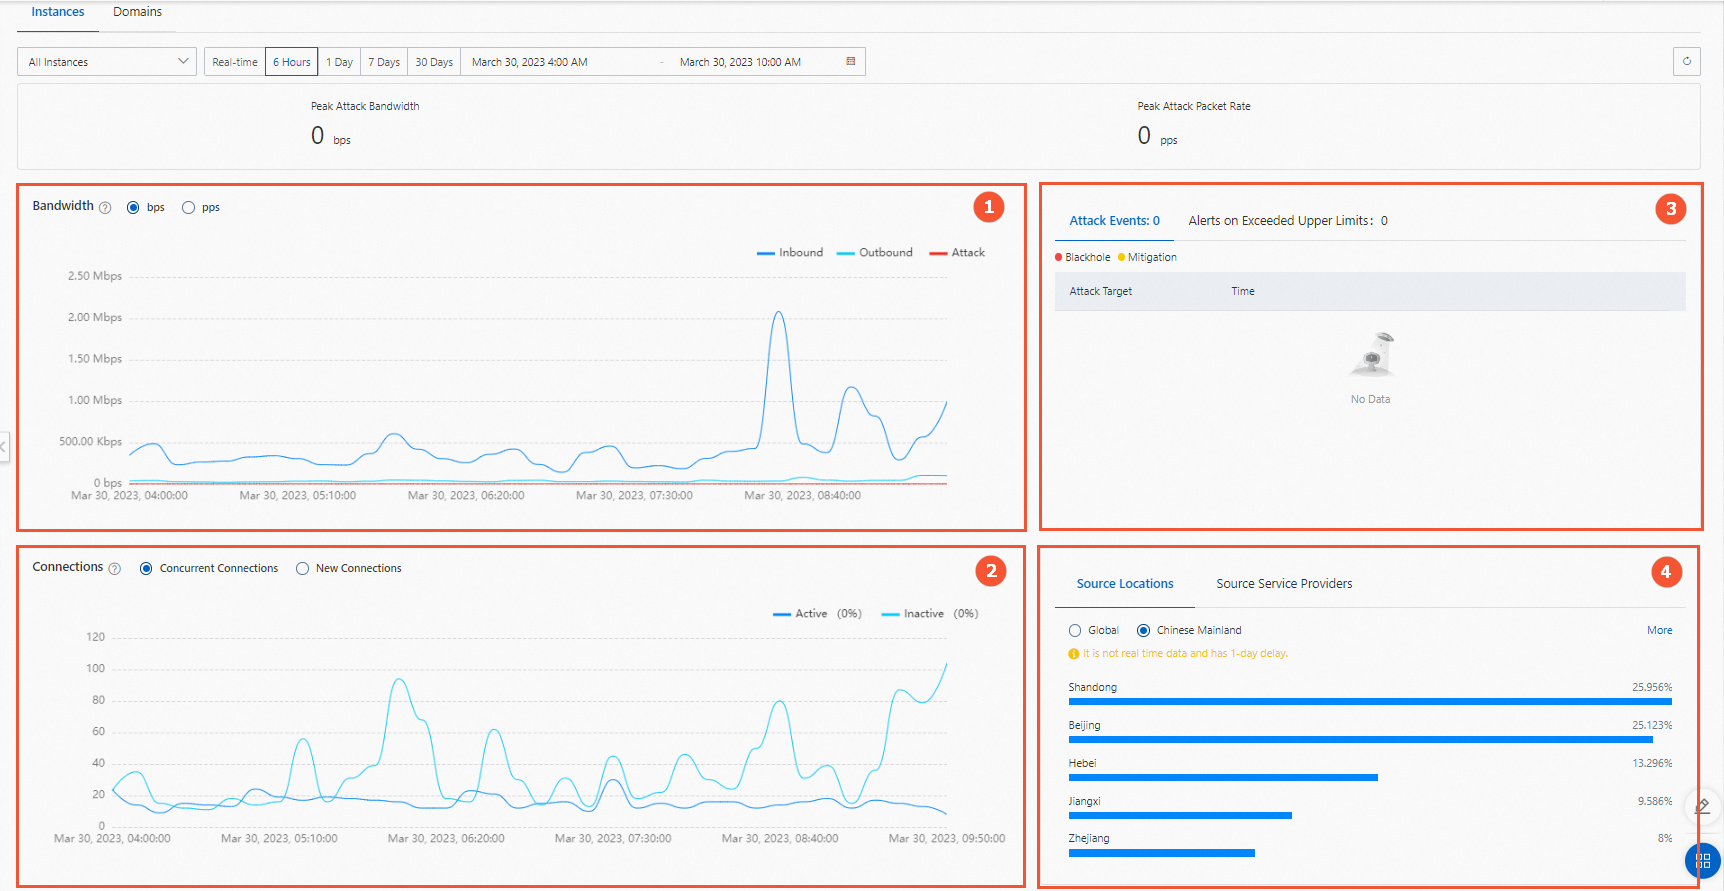
Bandwidth trends
The Bandwidth section (marked 1 in the preceding figure) shows traffic trends for the selected instance over a specified time period.
Anti-DDoS Proxy (Chinese Mainland): The trend chart displays inbound, outbound, attack, and throttling traffic. Traffic is measured in bps or pps.
Anti-DDoS Proxy (Outside Chinese Mainland): Three tabs are available:
Overview: Bandwidth trends.
Inbound Traffic Distribution: Distribution of inbound traffic.
Outbound Traffic Distribution: Distribution of outbound traffic.
Connection metrics
The Connections section (marked 2 in the preceding figure) shows TCP connection metrics between clients and the instance.
Concurrent Connections: The total number of TCP connections established between clients and the instance.
Active connections: TCP connections in the Established state.
Inactive connections: TCP connections in any state other than Established.
New Connections: The number of new TCP connections between clients and the instance per second.
Security event panels
Three event panels (marked 3 in the preceding figure) track different categories of security events:
Network Layer Attack Events
Lists DDoS attacks detected at the network layer. Hover over an attacked IP address or port to view the attacked IP address and port, attack type, attack peak, and protection result.
Alerts on Exceeded Upper Limits
Tracks capacity-related alerts for clean bandwidth, new connections, and concurrent connections. When traffic or connection counts exceed the purchased specification, an alert is generated. Your services are not affected in this scenario, but upgrading your instance specifications is recommended. For more information, see Upgrade an instance.
Click Details in the Status column to go to the System Logs page and view the details.
Alert data for exceeded upper limits is updated at 10:00 (UTC+8) every Monday with data from the previous day. If you have configured notifications by using internal messages, text messages, or email, you also receive a notification at 10:00 (UTC+8) every Monday that contains data from the previous day.
Destination Rate Limit Events
Tracks throttling events that affect your services. If metrics such as new connections, concurrent connections, or service bandwidth significantly exceed the instance specifications, the corresponding throttling policy is triggered. Unlike exceeded-upper-limit alerts, destination rate limit events indicate that your services are affected.
If rate limiting is triggered by service traffic, upgrade the specifications of your instance as soon as possible. For more information, see Upgrade an instance.
If rate limiting is triggered by DDoS attacks, adjust your mitigation policies as soon as possible. For more information, see Configure blacklists and whitelists for IP addresses.
Click Details in the Status column to go to the System Logs page and view detailed information.
Traffic distribution
The traffic distribution section (marked 4 in the preceding figure) shows the geographic and network origin of your service traffic.
Service Distribution by Location: The distribution of source locations from which service traffic originates.
Service Distribution by ISP: The distribution of Internet service providers (ISPs) from which service traffic originates.
View domain-level security data
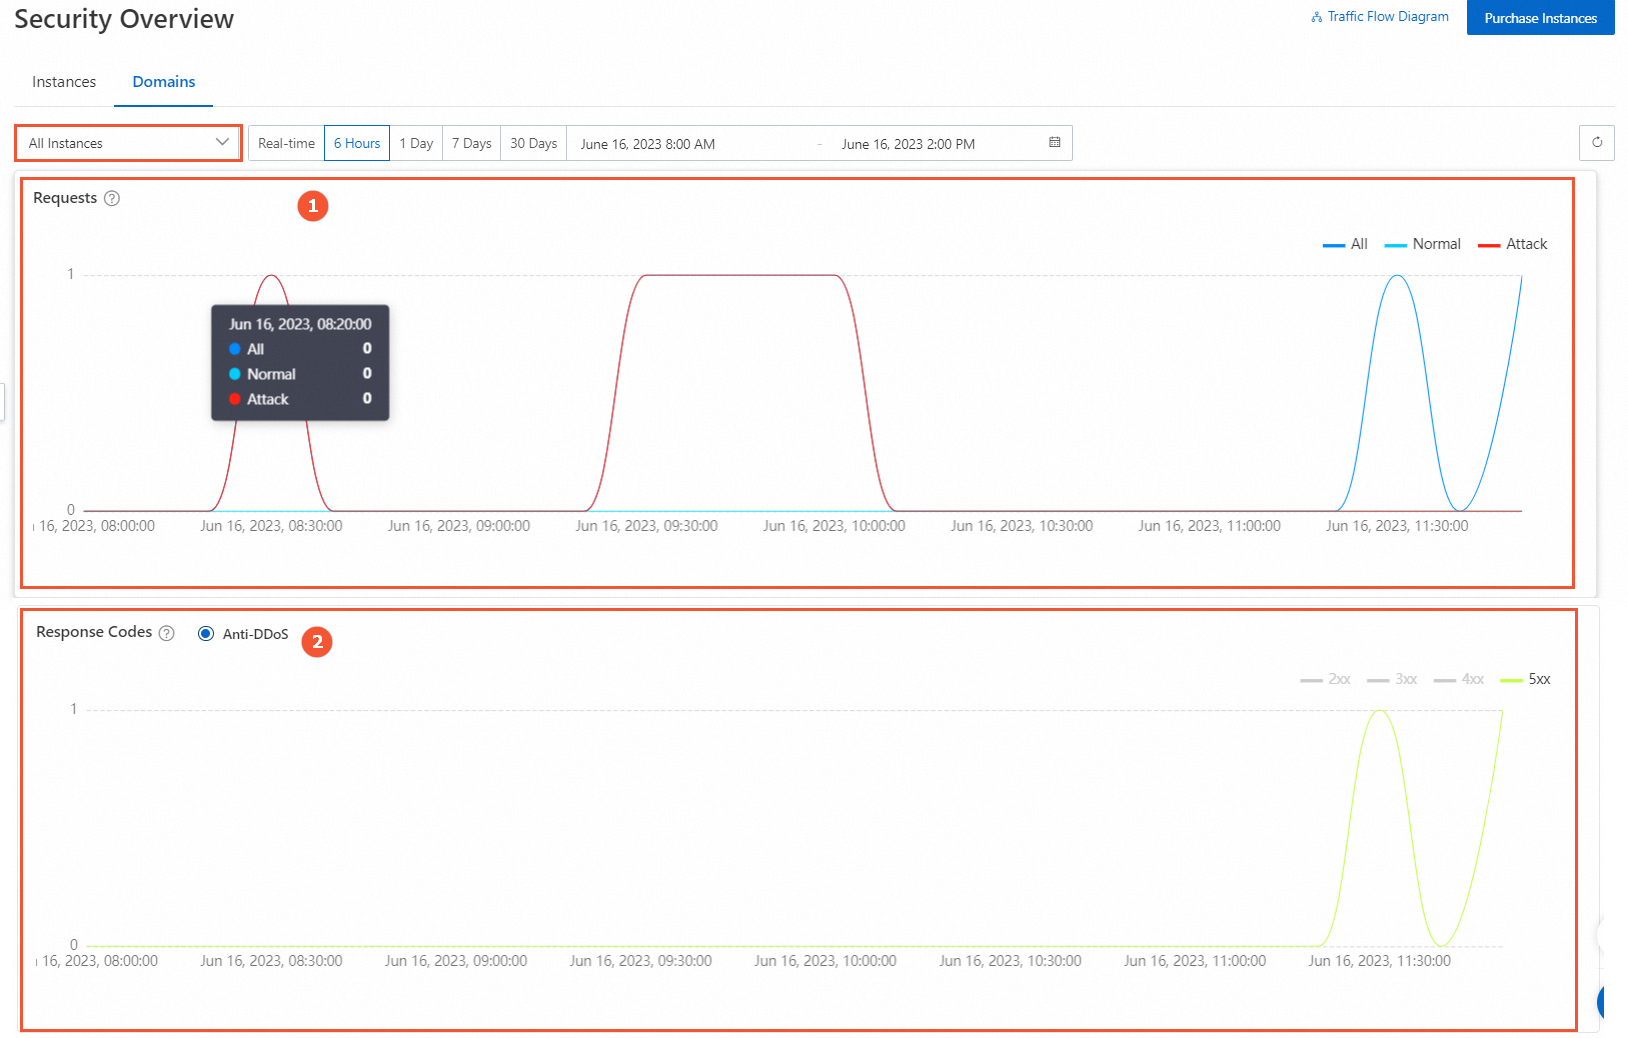
The Domain Name tab displays service metrics and DDoS attack event details for each domain name. This view provides application-layer visibility, including QPS trends, HTTP status codes, and URI-level analytics.
Log on to the Anti-DDoS Proxy console.
In the top navigation bar, select the region of your instance.
Anti-DDoS Proxy (Chinese Mainland): Select the Chinese Mainland region.
Anti-DDoS Proxy (Outside Chinese Mainland): Select the Outside Chinese Mainland region.
In the navigation pane on the left, click Security Overview, and then click the Domain Name tab. Two viewing modes are available: Total QPS by Instance and QPS by Domain.
View total QPS by instance
From the Select Domain Name drop-down list, click the Total QPS by Instance tab, select the exclusive IP addresses, and then click OK.
| Section | Description |
|---|---|
| Request Rate (QPS) (marked 1) | Displays the request rate trend for each Anti-DDoS Proxy instance. Time granularity varies based on the specified time range. |
| Status Codes and Requests (marked 2) | Displays the response codes returned by Anti-DDoS Proxy for each instance. The number of recorded response codes is the cumulative value within the time granularity. The following list describes the response codes: 2XX: The request was successfully received, understood, and accepted by the server. Statistics for 2XX response codes include statistics for the 200 response code. 3XX: The client must perform further operations to complete the request. These status codes are usually used for redirection. 4XX: An error may have occurred on the client, which prevents the server from processing the request. 5XX: An error or exception occurred while the server was processing the request. |
View QPS by domain name
From the Select Domain Name drop-down list, click the QPS by Domain tab, select the domain names, and then click OK.
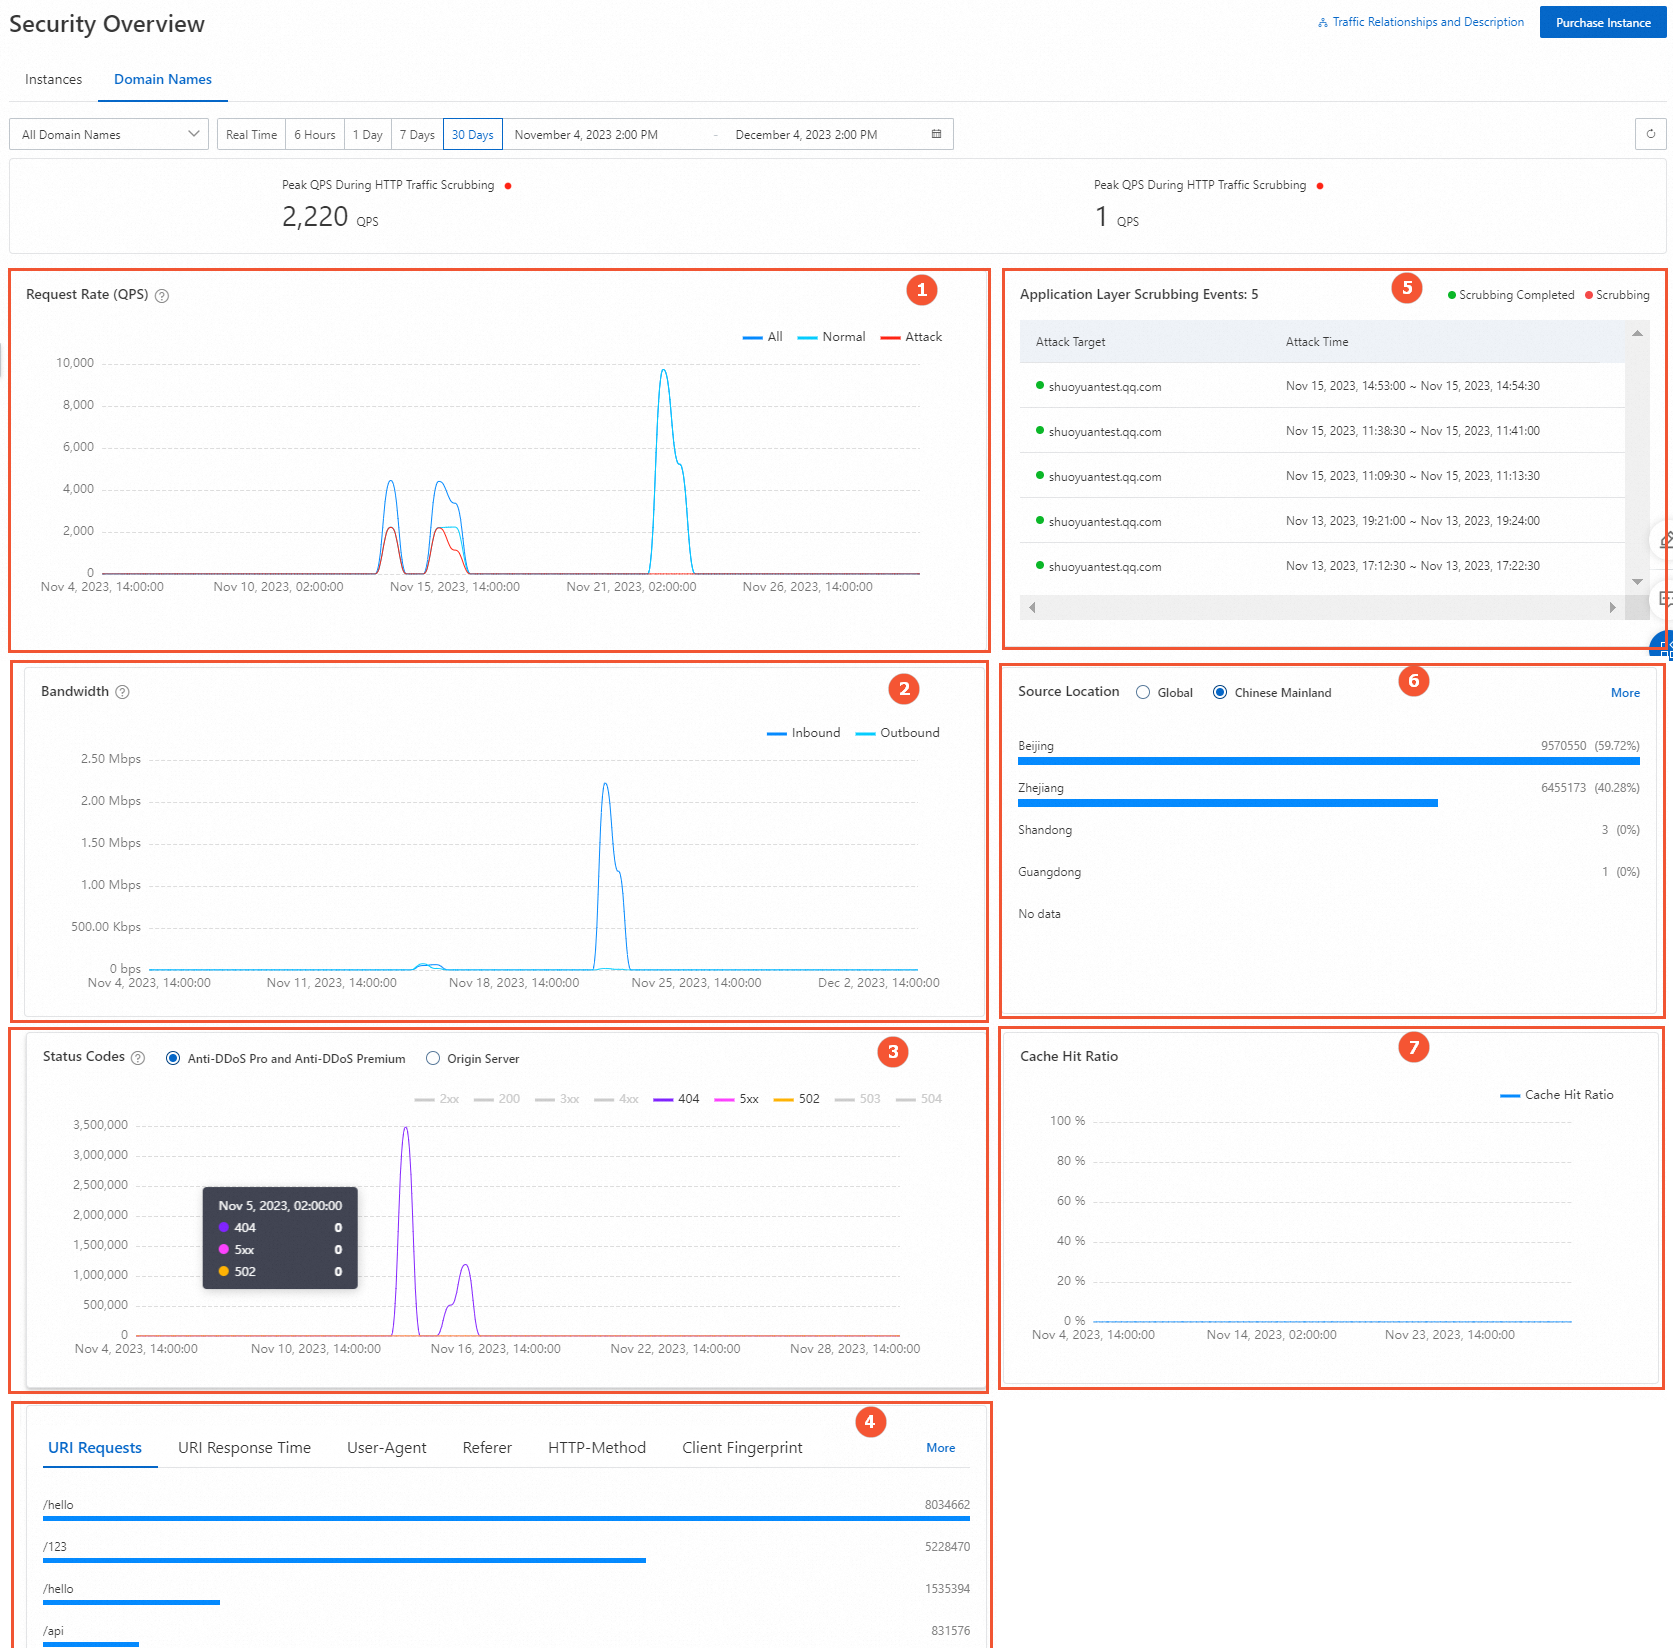
The following table describes the sections available in this view.
| Section | Description |
|---|---|
| Request Rate (QPS) (marked 1) | Displays the request rate trend for each domain name. Time granularity varies based on the specified time range. |
| Bandwidth (marked 2) | Displays peak outbound and inbound bandwidth trends for the domain name. Only the payload field is counted. This may cause a drift from the instance-level bps trend graph. |
| Status Codes and Requests (marked 3) | Includes response codes from both Anti-DDoS Proxy and the origin server. The number of recorded response codes is the cumulative value within the time granularity. The following list describes the response codes: 2XX: The request was successfully received, understood, and accepted by the server. 2XX includes all status codes from 200 to 299. 200: The request succeeded. 3XX: The client must perform further operations to complete the request. These status codes are usually used for redirection. 4XX: An error may have occurred on the client, which prevents the server from processing the request. 4XX includes all status codes from 400 to 499. 403: The server understood the client's request but refused to fulfill it. 404: The server could not find the resource requested by the client. 405: The server understood the resource path of the client's request, but the HTTP method used in the request, such as GET, POST, PUT, or DELETE, is not allowed for that resource. 410: The resource has been deleted from the server. 499: The client canceled the request before the server finished processing it. 5XX: An error or exception occurred while the server was processing the request. 5XX includes all status codes from 500 to 599. 502: Anti-DDoS Proxy, acting as a proxy server, received an invalid response from the upstream server when attempting to fulfill the request. 503: The server is currently unable to handle the request, possibly due to temporary server maintenance or overload. 504: Anti-DDoS Proxy, acting as a proxy server, did not receive a timely response from the upstream server when attempting to fulfill the request. |
| URI Requests and URI Response Time (marked 4) | Displays Top 5 data for: URI Requests, URI Response Time, User-Agent, Referer, HTTP-Method, Client TLS Fingerprint, HTTP/2 Fingerprint, JA3 Fingerprint, and JA4 Fingerprint. Click More to view additional data. For more information, see Appendix 1: Supported HTTP request fields. The URI response time is measured from when Anti-DDoS Proxy receives a client request until it returns a response, in milliseconds. If a URI has multiple response times, the maximum value is used. |
| Application Layer Scrubbing Events (marked 5) | Displays scrubbing events at the application layer. Hover over a domain name to view the attacked domain name, attack peak, and attack type. |
| Source Location (marked 6) | The distribution of access source locations. |
| Cache Hit Ratio (marked 7) | Applies to scenarios with the static page cache feature enabled. For more information, see Anti-DDoS Lab. |
Configure a custom alert threshold
By default, Anti-DDoS Proxy generates a flood attack alert event only when inbound traffic is 500 Mbps or higher and the scrubbing traffic is greater than 100 Mbps. If your normal service traffic is low, smaller attacks may not trigger alerts. Configure a custom alert threshold to detect lower-volume attacks that still produce visible scrubbing traffic in the console.
Log on to the Anti-DDoS Proxy console.
In the top navigation bar, select the region of your instance.
Anti-DDoS Proxy (Chinese Mainland): Select the Chinese Mainland region.
Anti-DDoS Proxy (Outside Chinese Mainland): Select the Outside Chinese Mainland region.
In the navigation pane on the left, click Security Overview. On the Security Overview page, locate the Set Alert Threshold area and configure a custom inbound bandwidth threshold.

Keep the following points in mind when configuring the threshold:
The threshold applies to the total inbound bandwidth received by a single IP address of the Anti-DDoS instance.
Inbound traffic includes attack traffic and service traffic.
An alert event is generated when the inbound traffic is greater than or equal to the custom threshold and the scrubbing traffic is greater than 100 Mbps.
This setting applies to all IPv4 addresses of the Anti-DDoS instance. Custom adjustments for IPv6 addresses are not supported.