View statistics details
The Statistics Details page provides monitoring charts to analyze the performance of individual APIs. You can track key metrics such as HTTPS Status Codes, DataService Studio Error Codes, Number of Application Requests, Traffic Bandwidth, and Response Time.
Go to the statistics details page
-
Log on to the DataWorks console. In the target region, click in the left-side navigation pane. Select a workspace from the drop-down list and click Go to DataService Studio.
-
In the top navigation bar, click the Service Management tab. The Manage APIs page appears by default.
-
In the left-side navigation pane, click .
-
Find the target API and click Monitoring Chart in the Operation column.
Monitoring charts
-
HTTPS Status Codes
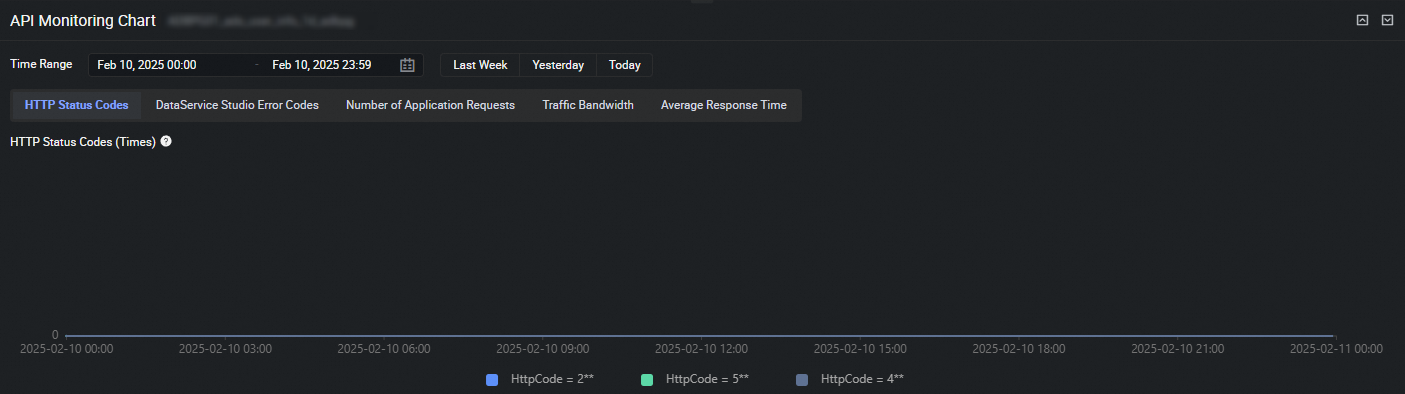 The HTTPS Status Codes chart shows the trend in the number of various HTTPS status codes returned by API calls over a specified period.
 -
DataService Studio Error Codes
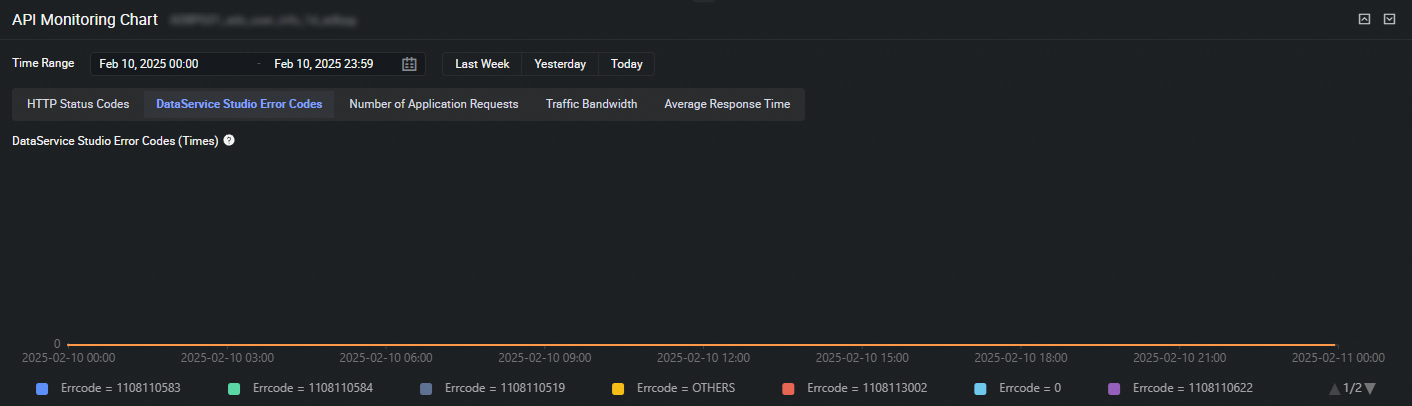 The DataService Studio Error Codes chart shows the trend in the number of various DataService Studio error codes returned by API calls over a specified period. Use this chart to quickly identify and troubleshoot problems. For details about the error codes, see Appendix: DataService Studio error codes.
 -
The Number of Application Requests chart shows the trend of API calls made by each application over a specified period.
-
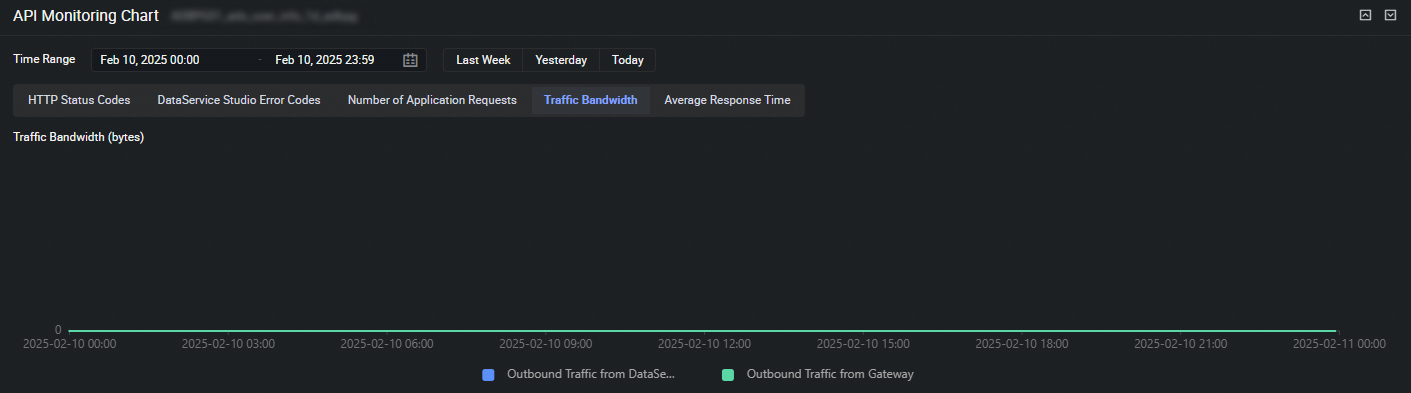 The Traffic Bandwidth chart shows the trend in outbound traffic from DataService Studio and API Gateway for API calls over a specified period.
 -
Response Time
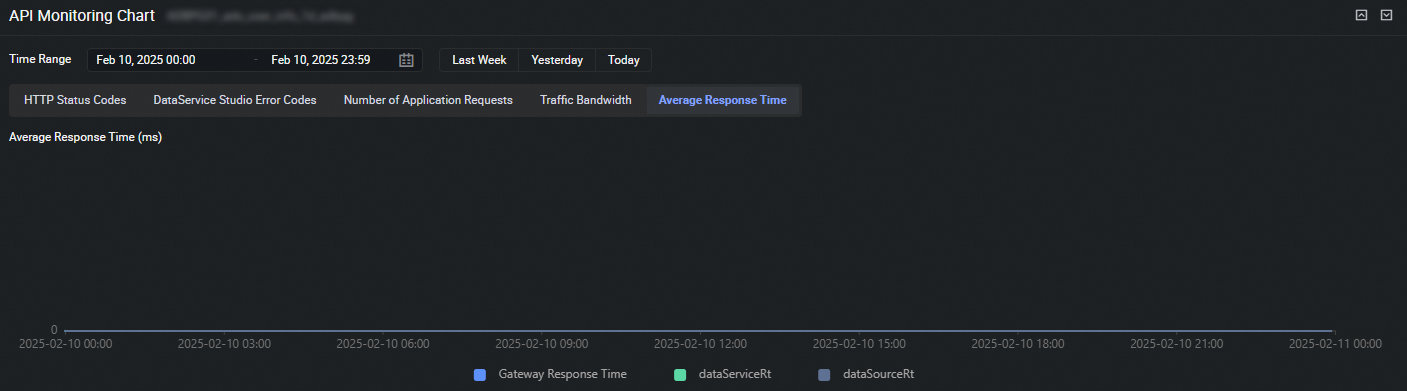 The Response Time chart shows the trend in response times for API requests across API Gateway, DataService Studio, and the data source over a specified period.
The API Gateway response time determines the overall response time for a DataService Studio API. This time includes the response time from DataService Studio, which in turn includes the response time from the data source.