The code structure feature in DataWorks parses a node's SQL code and generates a visual execution flow. This graph helps you quickly locate, view, and modify the code.
View the code structure
-
Go to DataStudio.
Log on to the DataWorks console. In the target region, click in the left-side navigation pane. Select a workspace from the drop-down list and click Go to Data Development.
-
Go to the editor page of the target node.
In the directory tree of DataStudio or Manually Triggered Workflows, find the target node and double-click it to open its editor page. The code editor on the right displays the node's SQL code structure. This includes the INSERT OVERWRITE TABLE statement and its referenced upstream tables and transformation logic, such as COALESCE and LEFT OUTER JOIN.
-
View the code structure.
In the right-side navigation pane of the node editor page, click Code Structure to view the SQL code in Code Structure and Code Structure.
-
Classic mode: An SQL script is executed as a sequence of SQL operators to produce the final result. Use classic mode to view the SQL operators in the code and their relationships.
Hover over the icon of an SQL operator to view its description. Common SQL operators include the following:
-
Source Table: The table to be queried. This operator is identified by a green S icon and represents a source table in the code, such as
xc_ods_log_info_d. This indicates an upstream dependency in the data lineage. -
Filter: Filters specific partitions in the source table. The filter condition for the source table is
WHERE dt = '${bdp.system.bizdate}'. The system automatically replaces the system parameter${bdp.system.bizdate}with the business date to filter data by partition. -
Intermediate table (query view): A temporary table that stores query results.
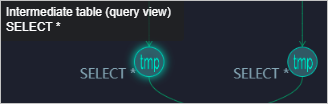
The example figure shows two uses of intermediate tables. The first type stores the result of a query in a temporary table. The second type stores the aggregated result of a JOIN operation in a temporary table that the system retains for three days and then automatically deletes.
-
Join: Combines multiple query results.

-
-
Outline mode: Displays the hierarchical structure of the main statements in your SQL code.
Click an SQL operator in classic mode or a core statement in outline mode to jump to its corresponding location in the code. You can then edit the code as needed.
-