The Data Risk page provides a multi-dimensional view of risks identified by your configured rules. You can analyze risk distribution, track trends, and rank workspaces by risk count. This allows you to drill down into the details of each risk—such as the associated user, time, and operation—to quickly locate and handle threats.
Prerequisites
The Fraud Detection Management feature is enabled. You must use Fraud Detection Management to configure the relevant fraud detection rules. Only the risk data that matches these rules is displayed on the data risk page. To configure Fraud Detection Management, see Fraud Detection Management.
Access the data risk page
Go to Data Security Guard.
Log on to the DataWorks console. In the target region, click in the left-side navigation pane. On the page that appears, click Go to Security Center.
In the left-side navigation pane, click and then click Try Now to access Data Security Guard.
NoteIf your Alibaba Cloud account is already authorized, you are directed to the Data Security Guard homepage.
If your Alibaba Cloud account is not authorized, you are redirected to the Data Security Guard authorization page. To use Data Security Guard features for the first time, go to , select Data Security Guard in the pop-up dialog, and then complete the authorization.
In the left-side navigation pane of the Data Security Guard page, click Data Risk to go to the Data Risk page.
This page allows you to view the risk overview and risk details for the current tenant. For more information, see Risk Overview and Risk Details.
Risk overview
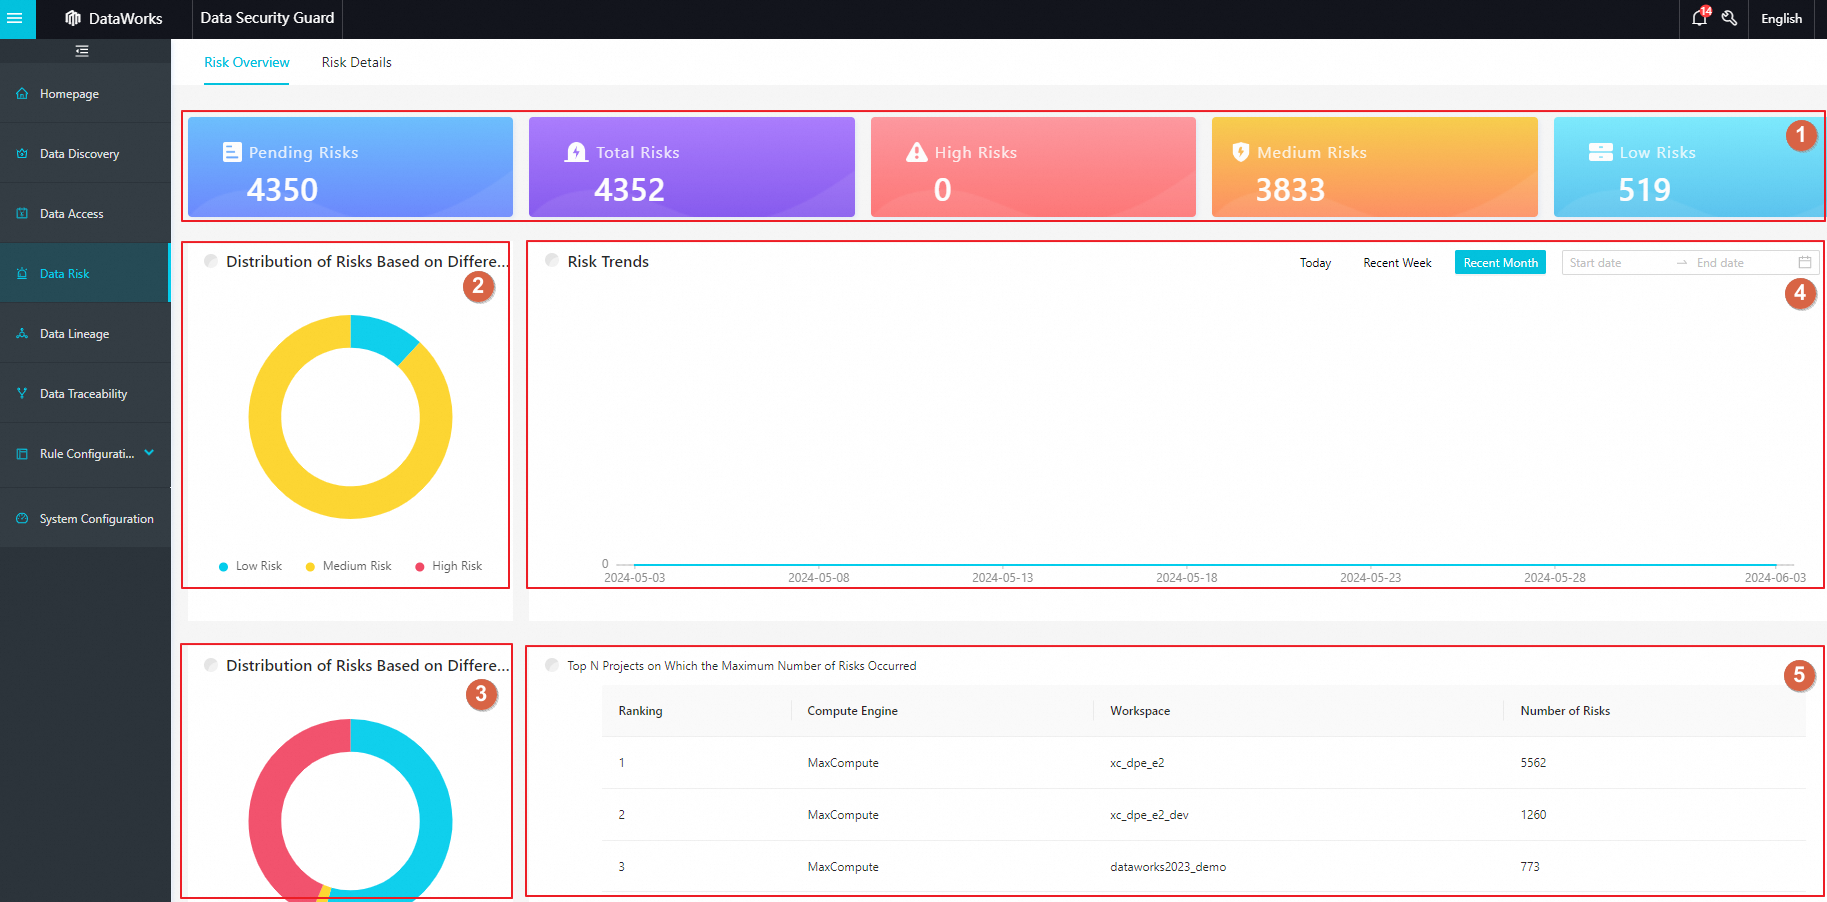
The Risk Overview page provides a multi-dimensional view of risk data for the current tenant, such as by operation type, risk level, and risk trend. This helps you understand your overall risk posture.
Area | Description |
1 | This area displays the total counts for different risk categories in the current tenant: Pending Risks, Total Risks, high risk, medium risk, and low risk. |
2 | This area provides a pie chart that visualizes the distribution of risks in the current tenant by level: High, Medium, and Low. Click a colored section of the chart to view the number of risks for that level. |
3 | This area provides a pie chart that visualizes the distribution of risks in the current tenant by operation type, such as data access, Data manipulation, and Export Data. Click a colored section to view the number of risks for that operation type. |
4 | In this area, you can select a time range to view the risk trend. Hover over a data point on the line chart to see the number of risks generated on that specific day. |
5 | Use this list to quickly identify high-risk workspaces and prioritize remediation efforts. |
Risk details
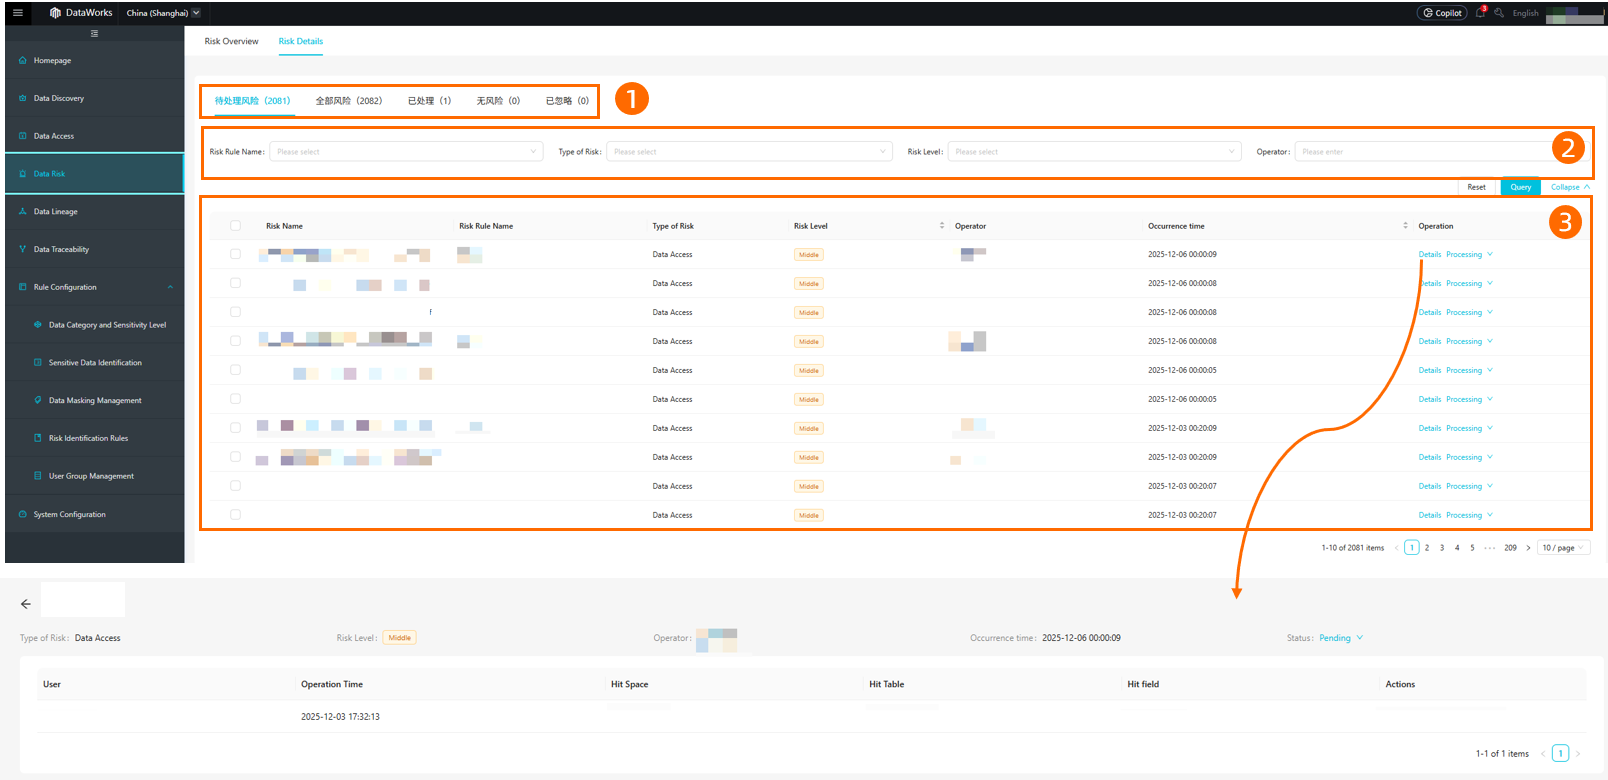
The Risk Details page displays detailed information about each risk, including its name, type, operator, occurrence time, and status. You can use this information to trace the cause of a risk and handle it promptly. This topic uses the All risks tab as an example. You can use the filter bar to search by risk name, risk type, risk level, and operator. The details page for a risk contains a hit information table that shows details such as the user, operation time, hit space, hit table, and hit field.
Area | Description |
1 | This area shows the number of risks in the current tenant by status: Pending Risks, All risks, Handled Risks, and No Risk. |
2 | In this area, you can filter the list by risk type to view the count for a specific type. By default, risks of all types are displayed. |
3 | This area displays the list of risks that match the selected criteria. The list includes columns such as risk name, Type of Risk, Risk Level, operator, Occurred At, and risk status. You can perform the following operations in this area:
|
 icon next to Risk Level or Occurred At to sort the list in ascending or descending order.