The Data Risks page shows risks flagged by your fraud detection rules, organized across multiple dimensions—risk distribution by operation type and severity, trends over time, and a ranking of projects by risk count. Use it to spot high-risk periods and projects, then trace each risk back to the user, time, and operation that triggered it.
Prerequisites
Before you begin, ensure that you have:
Enabled the Fraud Detection Management feature
Configured at least one fraud detection rule
Only risk data matched by configured rules appears on the Data Risks page. For setup instructions, see Fraud Detection Management.
Open the Data Risks page
Log on to the DataWorks console. In the top navigation bar, select a region. In the left-side navigation pane, choose Data Development and O\&M > Data Development.
Select a workspace from the drop-down list and click Go to Data Development.
Click the
 icon in the upper-left corner, then choose All Products > Data Governance > Data Security Guard.
Click Try Now to go to the Data Security Guard page.
If your Alibaba Cloud account already has the required permissions, you are taken directly to the Data Security Guard homepage. If not, you are redirected to the authorization page—request the required permissions before proceeding.
In the left-side navigation pane of the Data Security Guard page, click Data Risk.
View the risk overview
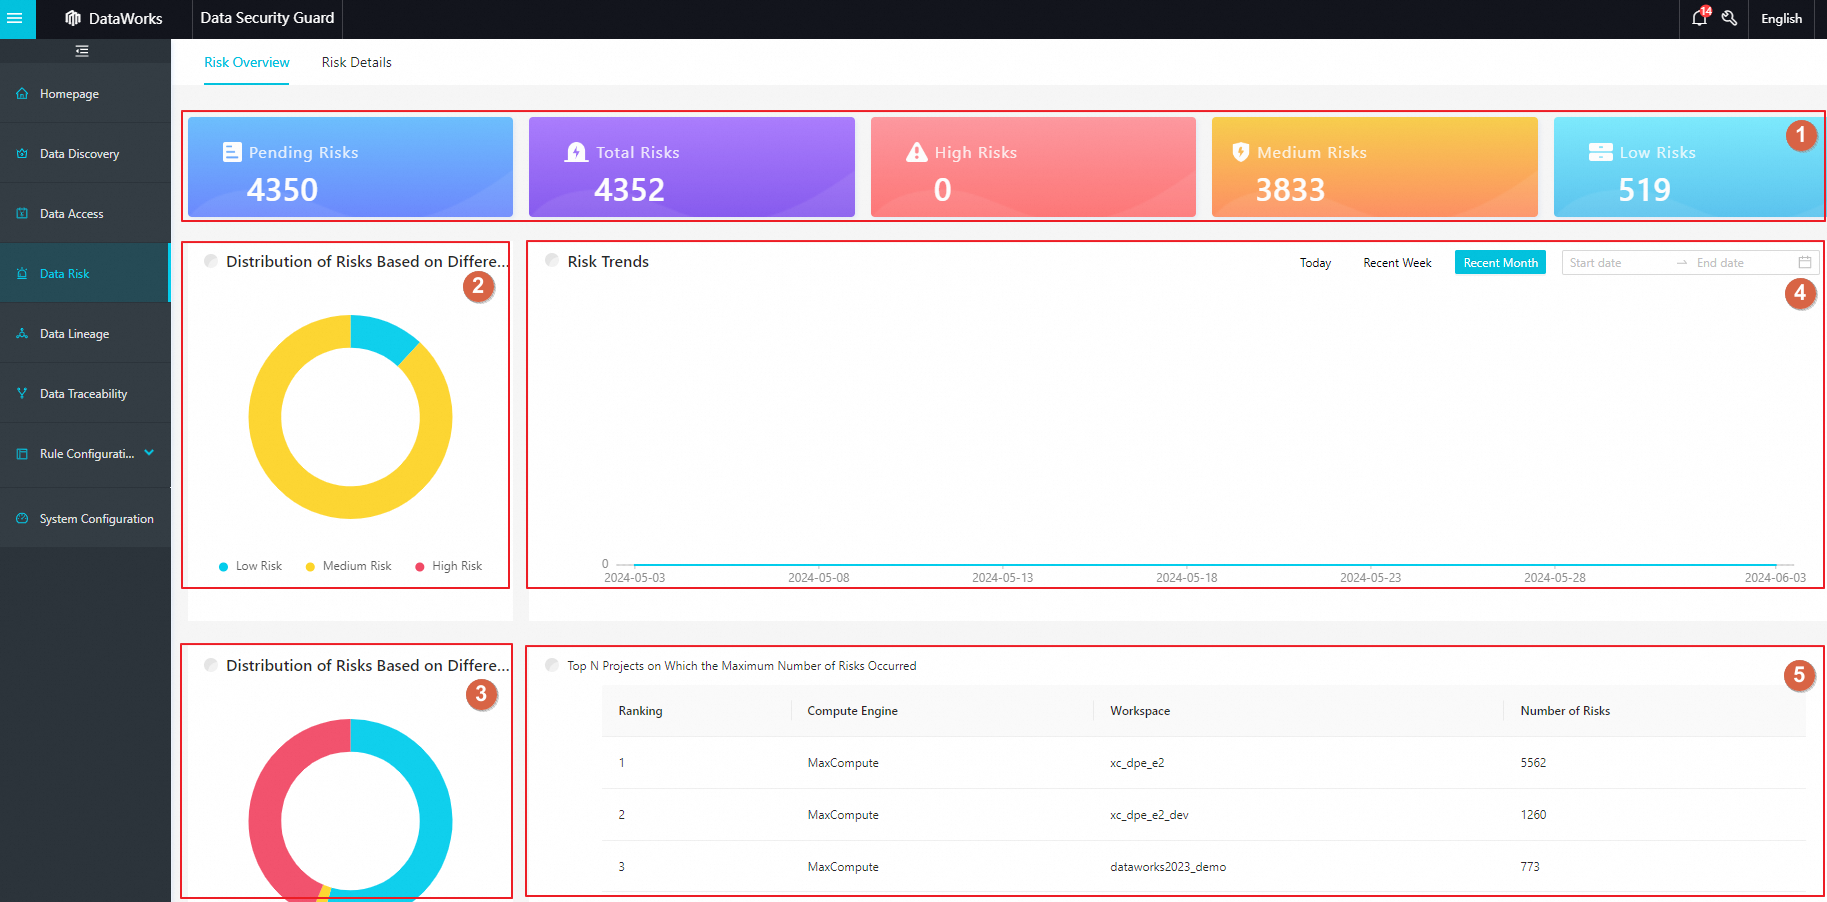
The Risk Overview page gives a tenant-wide picture of your risk landscape. Use it to quickly assess overall exposure and identify which risks to address first.
| Area | What it shows | What you can do |
|---|---|---|
| 1 | Risk counts by category: Pending Risks, Total Risks, High Risks, Medium Risks, and Low Risks | Review the summary to understand overall exposure |
| 2 | Pie chart showing the distribution of High, Medium, and Low risk levels | Click a section to filter by that risk level |
| 3 | Pie chart showing risks by operation type: Data Access, Data Operation, and Data Exporting | Click a section to filter by that operation type |
| 4 | Line chart showing the risk count trend over a selected time range | Select a time range to change the view; hover over a data point to see the risk count for that day |
| 5 | Top projects ranked by risk count for the current tenant | Identify your highest-risk projects to prioritize centralized remediation |
View risk details
The Risk Details page lists every individual risk event with the information you need to trace its cause and take action. The following description uses the All Risks tab.
| Area | What it shows | What you can do |
|---|---|---|
| 1 | Risk counts by status: Pending Risks, All Risks, Handled Risks, and No Risk | Review the breakdown to understand current handling progress |
| 2 | Risk count filtered by risk type | Select a type to narrow the list; all types are shown by default |
| 3 | Risk list with columns: Risk Name, Risk Type, Risk Level, Operator, Occurrence Time, and Risk Status | Sort the list, view risk details, or update risk status (see below) |
In area 3, you can take the following actions on each risk:
Sort the list
Click the sort icon next to Risk Level or Occurrence Time to sort the list in ascending or descending order.
Trace a risk
In the Operation column, click Details to open the risk details page. Use the information there to identify the root cause, then locate and resolve the issue.
Update risk status
In the Operation column, click Processing to change the risk status to Processed, Without risk, or Ignored as needed.