DataWorks allows you to configure an alert rule for separate real-time synchronization nodes in Data Integration and real-time synchronization nodes generated by full and incremental data synchronization solutions. The alert rule helps you monitor the status of the nodes. This topic describes the metrics that you can specify in an alert rule for real-time synchronization nodes and provides a best practice for configuring an alert rule for real-time synchronization nodes.
Metrics that you can specify in an alert rule
You can configure an alert rule for real-time synchronization nodes in Operation Center. The metrics for alerting include Status, Business delay, Failover, Not Supported by DDL Statements, DDL Notification, and Dirty Data. 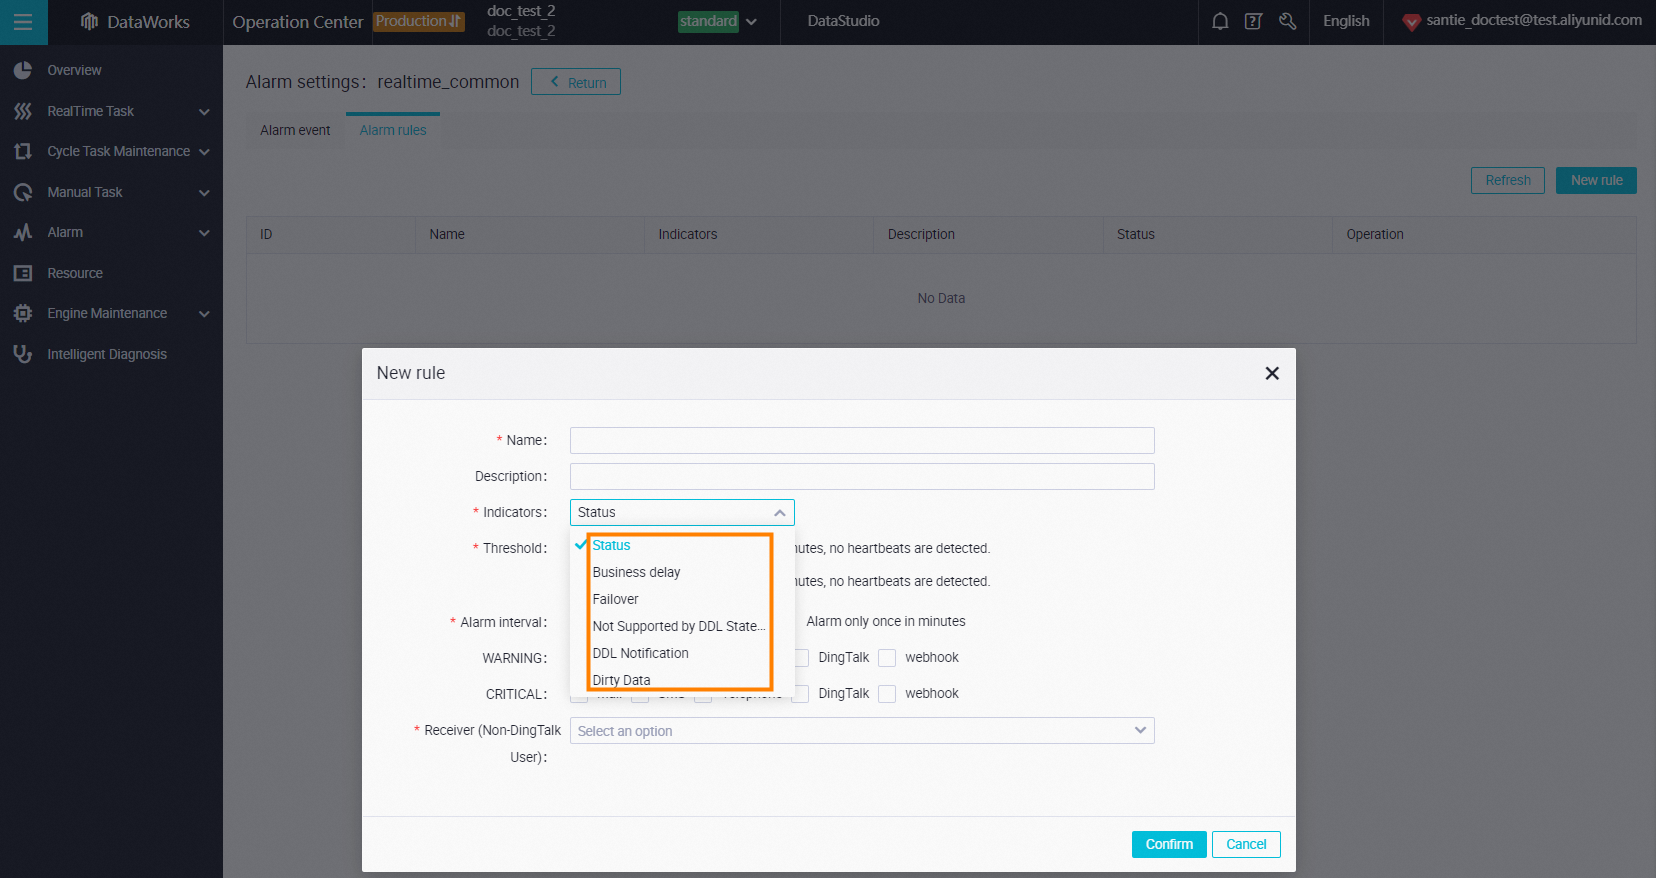
Metric 1: Status
Alerting scenario | Configuration recommendation |
The metric uses the heartbeat status of a real-time synchronization node to determine whether the node is normal. |
|
Metric 2: Business delay
Alerting principle and use scenario | Configuration recommendation |
The metric checks whether the normal data transmission rate of a real-time synchronization node can keep up with the data production rate of the source. The metric measures the time difference between the data processing rate of a real-time synchronization node and the data production rate of the source. |
|
Metric 3: Accumulated Messages (only for a Kafka data source)
Alerting principle and use scenario | Configuration recommendation |
This metric is available only for real-time synchronization nodes that are used to synchronize data from Kafka data sources. This metric measures the number of accumulated messages for a running real-time synchronization node based on the offset difference between the Kafka data source and a consumer. | We recommend that you specify this metric for all important real-time synchronization nodes used to synchronize data from Kafka data sources. |
Metric 4: Failover
Alerting principle and use scenario | Configuration recommendation |
The metric monitors the restart performance of a real-time synchronization process. The restart is performed by the Data Integration control service when the real-time synchronization process exits due to exceptions. This improves the reliability of the synchronization process. | You can specify this metric for real-time synchronization nodes based on your business requirements. The metric allows you to check whether a failover frequently occurs on a synchronization process. |
Metric 5: Not Supported by DDL Statements (To be removed soon)
Alerting principle and use scenario | Configuration recommendation |
Some types of DDL events in data sources that are used as the source are not supported by real-time synchronization nodes in Data Integration. You can configure policies for processing the unsupported DDL events, such as ignoring the DDL events, labeling the DDL events as warning-level events, or labeling the DDL events as critical-level events when you configure the alert rule. This metric triggers an alert for real-time synchronization nodes if DDL events at the warning or critical level occur. | The metric is in the to-be-removed state. You can use the DDL Notification metric instead to meet the same alerting requirements. Alerting based on the DDL Notification metric can meet your requirements for monitoring DDL events at the warning or critical level. |
Metric 6: DDL Notification
Alerting principle and use scenario | Configuration recommendation |
The metric checks whether a specified type of DDL event occurs. If the specified type of DDL event occurs, the system sends an alert notification. The metric is decoupled from the policies that are configured for processing the DDL events. | Alerting based on the DDL Notification metric can meet your requirements for monitoring DDL events at the warning or critical level. We recommend that you use this metric in the alerting scenarios where you want to monitor DDL events. |
Metric 7: Dirty Data
Alerting principle and use scenario | Configuration recommendation |
The metric is used to identify dirty data. If a data record fails to be written to a destination during real-time synchronization, the data record is considered as dirty data. If you want to monitor whether dirty data is generated, you can specify this metric in alert rules. |
|
Alert notification methods
The following alert notification methods are supported for alert rules that you configure for real-time synchronization nodes: email, text message, DingTalk, and webhook URL.
The system sends an alert notification to the email address of an alert recipient by email. The email address of an alert recipient can be specified on the Alert Contacts page in the DataWorks console. If no email address is specified for an alert recipient, the system sends the alert notification to the email address of the related Alibaba Cloud account.
When you view the email for the alert notification, you need to check whether the email is categorized as a spam email.
Text message
The system sends an alert notification to the phone number of an alert recipient by text message. The phone number of an alert recipient can be specified on the Alert Contacts page in the DataWorks console. If no phone number is specified for an alert recipient, the system sends the alert notification to the phone number of the related Alibaba Cloud account.
DingTalk
The system sends an alert notification to a specified DingTalk group in the text format by using a custom chatbot. Enter a token for a custom chatbot in the DingTalk Robot Token field. If multiple tokens are specified, separate them with commas (,). You can also select the Enable check box for DingTalk Group Notification to prevent alert notifications from being missed due to an excessively large number of DingTalk group messages.
You must specify custom keywords after you add a custom chatbot for a DingTalk group. The keywords are the only condition for filtering messages. The keywords must contain DataWorks. The keywords are case-sensitive. If the case sensitivity is not right, the alert notifications fail to be sent. For information about the practice of sending alert notifications by using a DingTalk chatbot, see the Practices: Send alert notifications to a DingTalk group section in this topic.
Webhook
The system sends an alert notification to a specified webhook URL in the text format. Enter the webhook URL of a product that is interconnected with DataWorks in the Webhook URL field. If multiple webhook URLs are specified, separate them with commas (,).
The webhook URL-based alerting feature is supported only in DataWorks Enterprise Edition.
An alert notification can be sent by using the webhook URL-based alerting feature only to WeCom or Lark.
Practices: Send alert notifications to a DingTalk group
Add a DingTalk chatbot and obtain a token for the chatbot
The operation steps may vary based on the version of DingTalk. The following steps are for reference only.
Go to the DingTalk group to which you want the system to send alert notifications and click the Group Settings icon in the upper-right corner.
In the Group Settings panel, click Bot.
In the Robot Management panel, click Add Robot.
In the Robot dialog box, click Add Robot.
In the Please choose which robot to add section, click Custom.
In the Robot dialog box, click Add.
In the Add Robot dialog box, configure the parameters.
Parameter
Description
Chatbot name
The name of the custom chatbot.
Add to Group
The DingTalk group to which the chatbot is added. This group cannot be changed.
Custom Keywords
After you specify custom keywords, messages can be sent only if these messages contain at least one of the specified keywords. You must add DataWorks as a keyword. This keyword is case-sensitive.
NoteYou can specify a maximum of 10 keywords. A message can be sent only if it contains at least one of the specified keywords.
Read the terms of service, select I have read and accepted <<DingTalk Custom Robot Service Terms of Service>>, and then click Finished.
After you complete the security settings, copy the webhook URL of the chatbot and click Finished.
ImportantKeep the webhook URL confidential. If the webhook URL is leaked, your business is at risk.
Create an alert rule
Go to the Alarm settings page of a real-time synchronization node.
Log on to the DataWorks console. On the Real Time DI page in Operation Center, find the desired real-time synchronization node for which you want to configure an alert rule and click Alarm settings in the Operation column of the node.
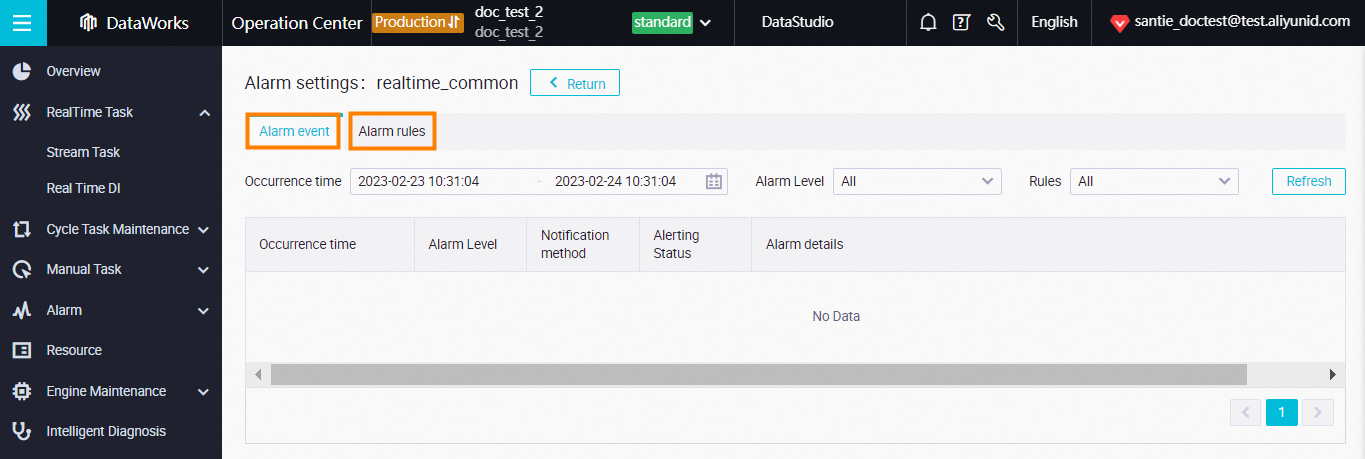
Alarm event: displays alert events that occurred.
Alarm rules: displays alert rules and allows you to create alert rules.
Click the Alarm rules tab and click New rule.
Configure the alert rule.
In the New rule dialog box, configure the parameters such as Name and Description. In this practice, alert notifications are sent to a DingTalk group. Take note of the following configurations:
Select DingTalk for WARNING and CRITICAL.
Enter a token for a DingTalk chatbot in the DingTalk Robot Token field.
Select the Enable check box for DingTalk Group Notification.
ImportantAfter the configuration of the alert rule is complete, the parameter settings automatically take effect.
We recommend that you specify the following metrics at the same time and set thresholds for the metrics based on your business requirements:
You can use the Status metric to monitor whether a node is run as expected.
You can use the Business delay or Accumulated Messages metric to monitor whether the data transmission rate can keep up with the data production rate of the source.
Check whether the alert rule configurations meet your business requirements
After you create the alert rule, you can click Test in the Operation column of the rule on the Alarm rules tab to check whether the alert rule configurations meet your business requirements.