DataWorks is integrated with ActionTrail. This allows you to query ActionTrail for DataWorks behavior events of your Alibaba Cloud account during the last 90 days. You can use ActionTrail to deliver the events to a Logstore in Simple Log Service or a specific Object Storage Service (OSS) bucket for monitoring and alerting. This way, you can audit the events and trace and analyze issues at the earliest opportunity. This topic describes how to query DataWorks behavior events in ActionTrail.
Background information
Alibaba Cloud ActionTrail is a service that monitors and records the actions of your Alibaba Cloud account. The actions include the access to and use of cloud products and services by using the Alibaba Cloud Management Console, API operations, and SDKs. ActionTrail records these actions as events. You can download these events from the ActionTrail console or configure ActionTrail to deliver these events to Simple Log Service Logstores or OSS buckets. Then, you can perform operations such as behavior analysis, security analysis, resource change tracking, and compliance auditing based on the events. For more information, see What is ActionTrail?
Precautions
You can configure tracking alerts for important events to identify and handle anomalous activities at the earliest opportunity.
Query DataWorks behavior events
Log on to the ActionTrail console.
In the left-side navigation pane, choose . Then, select the desired region in the top navigation bar.
On the Event Query page, select Service Name from the drop-down list and enter DataWorks in the search box to query DataWorks events that are recorded.
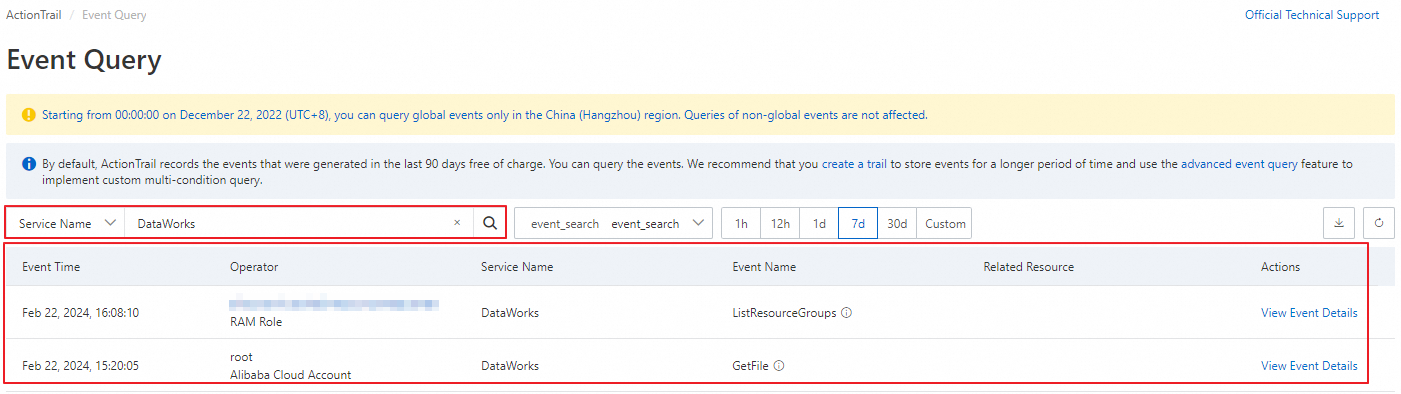
The query results contain information such as Event Time, Related Resource, and Actions. For information about DataWorks operation events that can be audited, see Audit events of DataWorks.
You can determine whether an event is recorded for an API call based on the event name and query the event meaning.
NoteAn API operation can be called by using a codeless user interface (UI) or code editor.
The event is recorded for an API call: The event name is consistent with the API operation name. You can use the event name to query the event meaning from the DataWorks API operation list.
The event is not recorded for an API call: You can query the event meaning from the following table.
Event name
Description
Service
DIDeleteDatasource
A data source is deleted within a tenant.
Tenant
DIBatchDeleteDatasource
Multiple data sources are deleted at a time within a tenant.
DICloneDatasource
A data source is cloned within a tenant.
DownloadExecutionResult
Query results are downloaded.
DataStudio
CreateBusiness
A workflow is created.
DestroyRelationTableFromBusiness
All tables in a workflow are deleted.
DeleteBusiness
A workflow is deleted.
ExecuteFile
A file is run as a temporary task.
LockFile
The lock of a file is stolen, and the file is edited.
DICreateDatasource
A data source is added in Data Integration.
Data Integration
DIBatchCreateDatasource
Multiple data sources are added in Data Integration at a time.
DIUpdateDatasource
A data source is modified in Data Integration.
DITestDatasourceConnection
The network connectivity test is performed on a data source in Data Integration.
DIManageDatasourcePermission
Permissions on a data source are managed in Data Integration.
DICreateTableByDDL
A table schema is generated in Data Integration.
DIPreviewData
A batch synchronization task of Data Integration is previewed in DataStudio.
DIUpdateDataxJob
A batch synchronization task of Data Integration is updated in DataStudio.
DIUpdateStreamxJob
A real-time synchronization task of Data Integration is updated in DataStudio.
DIRunStreamxJob
A real-time synchronization task of Data Integration is started in Operation Center.
DIBatchRunStreamxJob
Multiple real-time synchronization tasks of Data Integration are started in Operation Center at a time.
DIStopStreamxJob
A real-time synchronization task of Data Integration is stopped in Operation Center.
DIBatchStopStreamxJob
Multiple real-time synchronization tasks of Data Integration are stopped in Operation Center at a time.
DIOfflineStreamxJob
A real-time synchronization task of Data Integration is undeployed in Operation Center.
DIBatchOfflineStreamxJob
Multiple real-time synchronization tasks of Data Integration are undeployed in Operation Center at a time.
DIUpdateStreamxJobOwner
The owner of a data synchronization task of Data Integration is changed in Operation Center.
DICreateAlarmRule
An alert rule is configured for a data synchronization task of Data Integration in Operation Center.
DIBatchCreateAlarmRule
Multiple alert rules are configured for data synchronization tasks of Data Integration in Operation Center at a time.
DISimulateAlarm
An alert rule configured for a data synchronization task of Data Integration is tested in Operation Center.
DIStopAlarmRule
An alert rule configured for a data synchronization task of Data Integration is disabled in Operation Center.
DIBatchStopAlarmRule
Multiple alert rules configured for data synchronization tasks of Data Integration are disabled in Operation Center at a time.
DIStartAlarmRule
An alert rule configured for a data synchronization task of Data Integration is enabled in Operation Center.
DIBatchStartAlarmRule
Multiple alert rules configured for data synchronization tasks of Data Integration are enabled in Operation Center at a time.
DIDeleteAlarmRule
An alert rule configured for a data synchronization task of Data Integration is deleted in Operation Center.
DIBatchDeleteAlarmRule
Multiple alert rules configured for data synchronization tasks of Data Integration are deleted in Operation Center at a time.
DIUpdateAlarmRule
An alert rule configured for a data synchronization task of Data Integration is modified in Operation Center.
DISaveSolution
A data synchronization solution is created or modified and saved in Data Integration.
DIDeleteSolution
A data synchronization solution is deleted in Data Integration.
DIStartSolution
A data synchronization solution is started, rerun, or updated in Data Integration.
DIStopSolution
A data synchronization solution is stopped in Data Integration.
DICloneSolution
A data synchronization solution is cloned in Data Integration.
DICreateSolutionAlarmRule
An alert rule is configured for a data synchronization solution.
DISimulateSolutionAlarmRule
An alert rule configured for a data synchronization solution is tested.
DIDeleteSolutionAlarmRule
An alert rule configured for a data synchronization solution is deleted.
DIUpdateSolutionAlarmRule
An alert rule is updated for a data synchronization solution. The update operations include configuration, disabling, and enabling.
DISaveSolutionV1
A data synchronization solution is created or modified and saved on the old-version user interface (UI) for data synchronization solutions.
DIDeleteSolutionV1
A data synchronization solution is deleted from the old-version UI for data synchronization solutions.
DIStartSolutionV1
A data synchronization solution is run or rerun on the old-version UI for data synchronization solutions.
DICloneSolutionV1
A data synchronization solution is cloned on the old-version UI for data synchronization solutions.
DIFullSupplementData
Full data is backfilled for a data synchronization solution on the old-version UI for data synchronization solutions.
DownloadSqlResult
SQL query results in DataAnalysis are downloaded.
DataAnalysis
DownloadSheet
Workbooks in DataAnalysis are downloaded.
RunTask
SQL query commands in DataAnalysis are run.
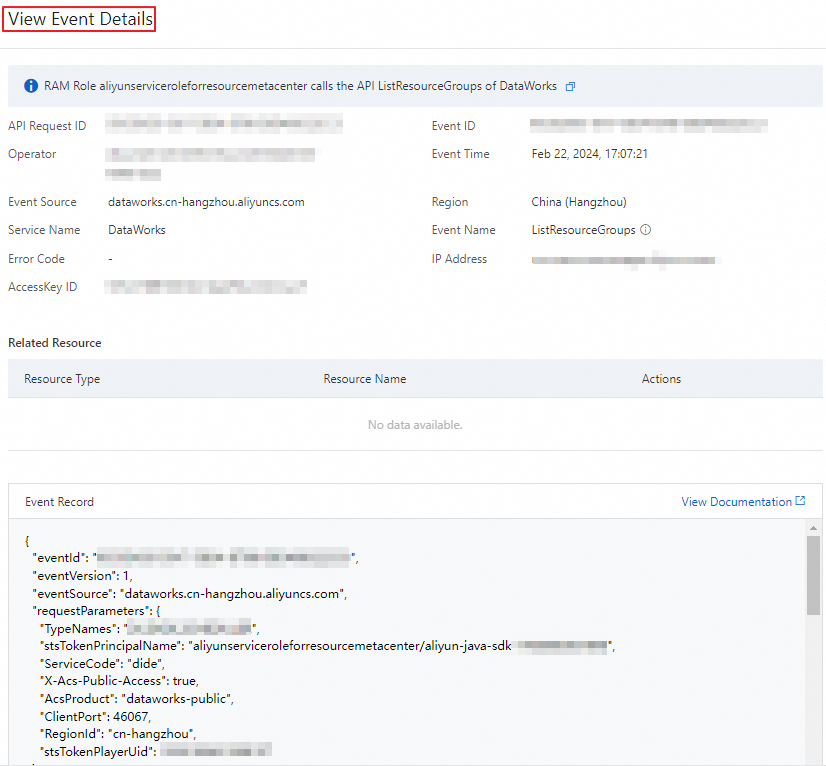
View event details.
On the Event Query page of the ActionTrail console, find the desired event and click View Event Details in the Operation column to view the details of the event in the View Event Details panel. The displayed information includes the source of the event, the code record of the event, and the overview of the resources that are used.
What to do next
You can use the queried event details to perform operations such as behavior analysis, security analysis, resource change tracking, and behavior compliance auditing.