The Real-time Computing Nodes page of the DataWorks console displays all real-time computing tasks. You can view the basic information and running information about the tasks on this page. You can also configure alert rules for the tasks that you want to monitor. This way, you can identify and handle exceptions at the earliest opportunity if an error occurs on a task.
Limits
Currently, DataWorks supports operations only on tasks that are submitted from EMR Spark Streaming and Flink SQL Streaming nodes.
Go to the Real-time Computing Nodes page
Log on to the DataWorks console. In the top navigation bar, select the desired region. In the left-side navigation pane, choose . On the page that appears, select the desired workspace from the drop-down list and click Go to Operation Center.
In the left-side navigation pane of the Operation Center page, choose .
View the real-time compute tasks in the task list
The Stream Task page displays all real-time compute tasks in the production environment. You can view the basic information about, start, stop, or undeploy a real-time compute task. You can also configure alert rules for a real-time compute task.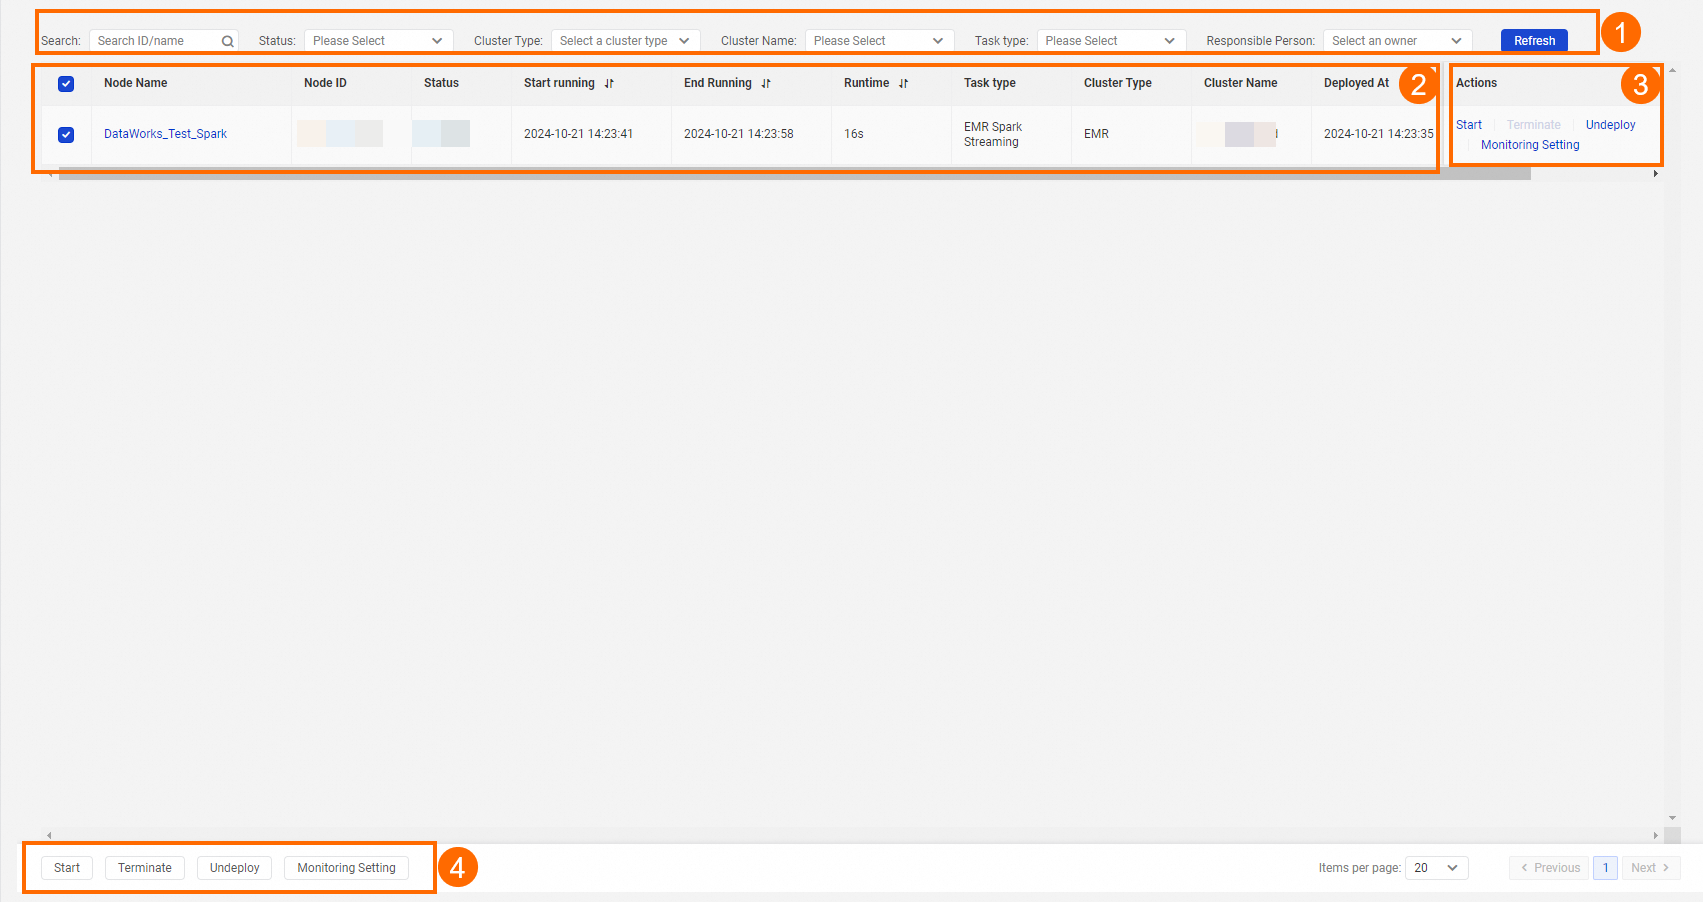
Section | Description |
1 | In this section, you can search for a real-time compute task by task ID or task name. You can also specify one of the following filter conditions to perform the operation: Status, Cluster Type, Cluster Name, Task Type, and Responsible Person. Note
|
2 | In this section, you can view the basic information and details of a real-time compute task.
Note You can rank all real-time compute tasks in ascending or descending order by Starting running, End Running, or Runtime. |
3 | In this section, you can perform the following operations on a real-time compute task:
|
4 | In this section, you can perform an operation on multiple real-time compute tasks at a time. You can select multiple tasks and click Start, Terminate, Undeploy, or Monitoring Setting to perform the related operation on these tasks. |
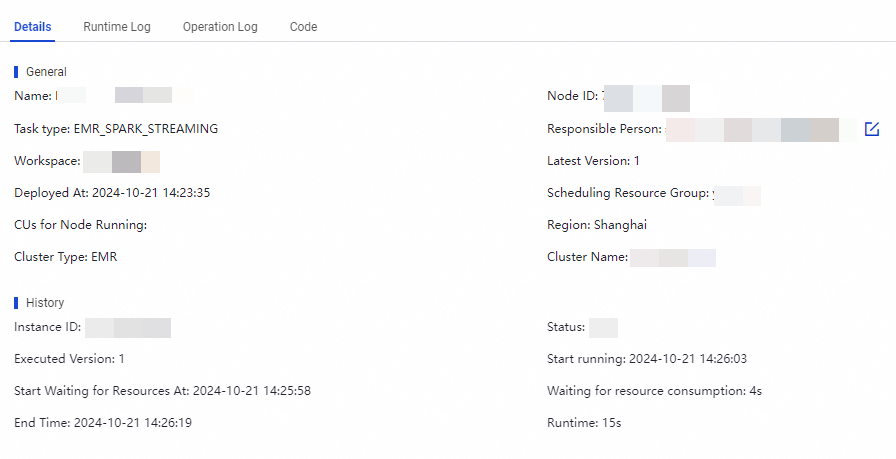
View the details of a real-time compute task
On the Stream Task page, find the real-time compute task whose details you want to view and click the task name to go to the details panel of the task. In the task details panel, you can view the details, run logs, operation logs, and code of the task on the Details, Runtime Log, Operation Log, and Code tabs. This allows you to quickly locate operations performed on the task and operation records, obtain details of the errors reported for the task, and fix the errors.