The Data Risks feature displays risks detected by your fraud detection rules. It presents this information from multiple dimensions to help you understand risk distribution, trends over time, and project rankings by risk count. You can use this feature to identify high-risk periods and projects. You can also view details, such as the user, time, and operation that triggered a risk, to locate and handle it promptly. This topic describes the Data Risks feature.
Prerequisites
You must enable the Fraud Detection Management feature and configure fraud detection rules. Only risk data that hits these rules is displayed on the Data Risks page. For more information, see Fraud Detection Management.
Go to the Data Risk page
Go to Data Security Guard.
Go to the DataStudio page.
Log on to the DataWorks console. In the top navigation bar, select the desired region. In the left-side navigation pane, choose . On the page that appears, select the desired workspace from the drop-down list and click Go to Data Development.
Click the
 icon in the upper-left corner. Then, choose . On the page that appears, click Try Now to go to the Data Security Guard page. Note
If your Alibaba Cloud account is granted the required permissions, you can directly access the homepage of Data Security Guard.
If your Alibaba Cloud account is not granted the required permissions, you are redirected to the authorization page of Data Security Guard. You can use the features of Data Security Guard only after your Alibaba Cloud account is granted the required permissions.
In the navigation pane on the left of the Data Security Guard page, click Data Risk.
On this page, you can view the risk overview and risk details for the current tenant. For more information, see View the risk overview and View risk details.
View the risk overview
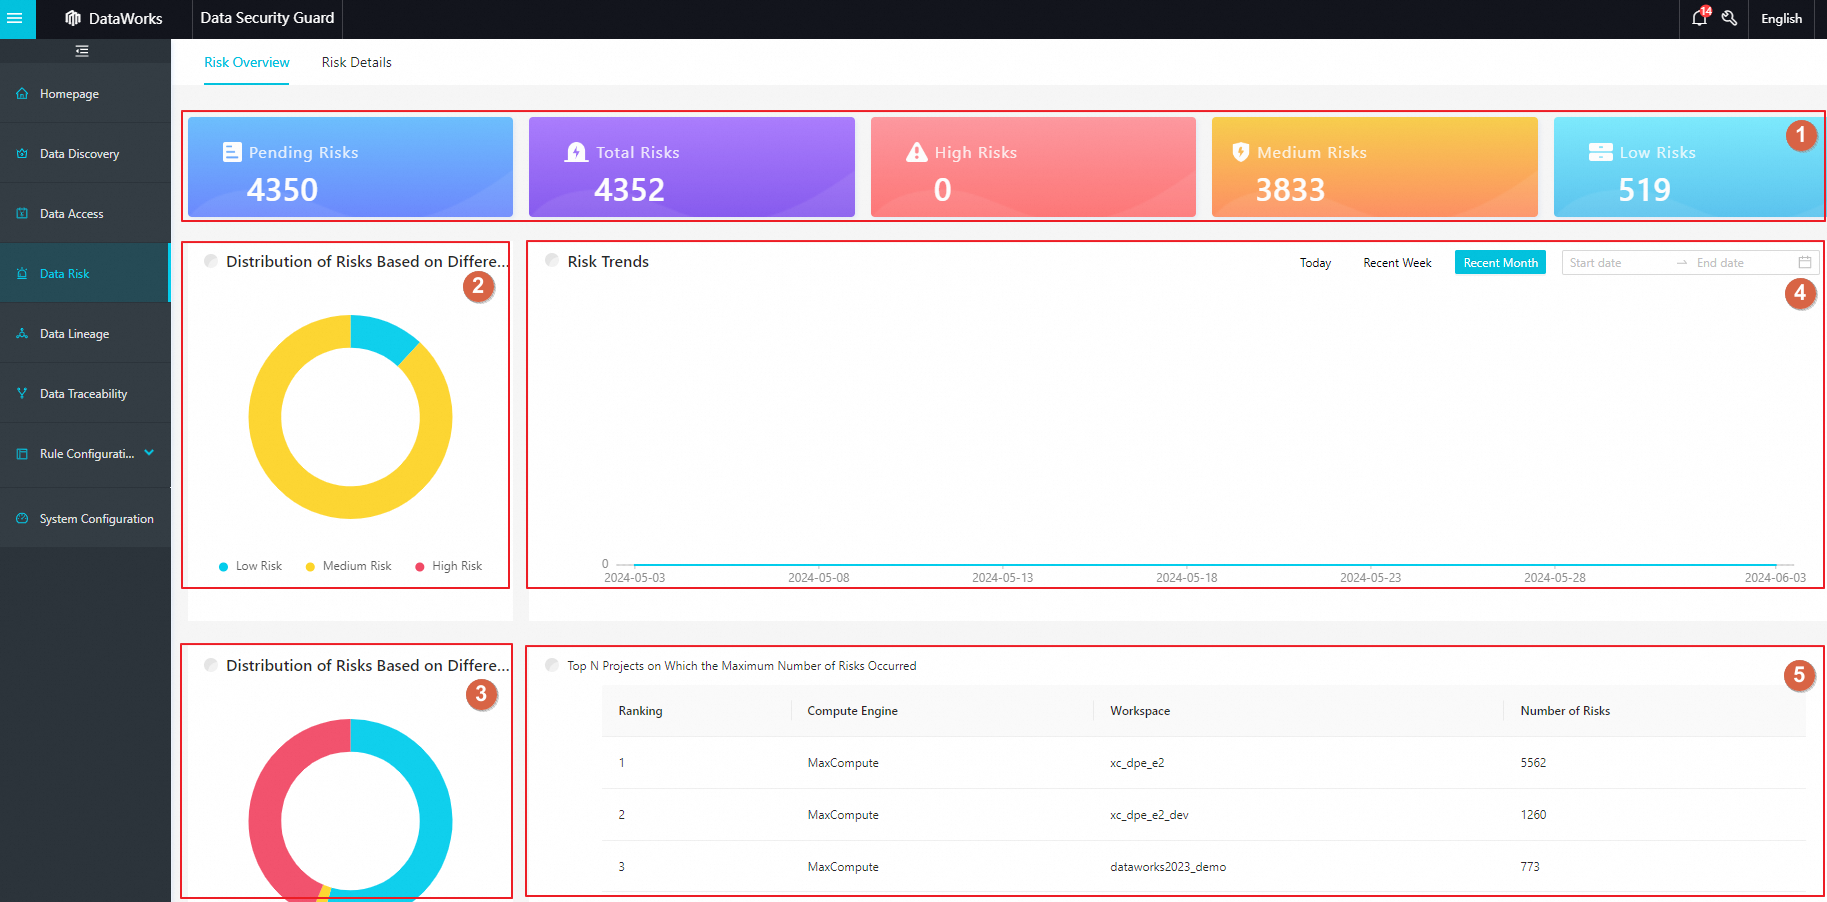
The Risk Overview page displays risk data for the current tenant from different dimensions, such as operation type, risk level, and risk trend. This helps you obtain a comprehensive overview and manage all risks.
Area | Description |
1 | In this area, view the number of risks for the current tenant by category. Categories include Pending Risks, Total Risks, High Risks, Medium Risks, and Low Risks. |
2 | In this area, a pie chart shows the distribution of High, Medium, and Low level risks for the current tenant. Click a colored section of the chart to see the number of risks for that level. |
3 | In this area, a pie chart shows the distribution of risks by operation type for the current tenant, such as Data Access, Data Operation, and Data Exporting. Click a colored section of the chart to see the number of risks for that operation type. |
4 | In this area, select a time range to view the trend of risk counts over that period. Hover your mouse over a data point in the line chart to view the number of risks that occurred on that day. |
5 | In this area, view the projects with the highest number of risks for the current tenant. This lets you quickly identify high-risk projects and manage the related risks in a centralized way. |
View risk details
The Risk Details page displays detailed information about risks, including the risk name, type, operator, time of occurrence, and status. You can use this information to trace the cause of a risk and handle it promptly. The following description uses the All Risks tab as an example to describe the content on the risk Details page.
Area | Description |
1 | In this area, view the number of risks for the current tenant by category. Categories include Pending Risks, All Risks, Handled Risks, and No Risk. |
2 | In this area, filter by risk type to view the number of risks of a specific type. By default, risks of all types are displayed. |
3 | In this area, view the list of risks that match the selected criteria. The list shows the Risk Name, Risk Type, Risk Level, Operator, Occurrence Time, and Risk Status for each risk. You can perform the following operations in this area:
|