The shape mapper is used to map the content between data values and graphics in a widget. Graphics include vector and icon. This topic describes how to use the shape mapper to map data to a graph. In this example, the Vector Scatter Layer component of the Basic Flat Map 3.0 component is used to configure the scatter shapes.
When you configure the scatter shape in the map widget, you must first select a scatter type. The available scatter types include Vector and Symbol. For more information, see Shape mapper types. After you select a scatter type, you can configure the corresponding scatter shapes in the lower part of the configuration panel, such as Vector and Symbol. 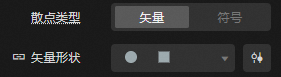
Scatter points of the Vector type support the Stroke effect. Scatter points of the Symbol type do not support the Stroke effect.
Configure shape mapping
You can use one of the following methods to configure the shape of the scatter dots. In this example, the Scatter Type parameter is set to Vector.
Method 1: Click the
 icon on the left side of the Vector Shape configuration items. When you click the mouse button to enable visual mapping, you do not need to be driven by data. You only need to configure the style. In the drop-down shape selection drop-down box, select a scatter graph.
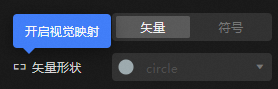
Method 2: Click the
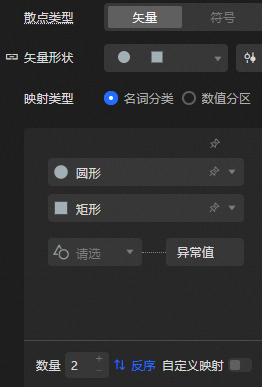
 icon on the left side of the Vector Shape configuration items. When you click Disable Visual Mapping in the Hover state, use the shape mapper. The mapping is driven by the scatter data. You can select multiple scatter graphs.
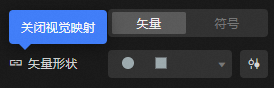
Description of the shape mapper function
Description | Remarks |
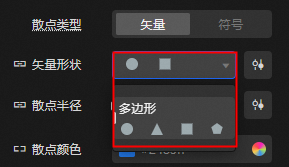
Toggle configuration shape mapping when panel collapses | With the shape mapper set to collapsed, click the drop-down list to open the shape template. The top row displays the currently mapped shape results, with multiple shape templates available for you to choose from below. Click a shape within the template to quickly switch mapping shapes. |
Panel expansion configuration mapping details | When the shape mapper is set to the expanded state, the system automatically reads data and maps the shape and data. You can configure the mapping details as follows.
|
 icon to sort the shape mappings in reverse order.
  icon to the left of a line map entry to delete the entire line map entry.
  icon below the shape mapping list to add a row of shape mapping entries.
 Shape Mapper Type
The graphics mapping types of shape mappers can be divided into two types: vector and symbol.
Vector: maps data to a vector polygon, such as a triangle, square, diamond, and hexagon.
Symbol: maps data to a symbol icon. You can obtain a symbol by using a built-in icon or a custom input URL.