In this example, the Multi-line Text widget is used to display the description of a logo wall logo.
Effect display 
Procedure
Log on to the DataV console.
Select a dashboard and click Edit to go to the Canvas Editor page.
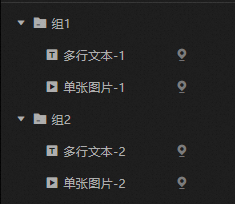
Add a single image widget and a multi-line text widget to the canvas.
Select all components in the layer list and right-click Group.
Repeat the preceding steps to add another group and rename the component to make sure that the two groups are different.
Click the Image widget and click the Data Source tab to modify the static data.
Single image -1
// Single image 1
[
  {
    "img": "",
    "url": "",
    "value": "Alibaba Group operates multiple businesses. In addition, Alibaba Group also receives support from the businesses and services of its affiliates to operate the business ecosystem. Business and affiliates include: Taobao, Tmall, Juhuasheng, Global AliExpress, Alibaba International Trading Market, 1688, Alimama, Aliyun, Ant Financial, Cainiao Network, etc. "
  }
]
Single image -2
// Single image 2
[
  {
    "img": "",
    "url": "",
    "value": "Founded in November 1998, Tencent is an Internet company that enriches the lives of Internet users through technology and helps enterprises upgrade digitally. Our mission is "user-oriented technology for good". "
  }
]
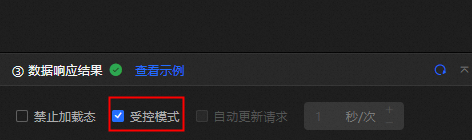
Select all Multi-line Text widows. On the Data Source tab, turn on Controlled Mode and hide all widows.
Click the
 icon to switch to Blueprint Editor.
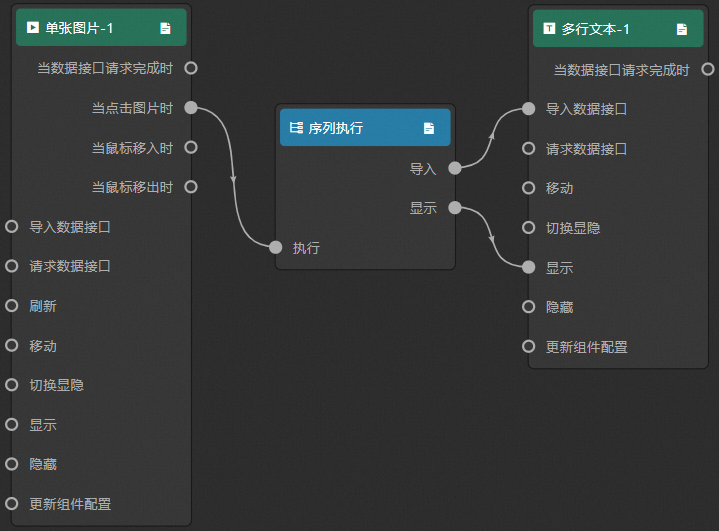
 Add Single Image -1 and Multiple Lines of Text -1 to the canvas.
Click Logical Nodes and add a Sequence Execution node to the blueprint canvas.
Connect components.
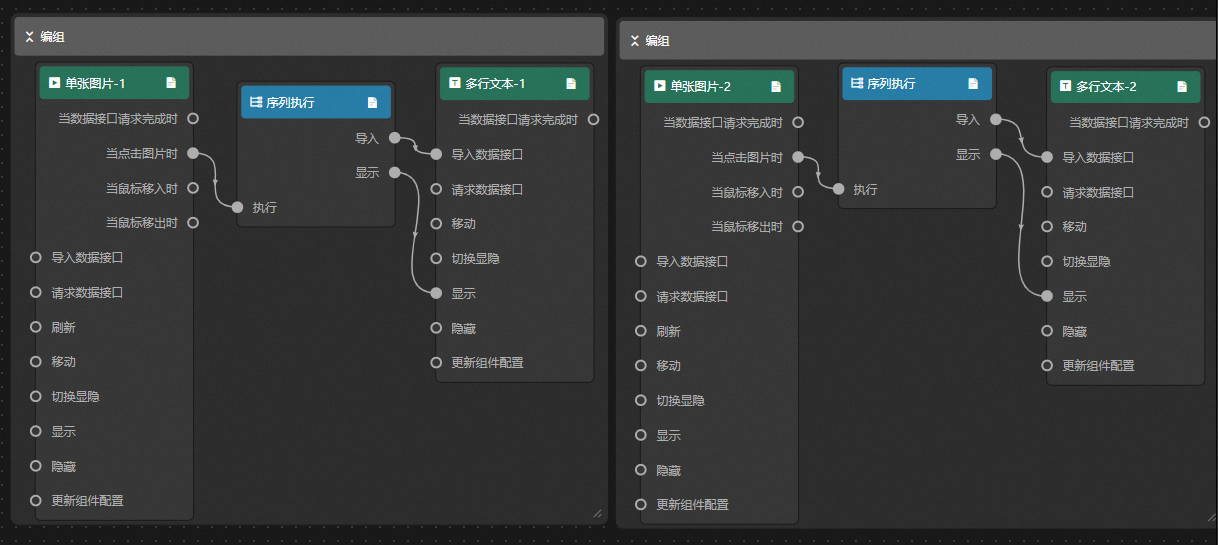
Repeat Step 9 to Step 11 to connect another single image and group all the images for display.
Configure all sequence execution node processing methods.
Import data
return [{
  "value": data.value
}]
Tab
return {
  "animationType": "",
  "animationDuration": 1000,
  "animationEasing": ""
}
Click the Preview icon in the upper-right corner to preview the results.
