The dimension mapper is used to adjust the size of an entity. You can use the Range slider to determine the size range of an entity. This topic describes how to customize the mapping between data values and dimensions by configuring the radius of the vector scatter layer in the Basic Plane Map 3.0 widget.
Configure dimension mapping
Configure the radius of the scatter points in the map subwidget. You can use two methods to adjust the radius of the scatter points.
Method 1: Click the
 icon on the left of the configuration items to turn off the Scatter Radius. When you click the pointer to turn on Visual Mapping, you do not need to be driven by data. You can simply customize the style configuration. You can adjust the size of the scatter graph by sliding the slider or entering a number.
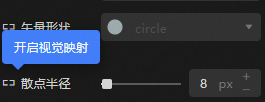
Method 2: Click the
 icon on the left of the configuration items to turn on the Scatter Radius. When you click Turn off Visual Mapping in the Hover state, use the size mapper. The mapping is driven by the scatter data. You can use the Range slider to configure the scatter size.
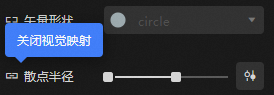
Dimension Mapper Function Description
Description | Remarks |
Configuring Size Range Mapping When a Panel Collapses | When the dimension mapper is in the collapsed state, drag the slider on the left to adjust the size of the graph corresponding to the minimum value. Drag the slider on the right to adjust the size of the graph corresponding to the maximum value. Note The system will automatically calculate the intermediate value and drawing size according to the parameters of the maximum and minimum values. |
Panel Expand Configuration Size Mapping Details | When the dimension mapper is in the unfolded state, the system automatically reads the data and performs mapping matching between the graphic dimension and the data. You can configure the mapping details as follows:
|
