This topic outlines frequent issues and their solutions related to widget configuration items.
What is the relationship between data series and configuration item series?
Data Series
Many basic two-dimensional widgets, such as line and column charts, support the display of multiple series. Configure different s fields in the Data tab of the configuration panel to achieve this.
Configuration Item Series
Widgets that support multiple series, such as line and column charts, typically have a Data Series configuration item in the Configuration tab.
This configuration item allows you to define an array of styles to loop through and apply to different series in the data. As illustrated below, the configuration item specifies two series, and the widget will use the styles of
['Series 1','Series 2']to loop through and render the s field in the data.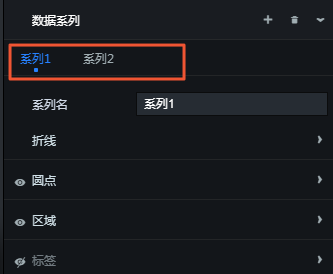
Common Mistakes
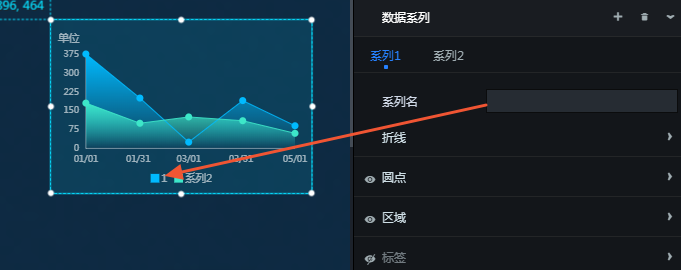
The Series Name in the configuration item serves as both the style name and the chart legend name. If left empty, it defaults to the s field value of the corresponding data series.
Figure 1. Non-empty Series Name
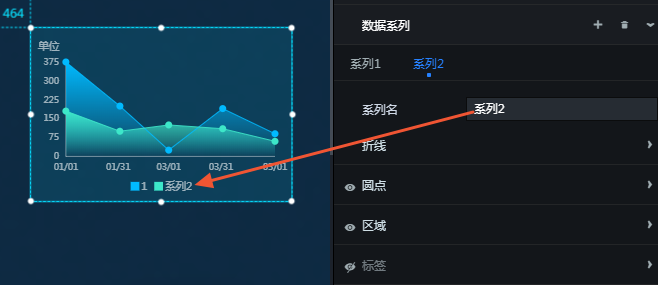
Figure 2. Empty Series Name
The series in the configuration item and the data series are matched by their order of appearance, not by name.
For instance, if the configuration item series is
[Series 1, Series 2, Series 3], it maps to the data as[{s1: Series 1 style},{s2: Series 2 style},{s3: Series 3 style},{s4: Series 1 style},{s5: Series 2 style}].NoteIn this example, s1, s2, s3, s4, s5 correspond to the order in which the s field appears in the data.
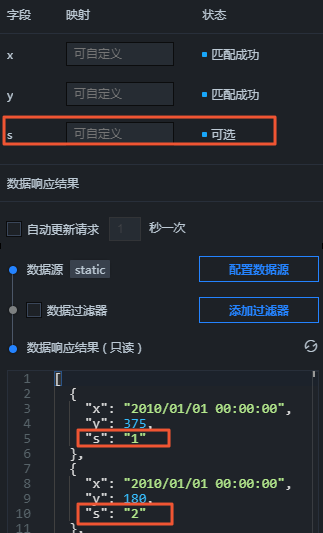
To enforce a fixed data series style (e.g., s2 must be red, s1 must be blue), sort the data in the filter or data source after configuring the series styles.
For example, if the configuration item series is
[Red, Blue], you can adjust the data order to[{"s":"2"},{"s":"1"}].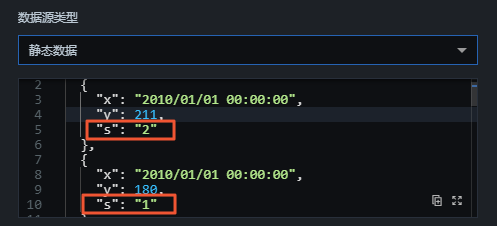
How to configure interaction features?
The interaction feature is currently undergoing testing. For guidance on configuring the interaction feature, see chart filter interaction.
How to control displayed data through URL parameters?
Variables in SQL can be denoted by :dot-id, such as in the query select car_speed, car_color, car_name from table where car_ID = :dot-id.
Pass parameters through the URL to control these variables, for example, http://datav.aliyun.com/...?spm=xxxxx&dot_id=10102.
Why is the component not modified after the callback ID changes?
Testing the Component's Callback ID on the Edit Page
Cause of the issue: Components on the edit page cannot retrieve callback values from other components.
Solution: Include default values in the URL to test the component on the edit page.
For instance,
xxxx/admin/screen/123456?value=123&name=12345.Testing the Component's Callback ID on the Preview or Publish Page
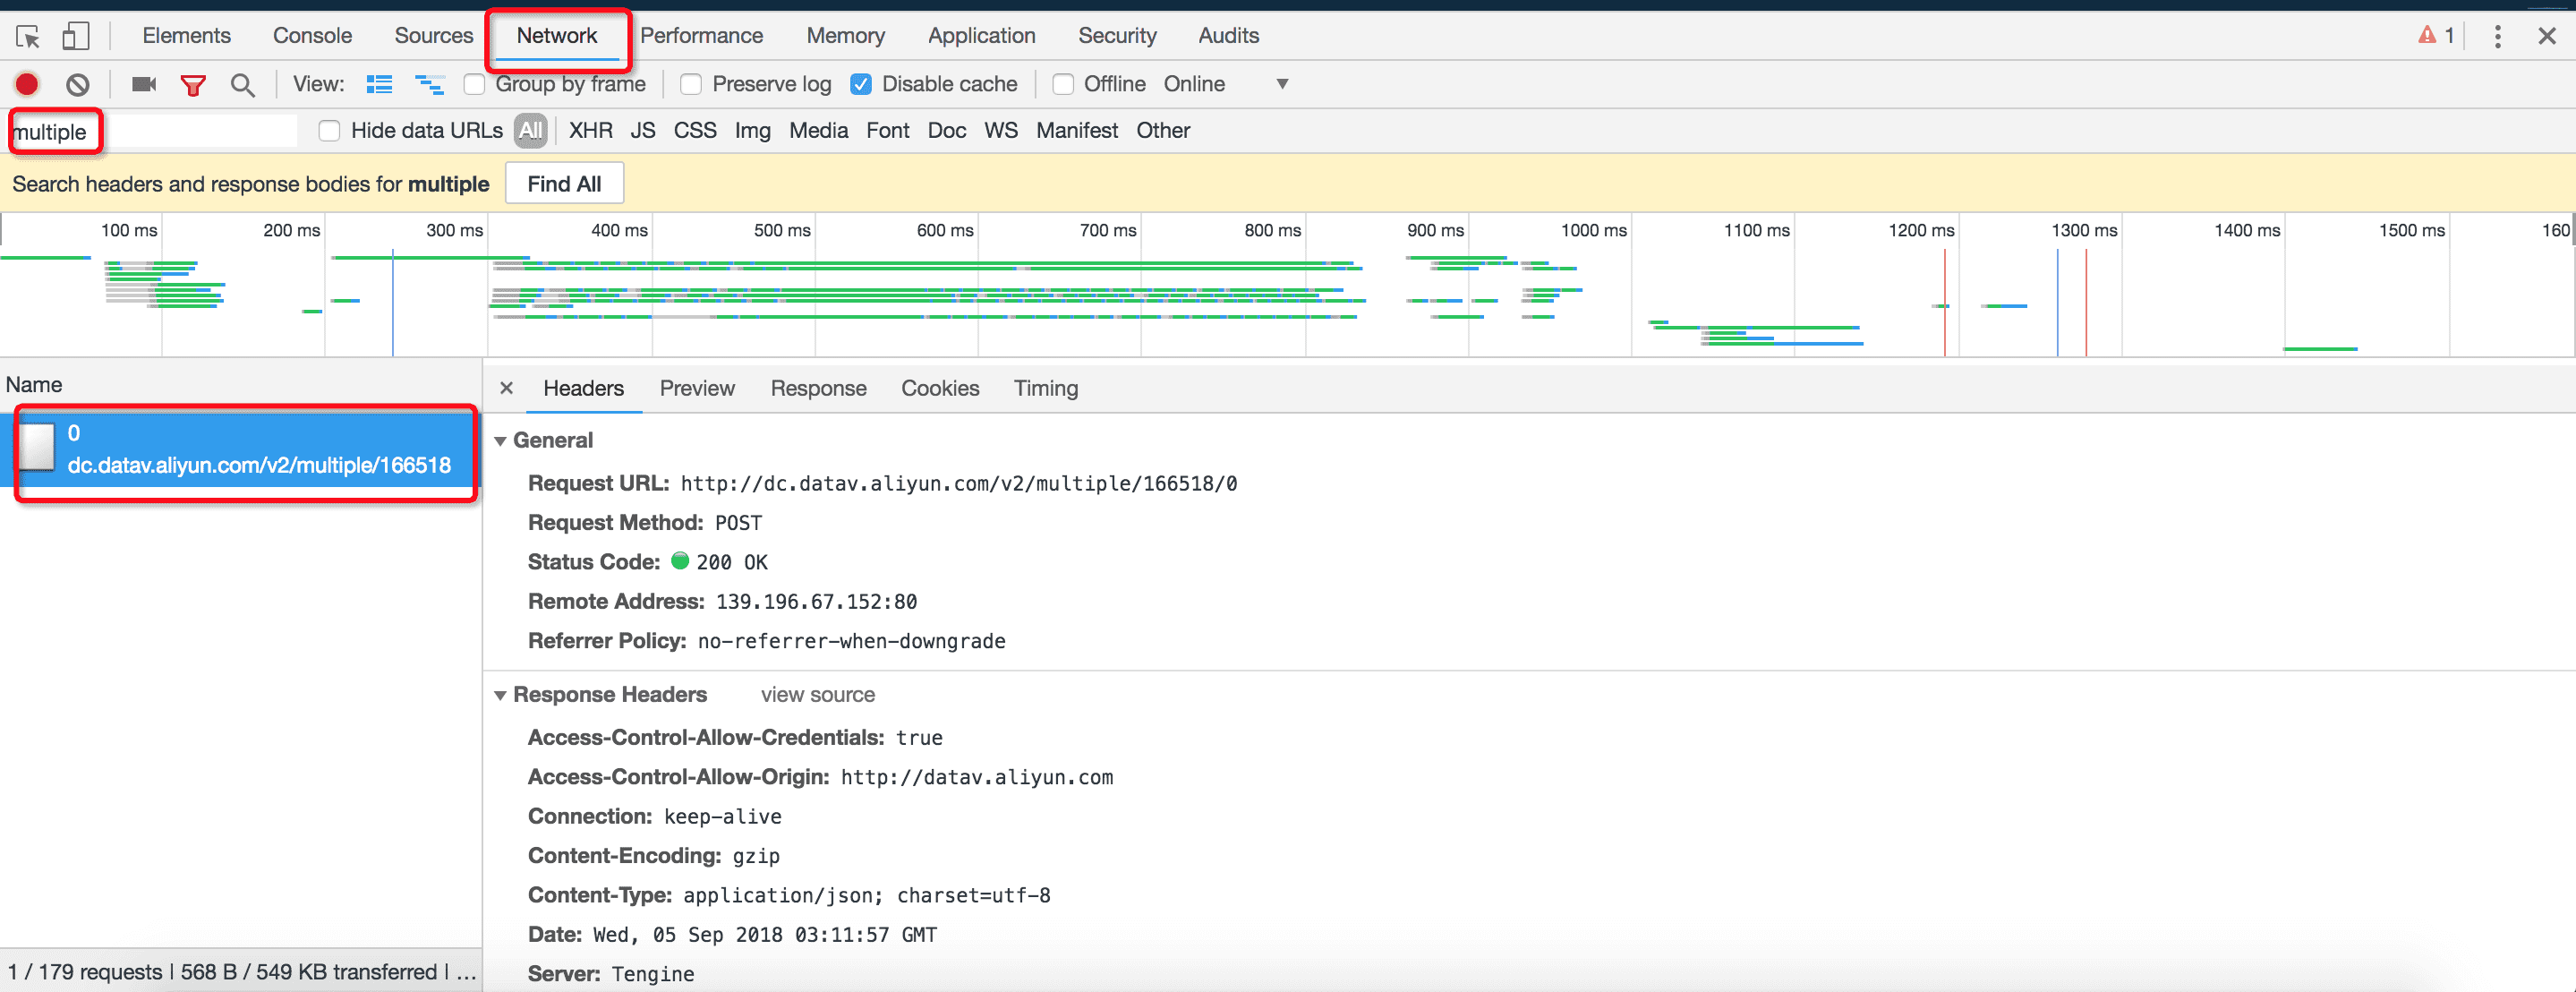
On the preview/publish page, open the browser console's network tab (shortcut key F12 for Windows, option+command+i for Mac), search for
multiple, and verify if the component initiates a request after the callback changes.If no search results appear, the component did not initiate a request. Review the callback configuration.
If search results are present, the component made a request. Confirm that the request's parameters are the correct callback parameters and that the request returns a 200 status normally (the Status is 200 in the image below).
If the request fails, check the data source's connection status.
If using the Number Ticker Board component and the data returns normally but does not update the rendering, verify whether Data Jitter Correction is enabled in the component's configuration.
If enabled: the component will not update its rendering when incoming data is less than the current data.
Disable this option if your data fluctuates and you need to render the current data in real-time.
How to add a click event to the entire group?
Problem Description: How can you add a click event to a group in DataV-Board 7.0 to trigger and execute related instructions?
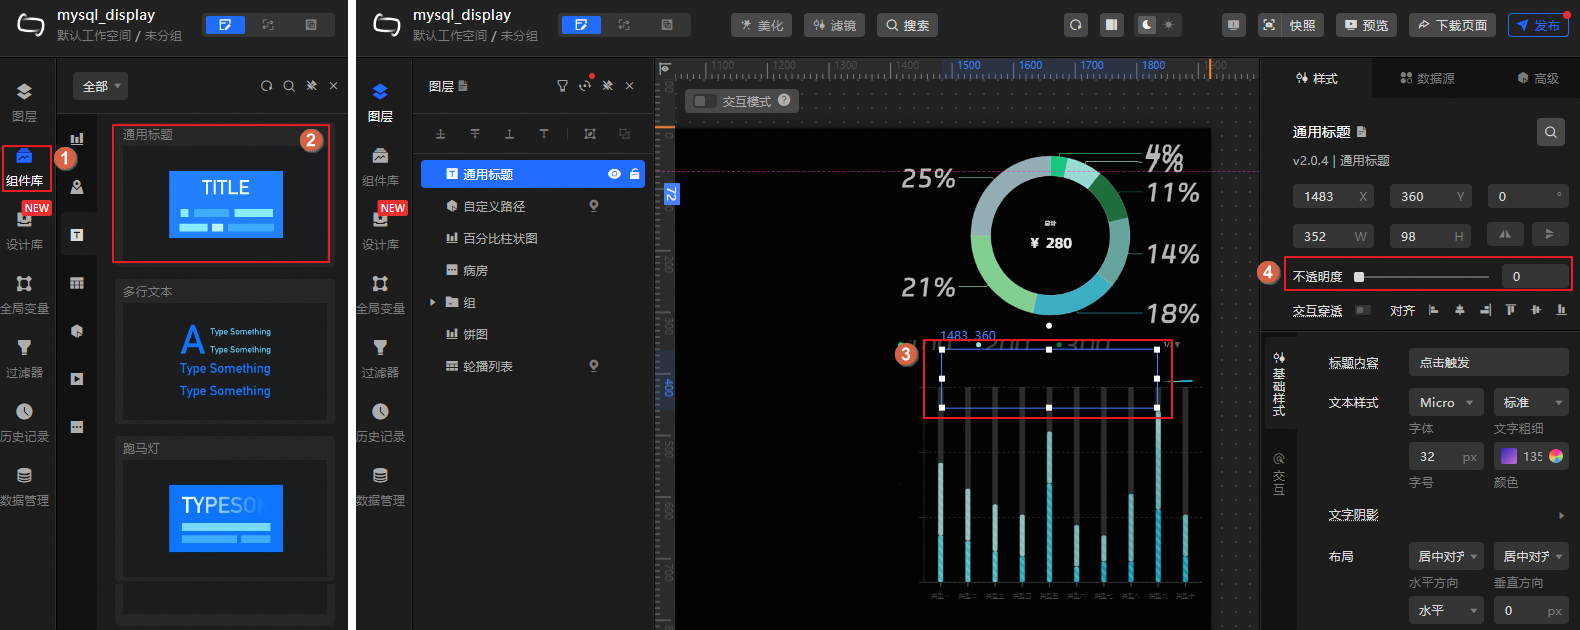
Solution: Add an image or title widget to the desired group and set it to a transparent style. Clicking the transparent widget or image will trigger the corresponding event.
Operation Example: Follow the steps shown in the image below to add a general title to the top layer of the current group (created by the pie chart and list carousel) and set the title widget to transparent. Then, as needed, add relevant instructions to the title widget to trigger events upon clicking. For additional widget operations, refer to PC widgets.