Scenarios
Updated at:
Copy as MD
DataV is used in operations data dashboards, geographic data dashboards, urban traffic dashboards, and control center dashboards. Activate the DataV-Board service to explore high-quality industry templates and quickly build your own data dashboards.
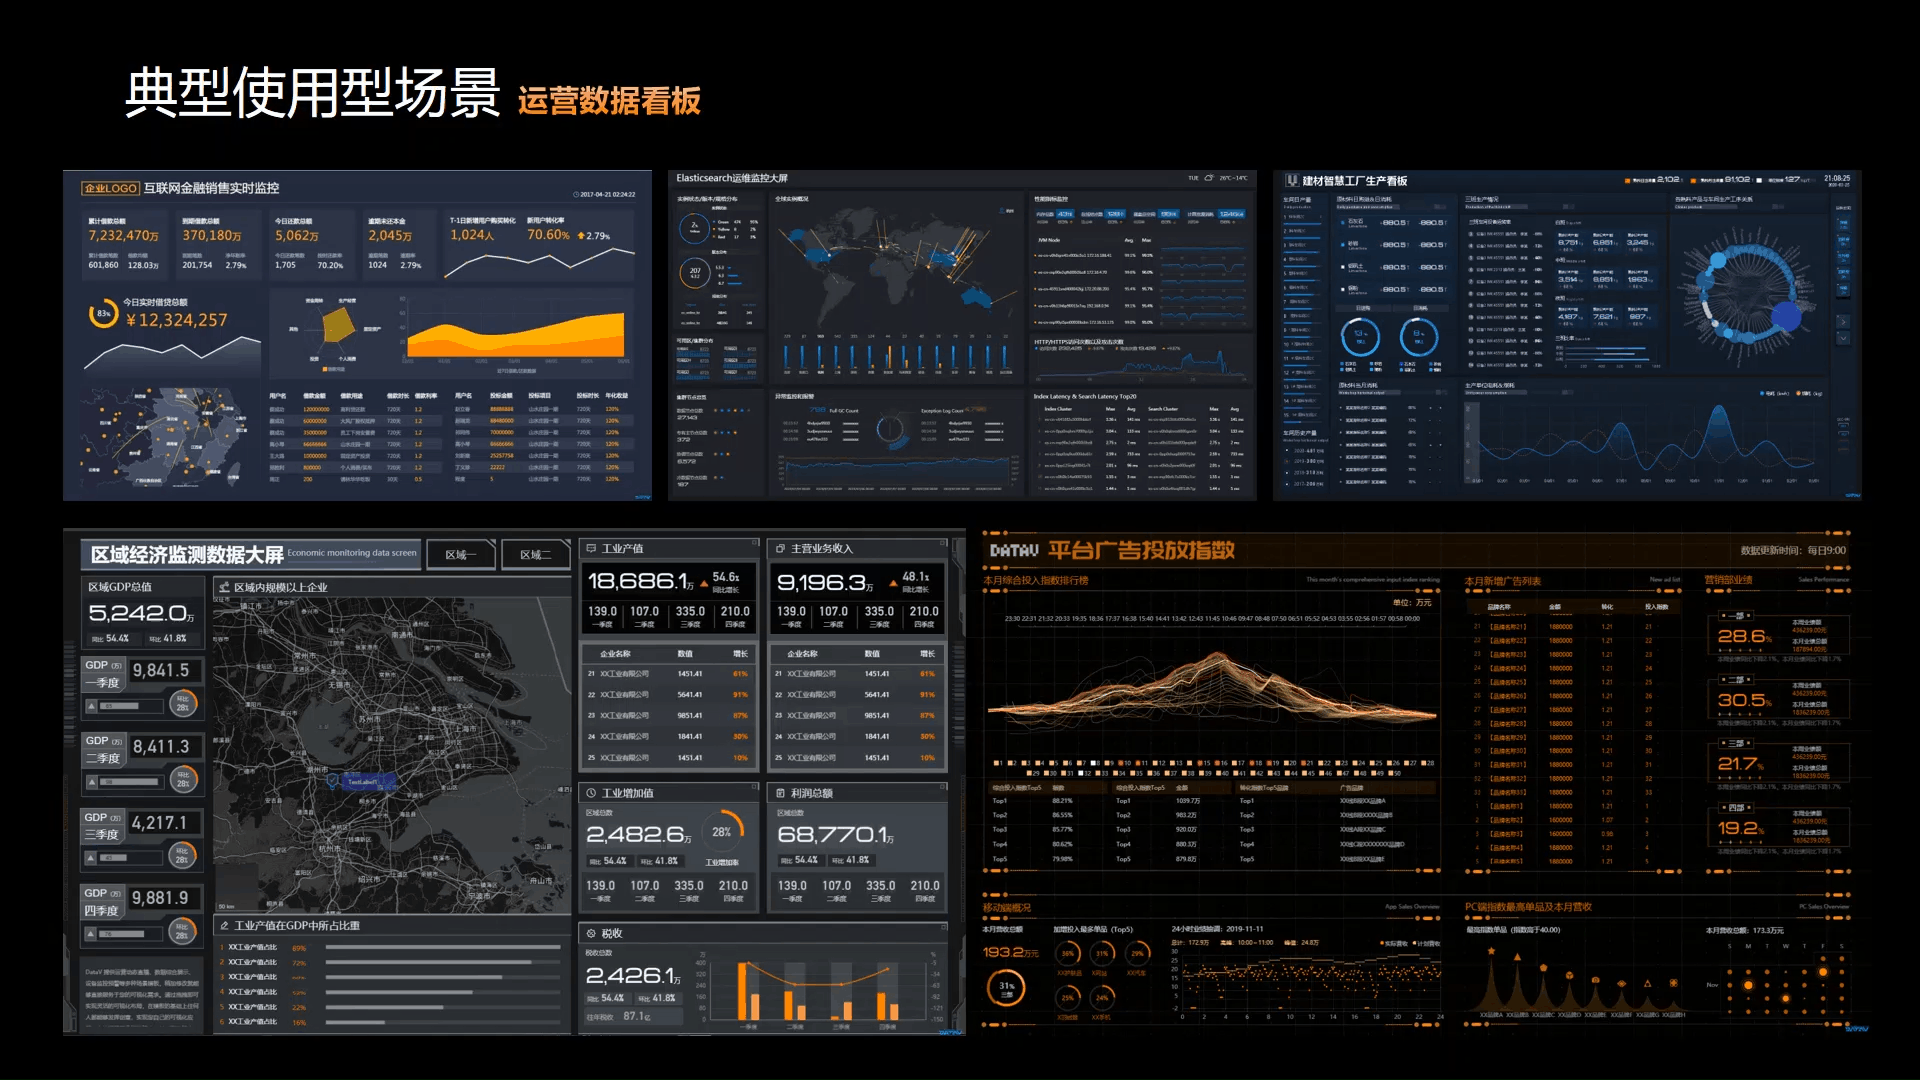
Operations data dashboard
Monitor, analyze, and display key business metrics to quickly understand your business status and make data-driven decisions.
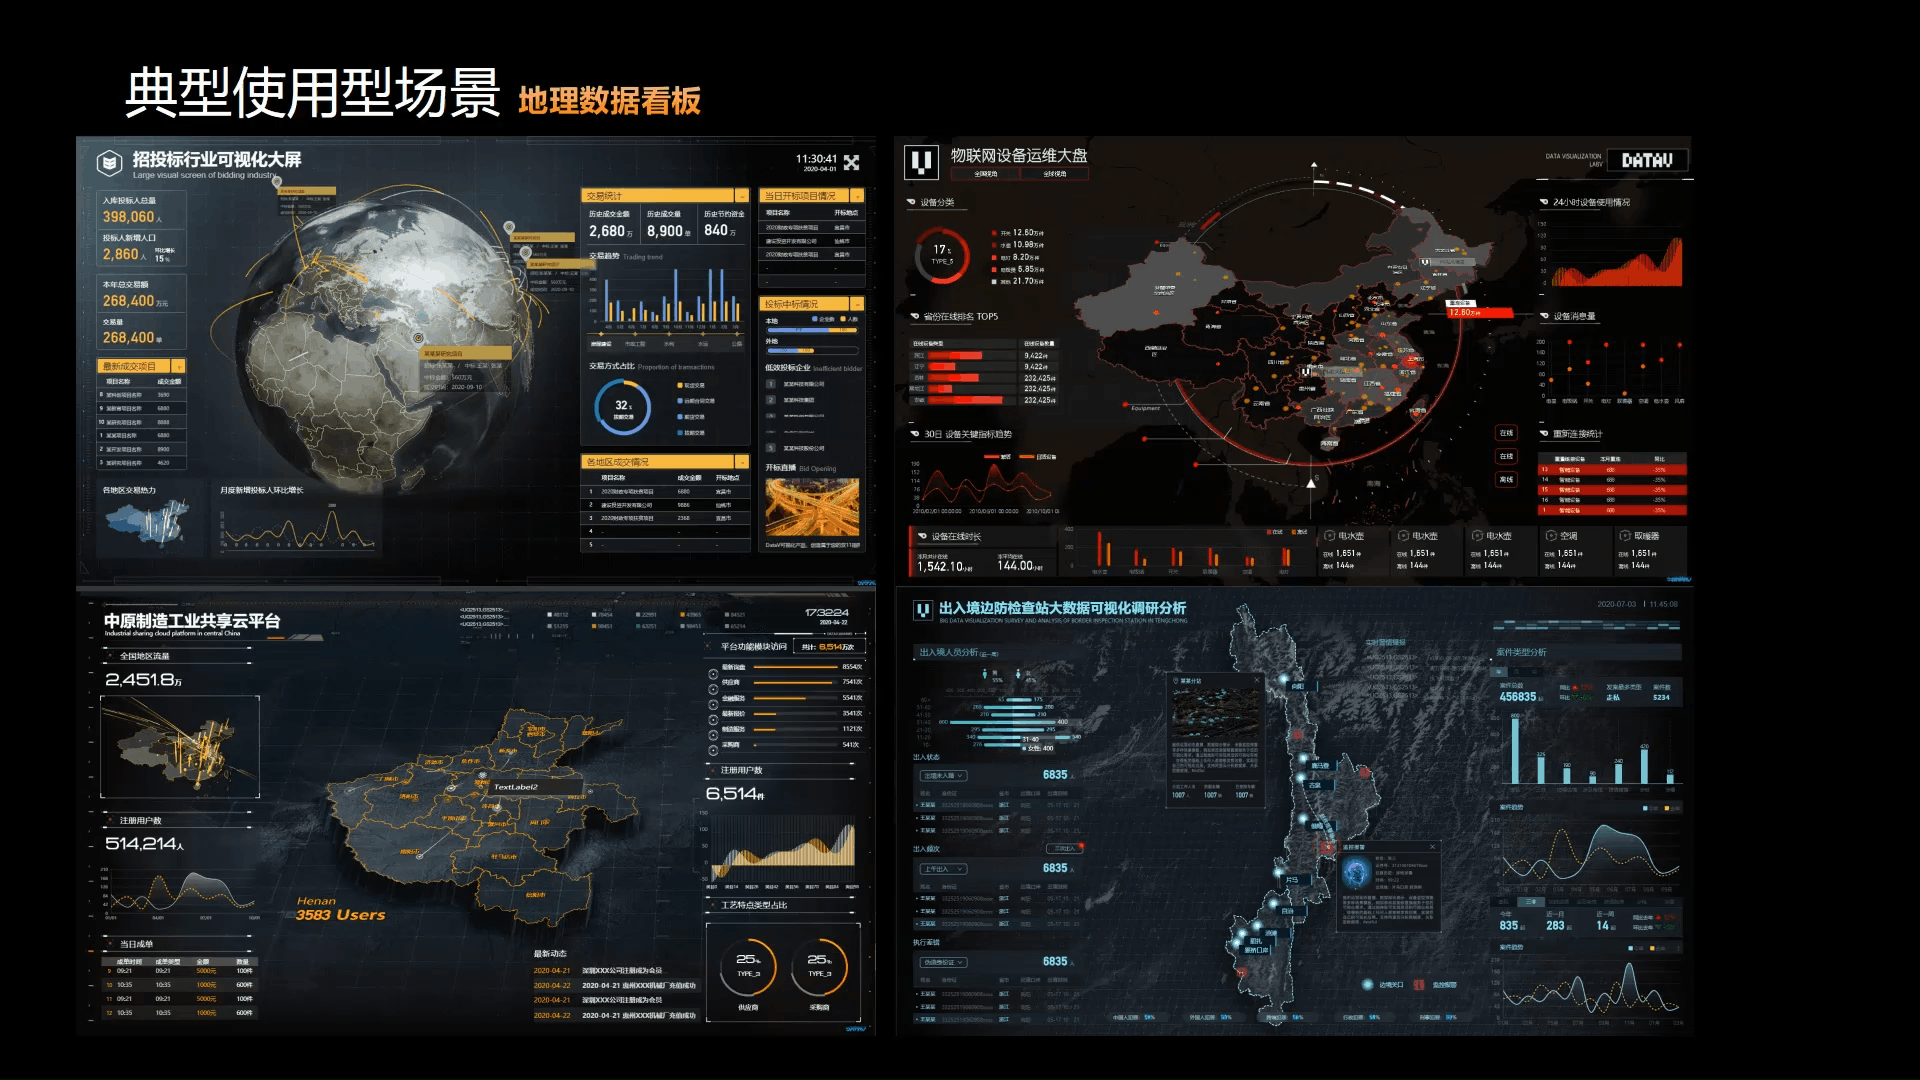
Geographic data dashboard
Visualize geographic data based on location information by using a rich set of chart and spatiotemporal geographic widgets.
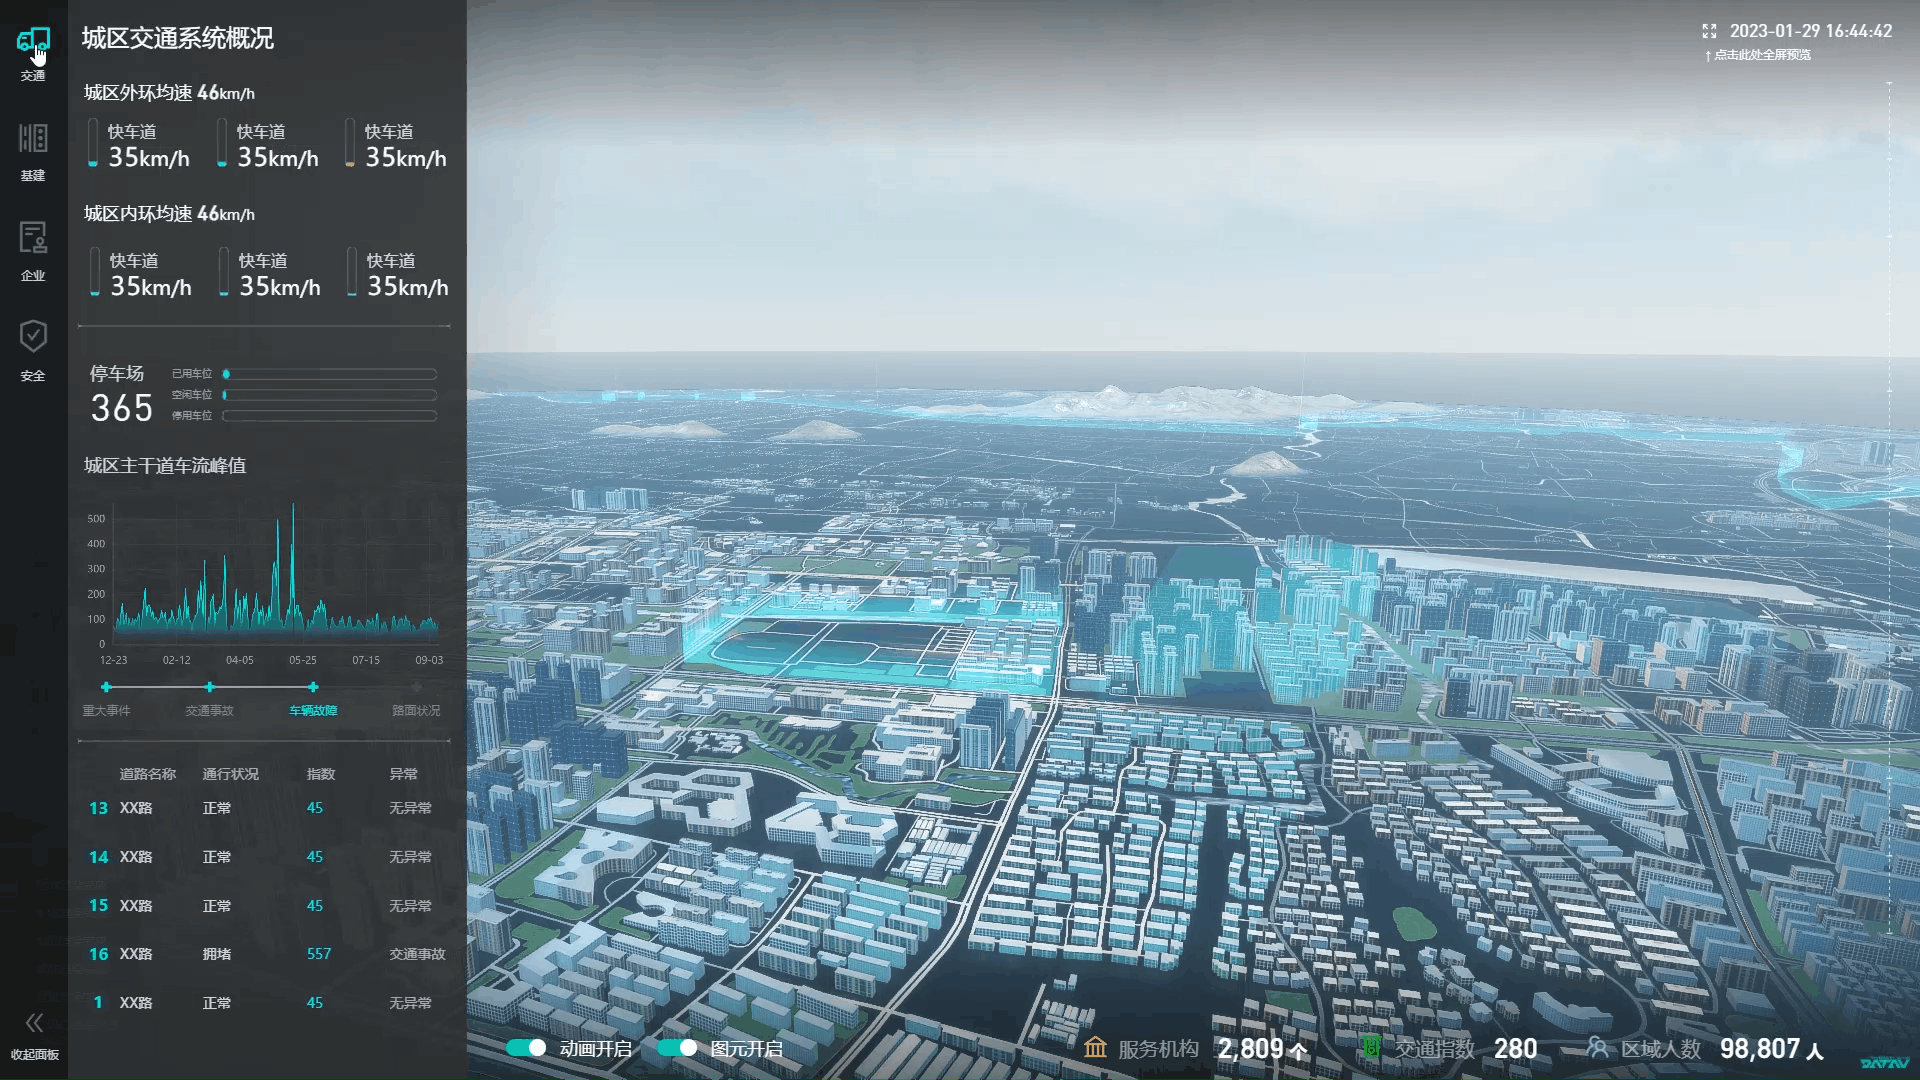
Urban traffic dashboard
Combine real-time traffic data with visual analytics to provide a complete data foundation for traffic management.
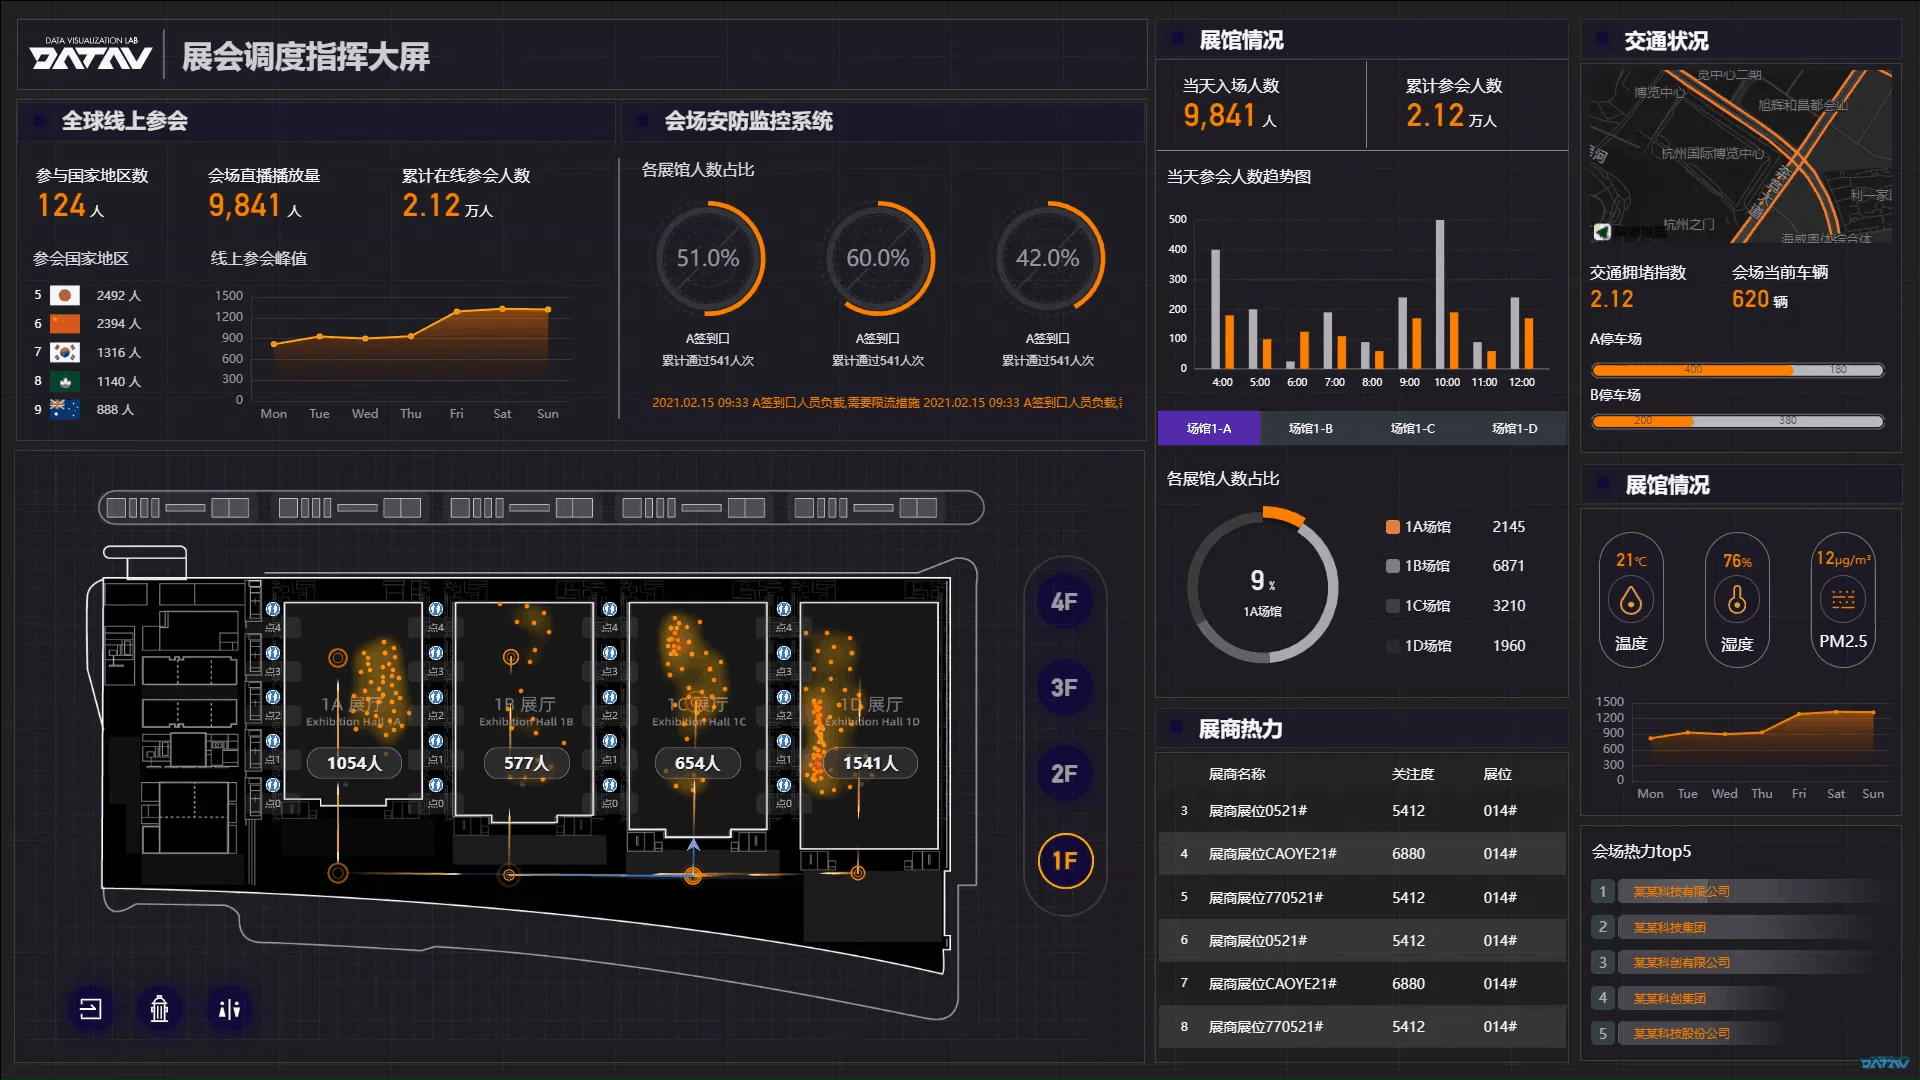
Control center dashboard
Integrate information display, monitoring, and analysis in a single visualization platform for complete and accurate operational insights.
Is this page helpful?