This article describes the donut layer of the chart style and the meaning of each configuration items.
Chart Style
The donut layer is a sub-component of the 3D earth and supports independent style configurations, including the radius, size color, and dialog box configuration of the donut. 
Settings Panel
- Search for Configurations: In the right-side panel of Canvas Editor, click the Settings tab, and click Search for Configurations in the upper-right corner. Enter the required configuration item in the search box, and click the search icon to quickly locate the configuration item. Fuzzy match is supported. For more information, see Search for asset configurations.
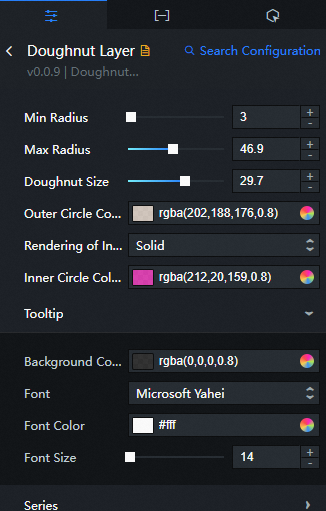
Minimum Radius: the inner radius of the doughnut layer.
Maximum Radius: the value of the outer radius of the doughnut layer.
Donut Size: The size of the donut layer.
Outer Ring Color: the color of the outer ring of the donut layer.
Inner Render Mode: the color rendering mode of the inner circle of the donut layer, including Monochrome and Gradient.
Start Color and End Color: the start color and end color of the doughnut. This configuration items is displayed only when you select Gradient for Inner Render Mode.
Inner Color: the color of the inner circle of the doughnut layer. This configuration items is displayed only when Inner Render Mode is set to Monochrome.
dialog box Configuration: The style of the dialog box that appears when you move over or click a donut on a preview or publish page.
Parameter
Description
Background Color
The background color of the dialog box.
Font
The font style of the text in the dialog box.
The color of the font.
dialog box the color of the font.
Size
dialog box the size of the font.
Series: Click the
 or
or  icon to add or delete a scatter series. Click the
  or
or  icon to configure the arrangement style of multiple scatter series. Click the
  icon to copy the selected series configurations and add a series with the same configurations.
 Parameter
Description
Key Name
The field name of the scatter class, which matches the corresponding series field in the donut field in the data panel.
Color
The color of this scatter class.
Data Panel
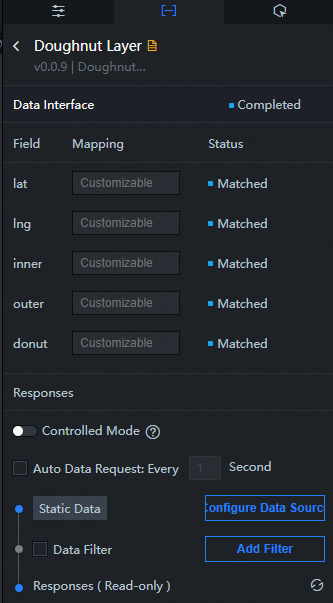
Configuration field description
Parameter | Description |
| The longitude of the center point of the donut. |
| The latitude of the donut's center point. |
| The value of the donut's inner circle. |
| The value of the donut's outer circle. |
| The data of the ring chart. The data field matches the field name in the Series Configuration section. |
| Parameter | Description |
| Controlled Mode | If you turn on the switch, data is not requested when a widget is initialized. Data requests are triggered only based on callback IDs or the method configured in Blueprint Editor. If you turn off the switch, data requests are automatically triggered. By default, the switch is turned off. |
| Auto Data Request | After you select the Auto Data Request check box, you can enable dynamic polling, and manually specify the polling interval. If you do not select this check box, data is not automatically requested. You must manually refresh the page to request data or use Blueprint Editor or callback ID events to trigger data requests. |
| Data Source | In the right-side panel of Canvas Editor, click the Data tab. Click Set next to Static Data. In the Configure Datasource panel, select a data source from the Data Source Type drop-down list. Enter code for data query in the code editor, click Preview Data Response to preview the response of the data source, and then view the response. For more information, see Configure asset data. |
| Data Filter | If you select the Data Filter check box, you can convert the data structure, filter data, and perform simple calculations. If you click the plus sign (+) next to Add Filter, you can configure the script for the data filter in the editor that appears. For more information, see Use the data filter. |
| Data Response Result | The response to a data request. If the data source changes, you can click the |
Interaction Panel 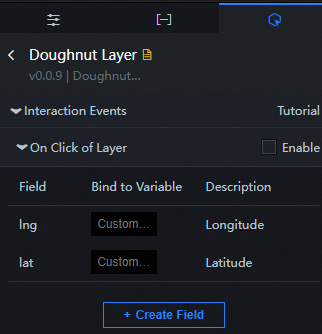
Select the Enable check box to enable interactions between widgets. When a donut is clicked, a data request is triggered, a callback value is thrown, and the data of different donuts is dynamically loaded. By default, the lng and lat values in the data are returned. For more information, see How do I configure the callback ID of a card flip widget.
Configure interactions in Blueprint Editor
In Canvas Editor, click the
 icon next to Donut Layer in the 3D Earth widget.
 Click the
 icon in the upper-left corner.
 In Blueprint Editor, click the Donut Layer component in the Import Nodes pane. You can view the configuration parameters of the donut layer on the canvas, as shown in the following figure.
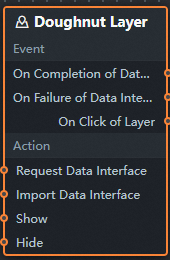
Event
Event
Description
When the data interface request is completed
The event is triggered with the processed JSON data after a data interface request is responded and processed by a filter. For more information about specific data examples, see the Data Response Result section of the Data tab in the right-side configuration panel of the canvas editor.
When a data interface request fails
The event that is returned when a data interface request fails (the request may be due to network problems or interface errors) and is processed by the filter. The event also throws the processed JSON data. For more information about specific data examples, see the Data Response Result section of the Data tab in the right-side configuration panel of the canvas editor.
Donut is triggered by clicking
An event that fires when a donut is clicked, while throwing the corresponding data item for that donut.
Policy Action
Policy Action
Description
Request Data Interface
This action is performed to request the server data again. The data sent by an upstream data processing node or layer node is used as a parameter. For example, if the doughnut layer configures the API data source as
https://api.testand the data passed to the request data interface as{ id: '1'}, the final request interface ishttps://api.test?id=1.Import data
After data of a widget is processed in accordance with its drawing format, the widget is imported for redrawing. You do not need to request server data again. For more information about specific data examples, see the Data Response Result section of the Data tab in the right-side configuration panel of the canvas editor.
Display Widget
A widget is shown without the need to specify parameters.
Hide components
A widget is hidden without the need to specify parameters.