Common questions and solutions for widget configuration items.
What is the relationship between data series and configuration item series?
Data series
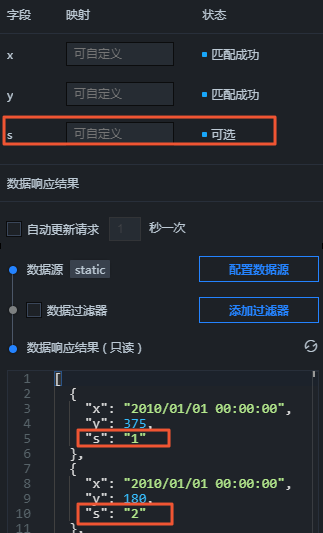
Many basic 2D widgets such as line charts and column charts support multiple data series. To display them, configure the s field on the Data
Configuration item series
For widgets that support multiple series, such as line charts and column charts, the Configuration tab usually contains a Data Series configuration item.
This item defines a style array that the widget cycles through to render each data series. In the following figure, two series are defined. The widget applies the styles from ['Series 1','Series 2'] to sequentially render the s field in the data.
Common mistakes
The Series Name in the configuration items is the name of the style. This name is also used in the chart legend. If you leave this field empty, the value of the s field from the corresponding data series is used.Figure 1. Series name is not emptyFigure 2. Series name is empty
The series in the configuration items are not mapped to data series by name. Instead, styles are applied sequentially based on the series order in the data.
For example, if the configuration item series is [Series 1, Series 2, Series 3], the mapping to the data is [{s1: Series 1 style}, {s2: Series 2 style}, {s3: Series 3 style}, {s4: Series 1 style}, and {s5: Series 2 style}].
Note In this example, s1, s2, s3, s4, and s5 correspond to the order in which the s field appears in the data.
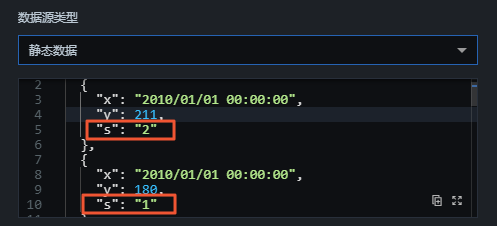
If you have fixed style requirements for data series, such as s2 must be red and s1 must be blue, sort the data in the filter or data source after you configure the series styles.
For example, if the configuration item series is [Red, Blue], you can change the data order to [{"s":"2"},{"s":"1"}].
How do I configure interactive features?
The interactive feature is currently in a testing phase. For more information, see Chart filter interaction.
How do I use URL parameters to control the displayed data?
You can represent variables in SQL by using :dot-id. For example: select car_speed, car_color, car_name from table where car_ID = :dot-id.
Pass parameters to these variables through the URL to control the displayed data. For example: http://datav.aliyun.com/...?spm=xxxxx&dot_id=10102.
Why does the widget not re-render after the callback ID changes?
Test the widget callback ID on the editing page.
Cause: Widgets on the editing page cannot receive callback values from other widgets.
Solution: Pass default values in the URL to test the widget on the editing page.
For example, xxxx/admin/screen/123456?value=123&name=12345
Test the widget callback ID on the preview or publish page.
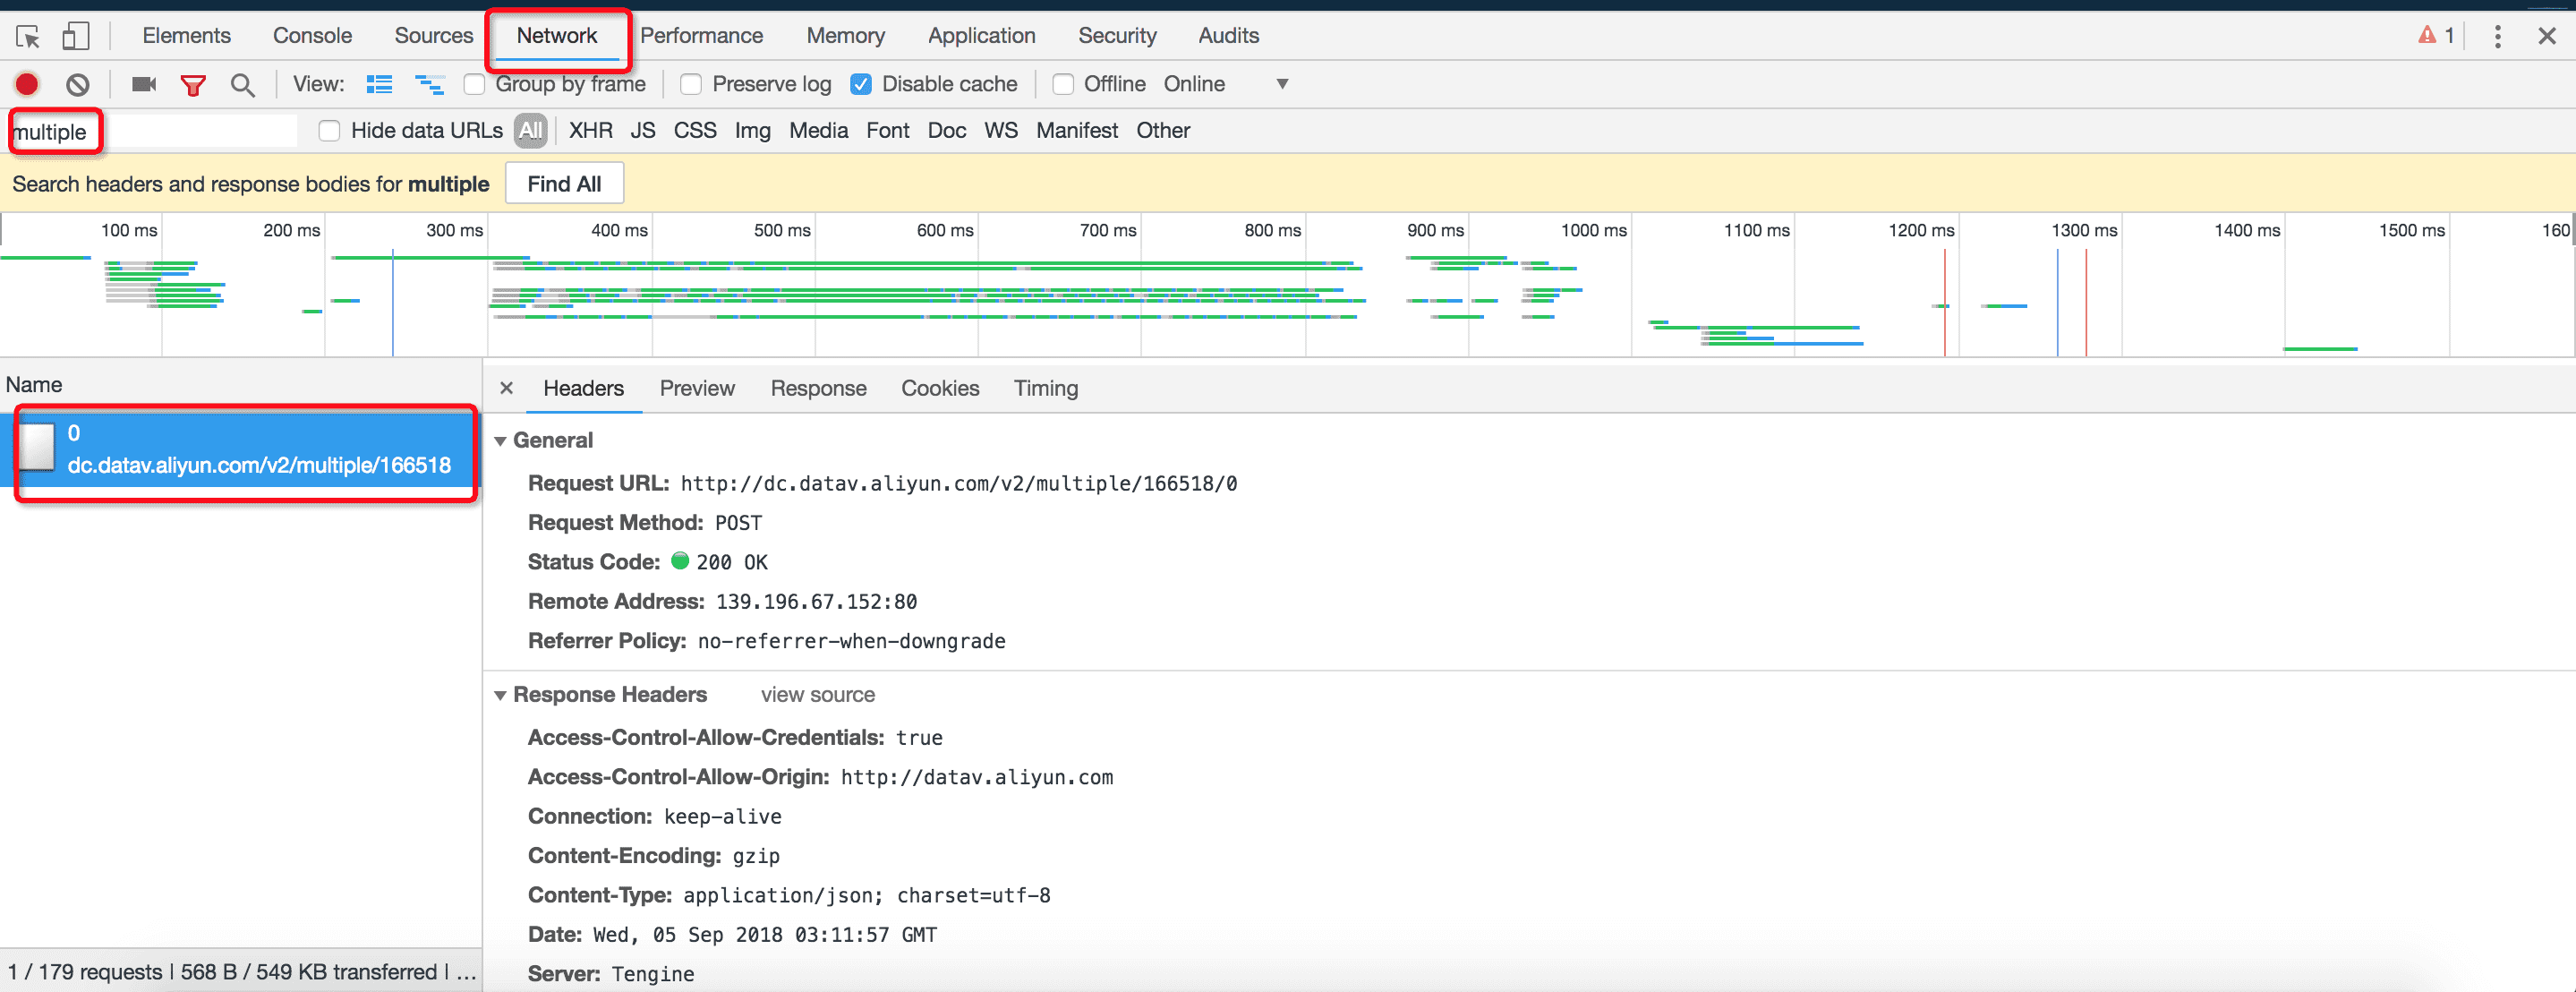
On the preview or publish page, open the Network tab in your browser's developer console. The keyboard shortcut is F12 for Windows or Option+Command+I for macOS. Search for multiple and check whether the widget sends a request after the callback changes.
If the search returns no results, the widget did not send a request. Check the callback configuration.
If the search returns results, the widget sent a request. Check whether the request carries the correct callback parameters and returned a status of 200. The Status should be 200, as shown in the following figure.
If the request does not return a normal response, check the data source connection.
If you use the Ticker Board widget and the data is returned correctly but the widget does not re-render, check whether Data Jitter Correction is selected in the widget's configuration items.
When this option is selected, the widget does not re-render when the incoming data value is less than the current data value.
If your data fluctuates and requires real-time rendering of the current data, do not select this option.