For real-time instances running on the open-source Flink engine, Dataphin provides running analysis to help you analyze and refresh instance information and monitor key metrics such as failure count, backpressure status, data output per sink, and checkpoint failures.
Permissions
-
To view the running analysis of a project, you must have project space permissions.
-
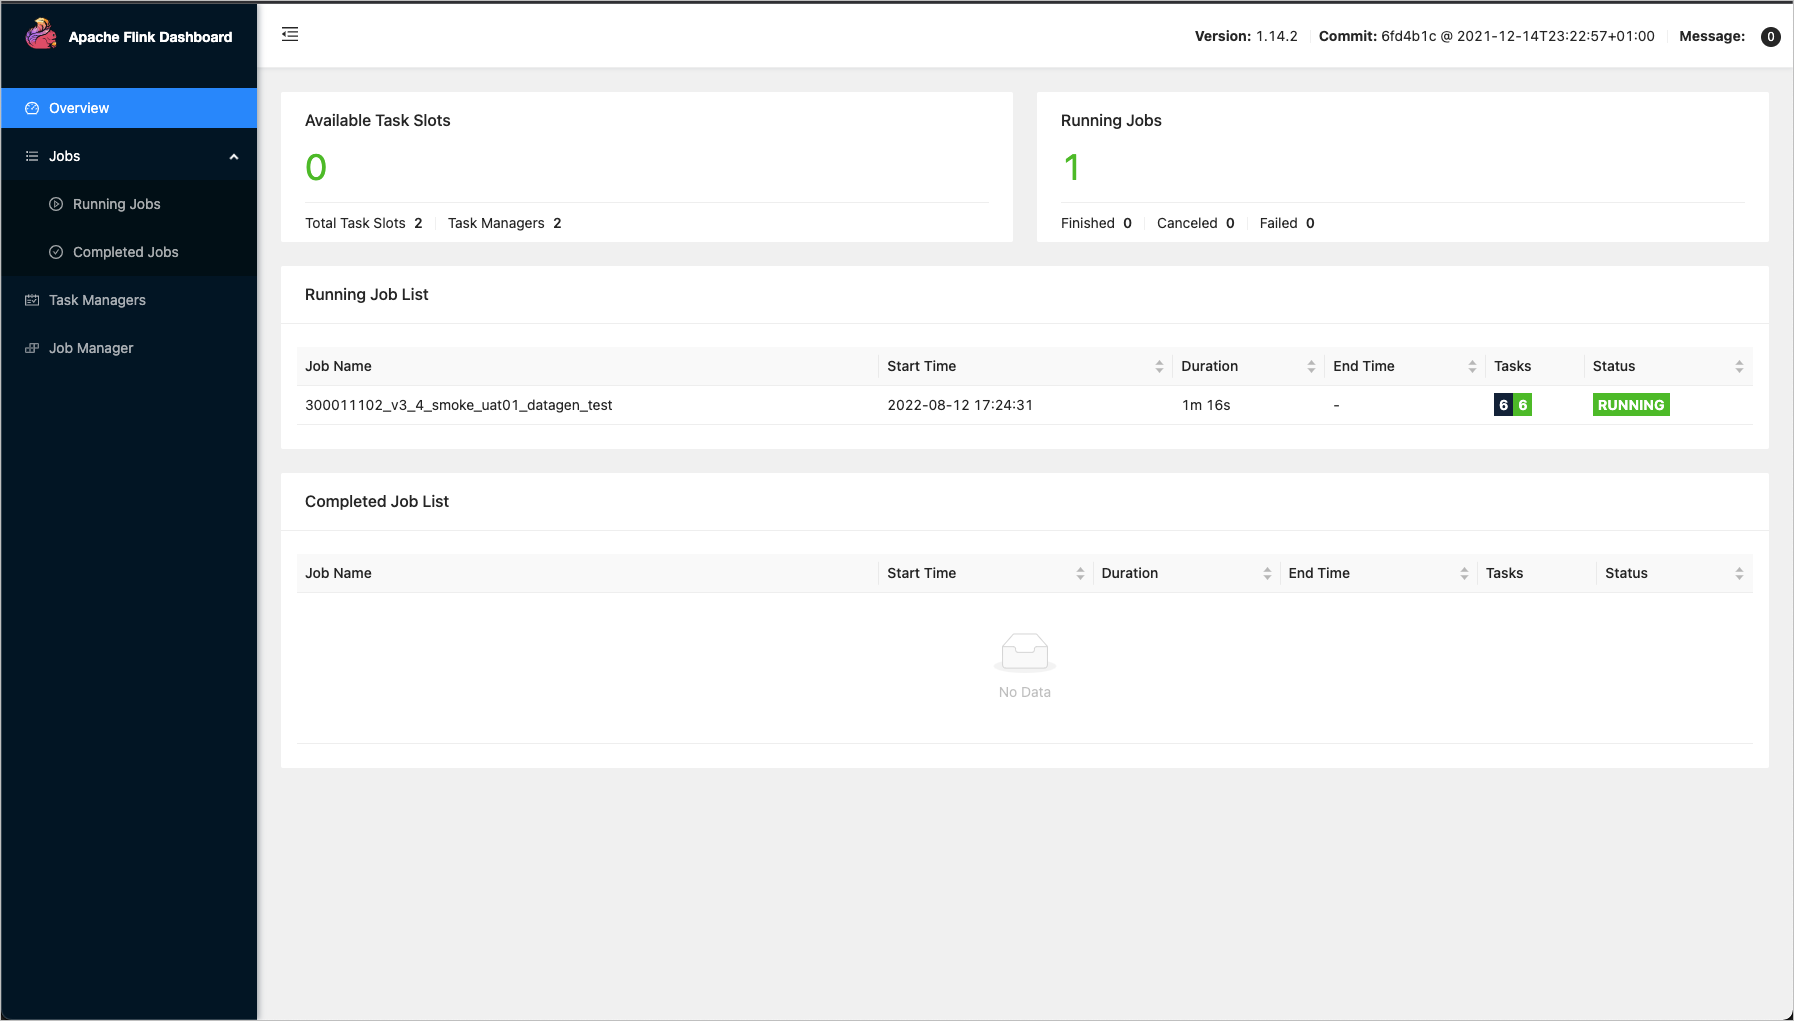
To access the Apache Flink Dashboard, you must provide a username and password. The following roles can view the username and password hints: Super Administrator, System Administrator, task owner, and project O&M engineer.
Access running analysis
-
In the top navigation bar of the Dataphin homepage, choose Development > Task O&M.
-
In the left-side navigation pane, choose instance O&M > real-time instance. On the real-time instance page, click the
 icon in the Actions column for the target instance.
View running analysis
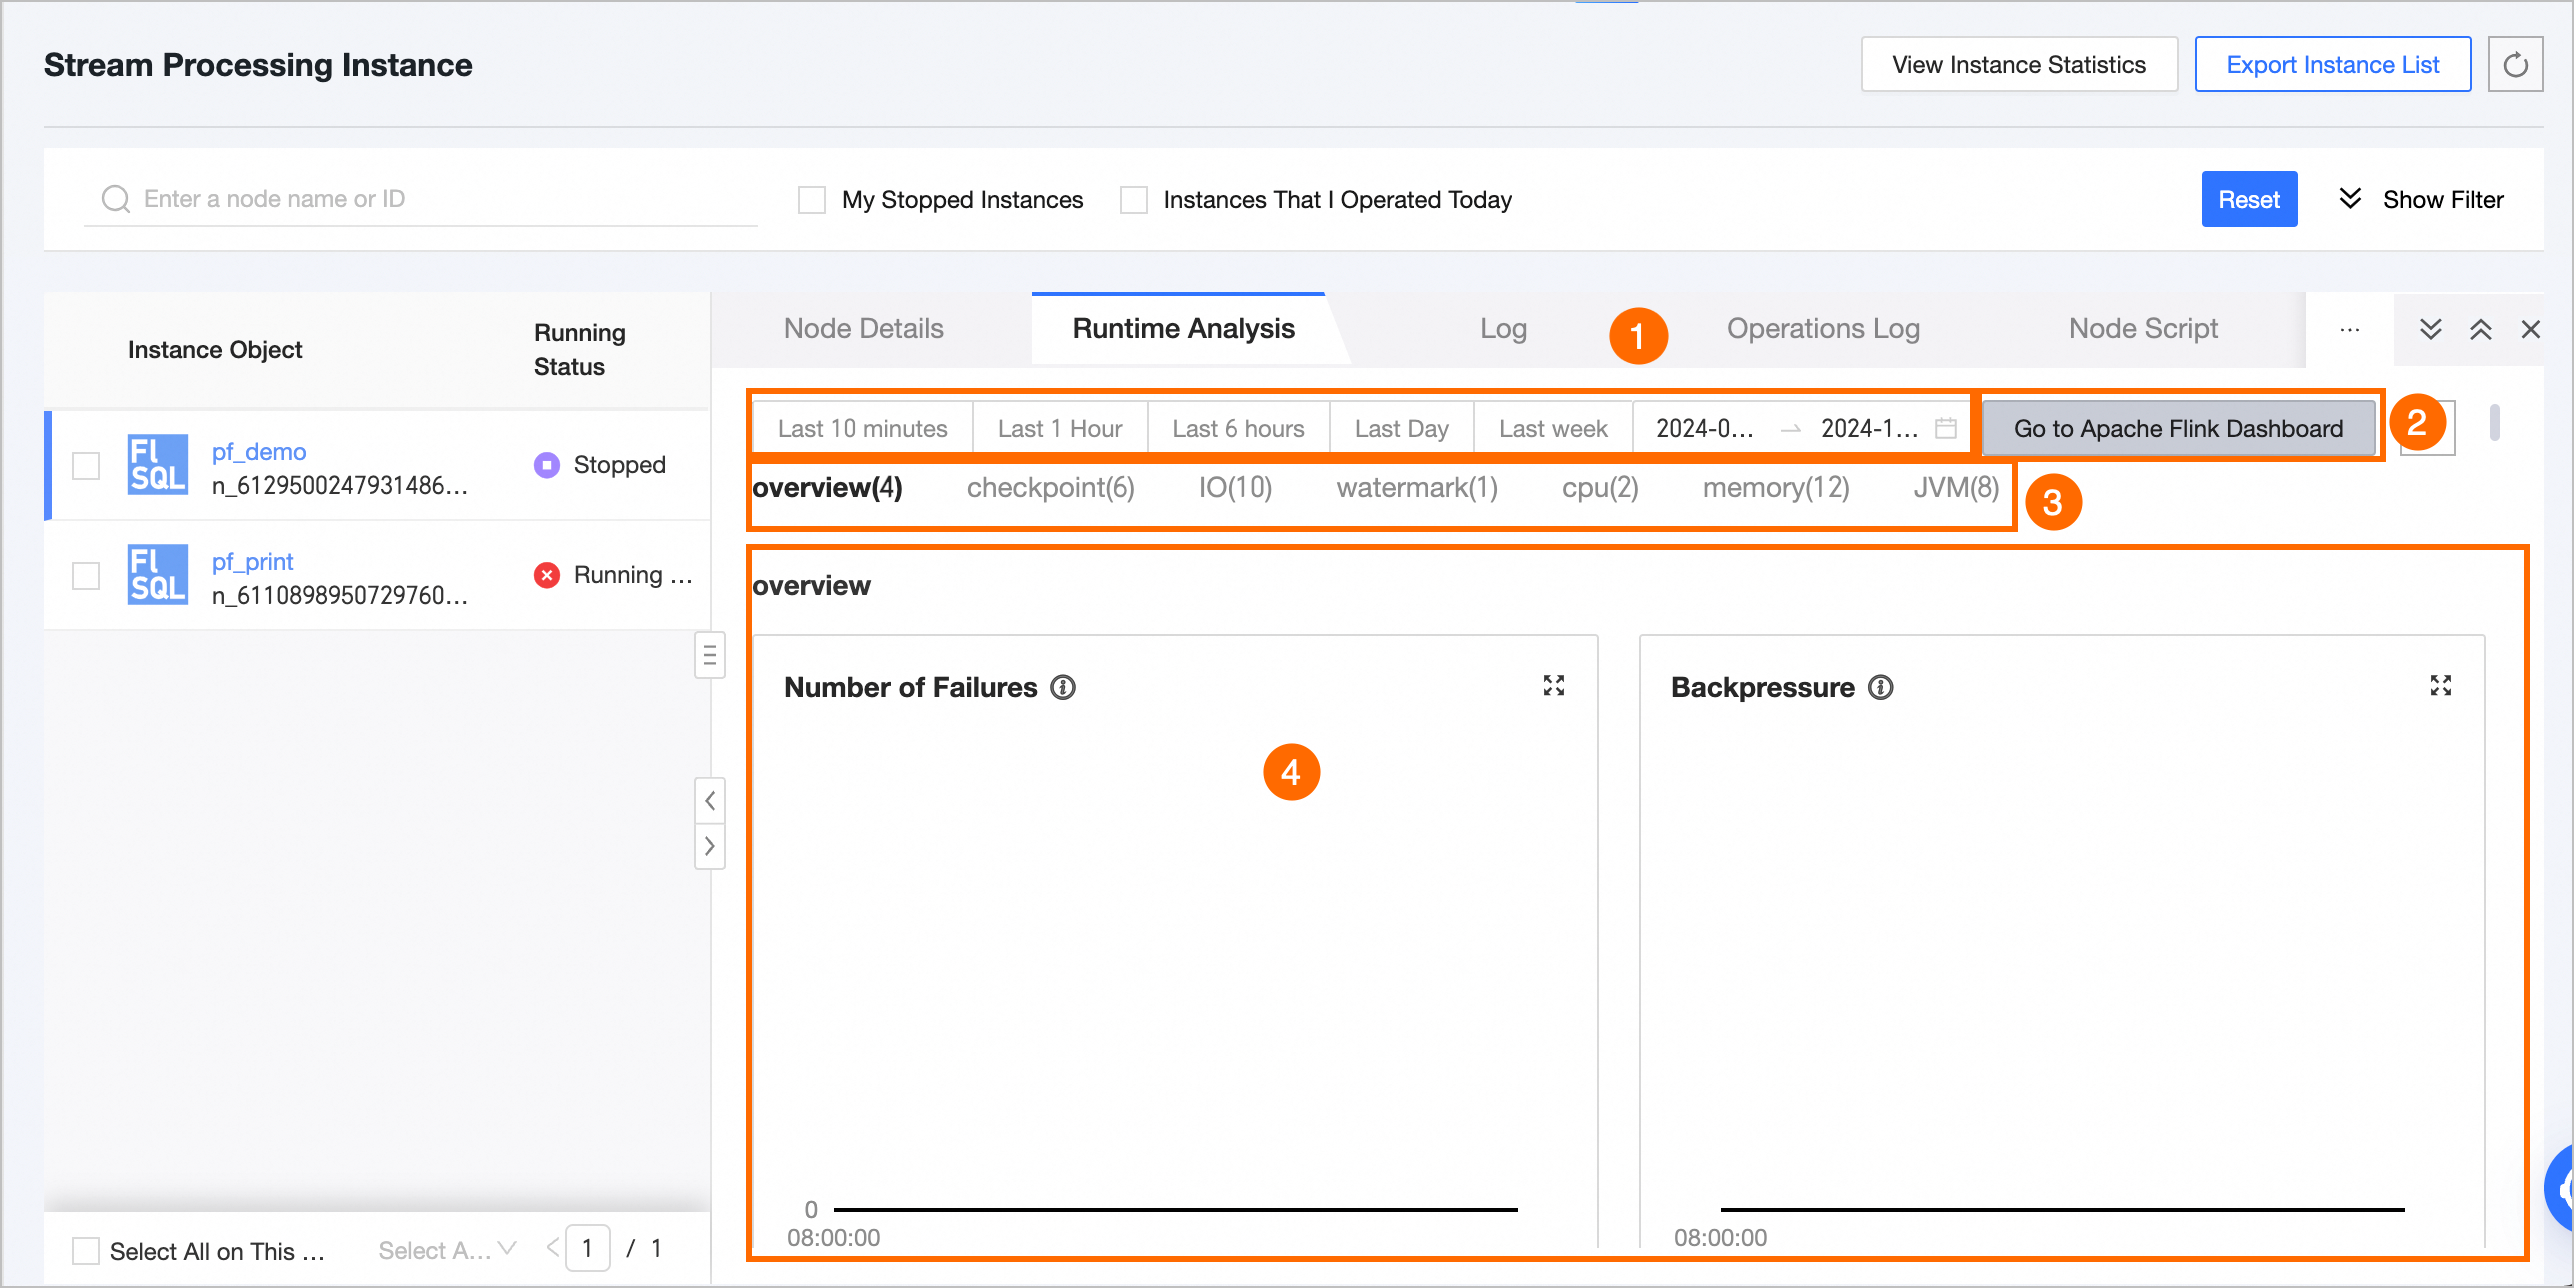
The running analysis page displays the following metrics:
|
Feature |
Description |
|
① Time range selector |
|
|
② Go to Apache Flink Dashboard and Refresh |
|
|
③ Real-time monitoring metrics |
For Flink SQL or Flink DataStream tasks, you can view the following metrics: overview, checkpoint, IO, watermark, CPU, memory, and JVM. For details about each metric, see Real-time monitoring metrics. |
|
④ Metric data statistics |
Displays the data for each metric within the selected time range. |
Metric aggregation rules
-
If the selected time range is 6 hours or less, all data points collected every minute are displayed.
-
If the selected time range is greater than 6 hours and less than or equal to 24 hours, data points are displayed every 5 minutes, starting from the top of the hour. Each data point aggregates data from the preceding 5 minutes.
-
If the selected time range is greater than 24 hours, data points are displayed every 10 minutes, starting from the top of the hour. Each data point aggregates data from the preceding 10 minutes.
Real-time monitoring metrics
Overview
|
Metric |
Description |
Unit |
|
Number of failures |
The number of times the task failed within the selected time range. |
Count |
|
Backpressure status |
Whether backpressure exists for the task within the selected time range. Backpressure occurs when an upstream task produces data faster than a downstream task can consume it. |
Yes or No |
|
Data output per sink |
The data output rate for each sink, in transactions per second (TPS). |
Count/s |
|
Number of failed checkpoints |
The number of failed checkpoint operations for the task within the selected time range. |
Count |
Checkpoint
|
Metric |
Sub-metric |
Description |
Unit |
|
Number of checkpoints (Num of Checkpoints) |
Total number of checkpoints (totalNumberOfCheckpoints) |
The total number of checkpoints for the task within the selected time range. |
Count |
|
Total number of failed checkpoints (numberOfFailedCheckpoints) |
The number of failed checkpoints for the task within the selected time range. |
Count |
|
|
Total number of completed checkpoints (numberOfCompletedCheckpoints) |
The number of completed checkpoints for the task within the selected time range. |
Count |
|
|
Total number of in-progress checkpoints (numberOfInProgressCheckpoints) |
The number of in-progress checkpoints for the task within the selected time range. |
Count |
|
|
Last checkpoint duration |
Last checkpoint duration (lastCheckpointDuration) |
The duration of the last checkpoint for the task. A large state size, temporary network issues, unaligned barriers, or data backpressure can cause a long checkpoint duration or a timeout. |
ms |
|
Last checkpoint size (lastCheckpointSize) |
Last checkpoint size (lastCheckpointSize) |
The size of the last checkpoint for the task. Use this metric to analyze checkpoint performance when bottlenecks occur. |
byte |
IO
|
Metric group |
Description |
Metric |
Description |
Unit |
|
Total input bytes per second (numBytesInPerSecond) |
Use this metric group to monitor upstream data flow and job traffic performance. |
Bytes read locally per second (numBytesInLocalPerSecond) |
The number of bytes read locally per second. |
byte |
|
Bytes read remotely per second (numBytesInRemotePerSecond) |
The number of bytes read remotely per second. |
byte |
||
|
Bytes from local network buffers per second (numBuffersInLocalPerSecond) |
The number of bytes read from local network buffers per second. |
byte |
||
|
Bytes from remote network buffers per second (numBuffersInRemotePerSecond) |
The number of bytes read from remote network buffers per second. |
byte |
||
|
Total output bytes per second (numBytesOutPerSecond) |
Use this metric group to monitor upstream throughput and job traffic performance. |
Output bytes per second (numBytesOutPerSecond) |
The number of bytes output per second. |
byte |
|
Output buffer bytes per second (numBuffersOutPerSecond) |
The number of bytes output from network buffers per second. |
byte |
||
|
Records I/O per second per subtask (Task numRecordsI/OPerSecond) |
Use this metric to identify IO bottlenecks and assess their severity based on the rate. |
Records received per second (numRecordsInPerSecond) |
The number of records received per second. |
Count |
|
Records sent per second (numRecordsOutPerSecond) |
The number of records sent per second. |
Count |
||
|
Total records I/O per subtask (Task numRecordsI/O) |
Use this metric to identify IO bottlenecks in the job. |
Total records received (numRecordsIn) |
The total number of records received. |
Count |
|
Total records sent (numRecordsOut) |
The total number of records sent. |
Count |
Watermark
|
Metric |
Description |
Unit |
|
Task input watermark (Task InputWatermark) |
The timestamp of the latest watermark received by each task. This metric indicates data reception latency at the TM. |
ms |
CPU
|
Metric |
Description |
Unit |
|
JM CPU load (JM CPU Load) |
The CPU utilization of a single JM. A value consistently above 100% indicates high CPU load, which may cause sluggishness or long response times. |
Count |
|
TM CPU load (TM CPU Load) |
The CPU utilization of a single TM, reflecting Flink's consumption of CPU time slices. For a single-core CPU, 100% indicates full utilization; for a four-core CPU, 400% indicates full utilization. A value consistently above 100% indicates high CPU load. If the load is high but CPU utilization is low, excessive processes in an uninterruptible sleep state from frequent read/write operations may be the cause. |
Count |
Memory
|
Metric |
Sub-metric |
Description |
Unit |
|
JM heap memory (JM Heap Memory) |
Used (JM Heap Memory Used) |
The amount of used JM heap memory. |
byte |
|
Committed (JM Heap Memory Committed) |
The amount of committed JM heap memory. |
byte |
|
|
Max (JM Heap Memory Max) |
The maximum available JM heap memory. |
byte |
|
|
JM non-heap memory (JM NonHeap Memory) |
Used (JM NonHeap Memory Used) |
The amount of used JM non-heap memory. |
byte |
|
Committed (JM NonHeap Memory Committed) |
The amount of committed JM non-heap memory. |
byte |
|
|
Max (JM NonHeap Memory Max) |
The maximum available JM non-heap memory. |
byte |
|
|
TM heap memory (TM Heap Memory) |
Used (TM Heap Memory Used) |
The amount of used TM heap memory. |
byte |
|
Committed (TM Heap Memory Committed) |
The amount of committed TM heap memory. |
byte |
|
|
Max (TM Heap Memory Max) |
The maximum available TM heap memory. |
byte |
|
|
TM non-heap memory (TM NonHeap Memory) |
Used (TM NonHeap Memory Used) |
The amount of used TM non-heap memory. |
byte |
|
Committed (TM NonHeap Memory Committed) |
The amount of committed TM non-heap memory. |
byte |
|
|
Max (TM NonHeap Memory Max) |
The maximum available TM non-heap memory. |
byte |
JVM
|
Metric |
Description |
Unit |
|
Total active JM threads (JM Threads) |
The total number of active JM threads. An excessive thread count can consume too much memory and reduce job stability. |
Count |
|
Total active TM threads (TM Threads) |
The total number of active TM threads, aggregated by TM. Each TM is represented by a separate line on the graph. |
Count |
|
JM young generation GC time (JM GC Time) |
The runtime of the young generation garbage collector for the JM. Long GC pauses can consume significant memory and affect job performance. Use this metric to diagnose job-level failures. |
ms |
|
TM young generation GC time (TM GC Time) |
The runtime of the young generation garbage collector for the TM. Long GC pauses can consume significant memory and affect job performance. Use this metric to diagnose job-level failures. |
ms |
|
JM young generation GC count (JM GC Count) |
The number of times the young generation garbage collector ran for the JM. Frequent GC events can consume significant memory and degrade job performance. Use this metric to diagnose job-level failures. |
Count |
|
TM young generation GC count (TM GC Count) |
The number of times the young generation garbage collector ran for the TM. Frequent GC events can consume significant memory and degrade job performance. Use this metric to diagnose task-level failures. |
Count |
|
TM classes loaded (TM ClassLoader) |
The total number of classes loaded by the TM's JVM since startup. A high number of loaded or unloaded classes can consume excessive memory and degrade job performance. |
Count |
|
JM classes loaded (JM ClassLoader) |
The total number of classes loaded by the JM's JVM since startup. A high number of loaded or unloaded classes can consume excessive memory and degrade job performance. |
Count |