A baseline groups interdependent tasks or assets that receive priority cluster resources and alert-based protection to ensure timely data output. You can set commitment times for guaranteed objects and enforce a unified specification for data delivery. This topic covers how to view and manage baseline instances.
Prerequisites
The Artificial Intelligence for IT Operations value-added service is purchased and the Artificial Intelligence for IT Operations module is enabled for the current tenant.
Generation schedule
Baseline instances are generated nightly between 11 PM and midnight, after node instances are created.
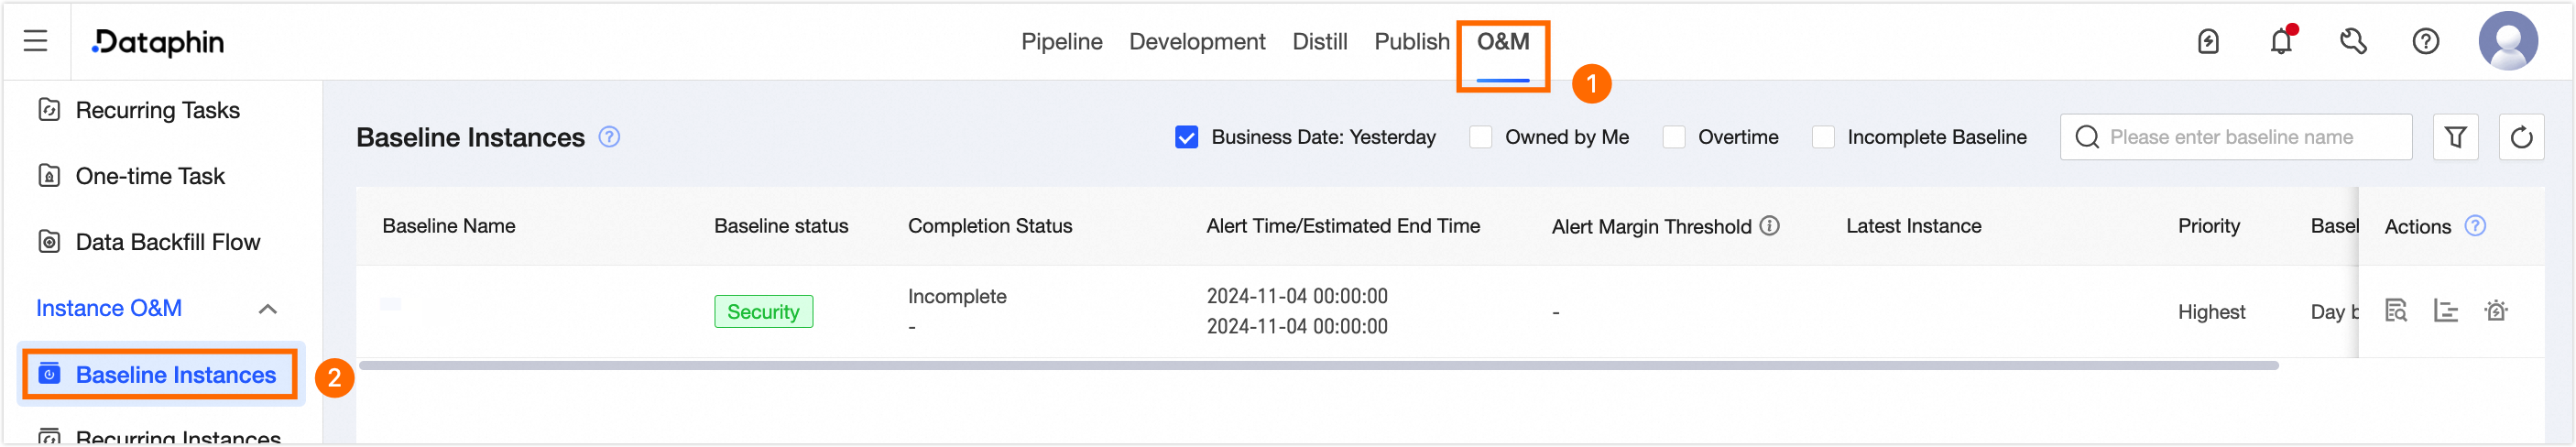
Access baseline instances
-
On the Dataphin homepage, click the Development tab in the top menu bar.
-
Follow the figure to open the Baseline Instances page.
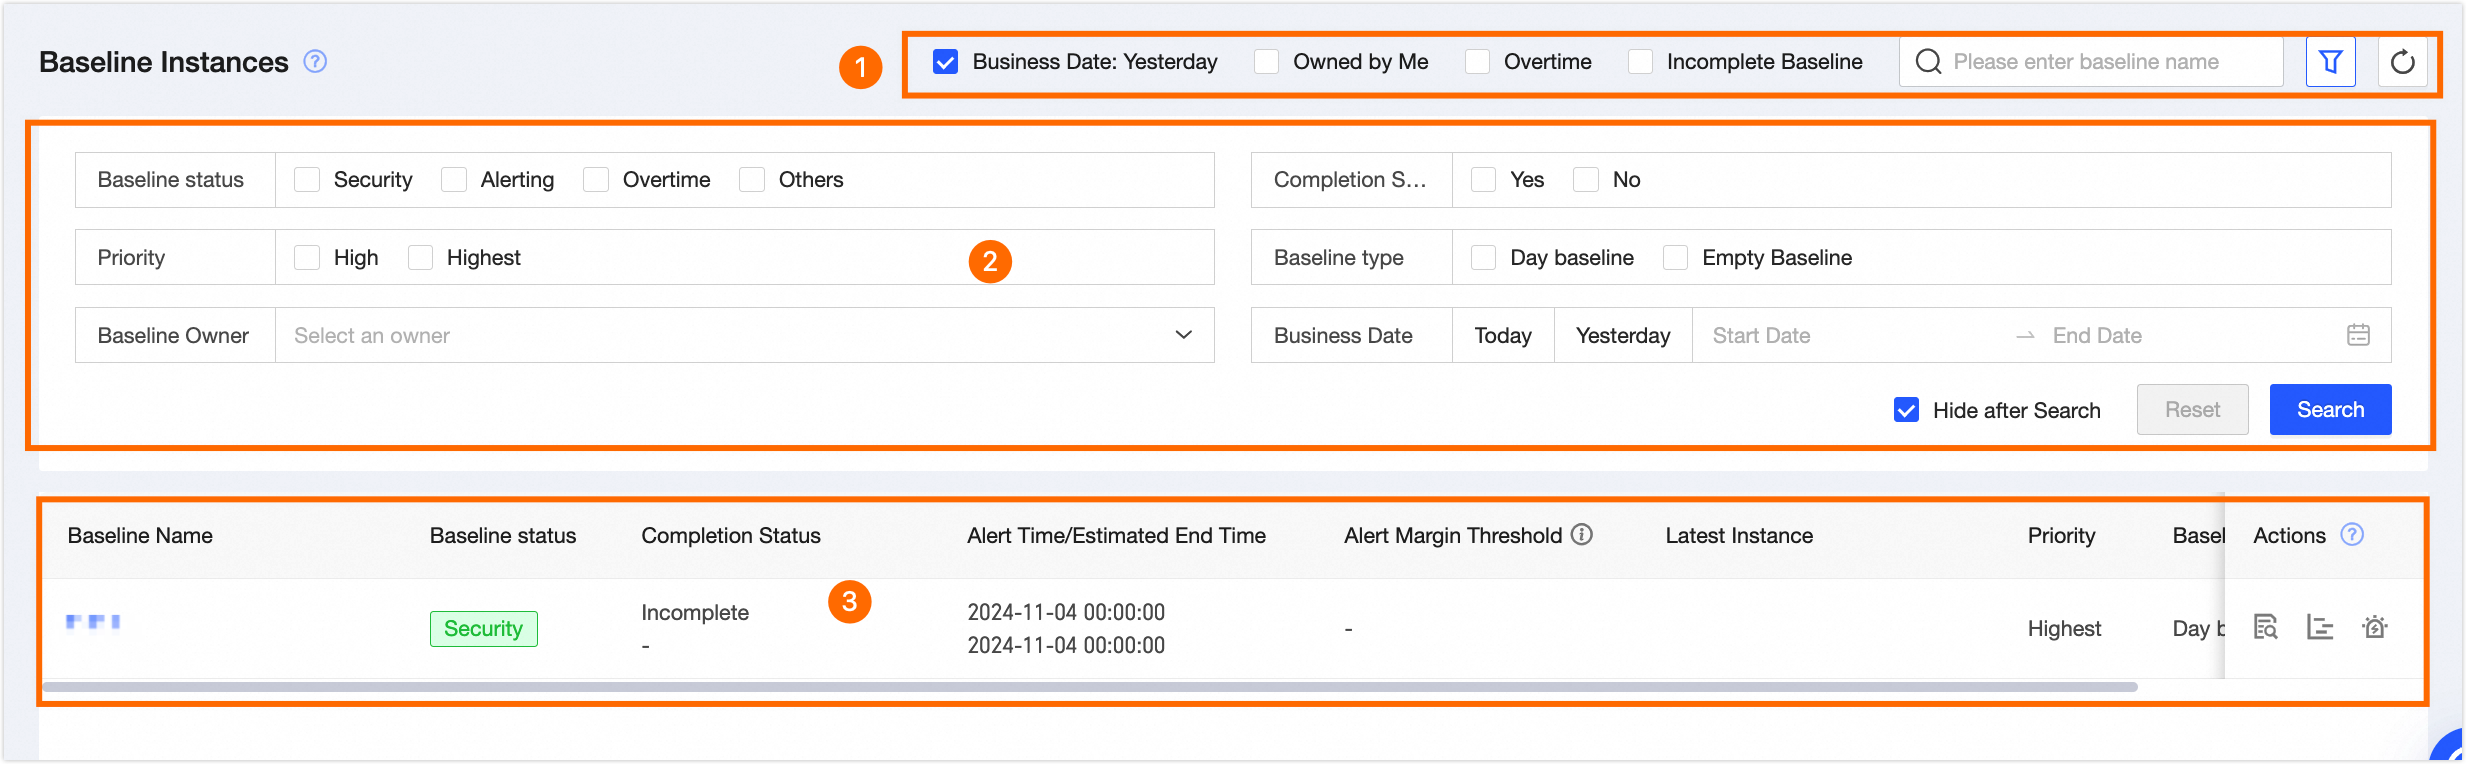
Page overview
The baseline instance page consists of the search and filter area, filter area, and baseline instance list. You can filter instances, refresh, view details and Gantt charts, and configure alerts.
|
Area |
Description |
|
①Search and filter area |
Search baseline instances by name or use quick filters: data timestamp, my owner, broken baseline, and incomplete baseline.
|
|
②Filter area |
Click
|
|
③Baseline instance list |
Displays baseline instance name, status, completion, alert/guarantee time, alert margin, latest instance, priority, type, owner, and available operations.
|
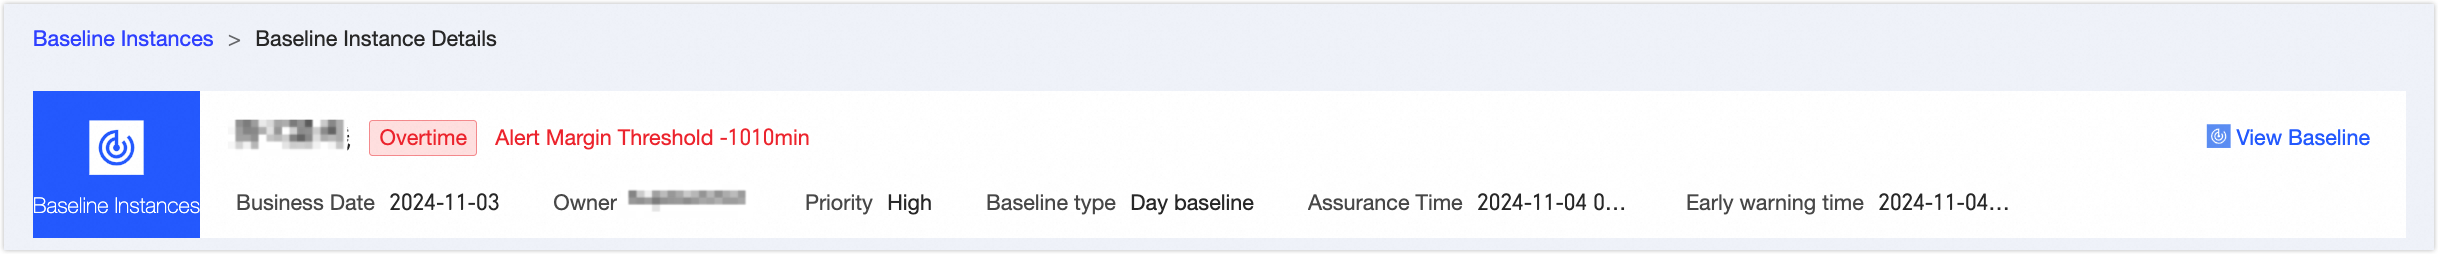
View baseline instance details
The baseline instance details page shows basic information, (estimated) latest instance, current key instance, key path, historical operation trends, and alert events.
|
Area |
Description |
|
Basic information |
Includes baseline name, owner, priority, baseline type, guarantee time, and alert time.
|
|
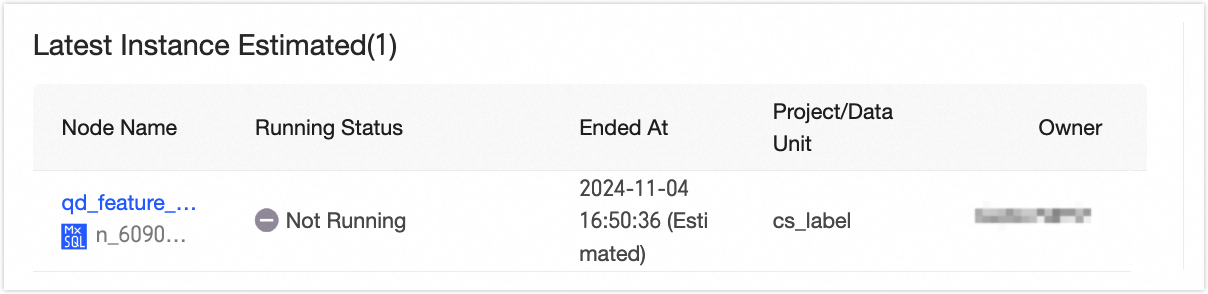
(Expected) latest instance |
The last node on the critical path. |
|
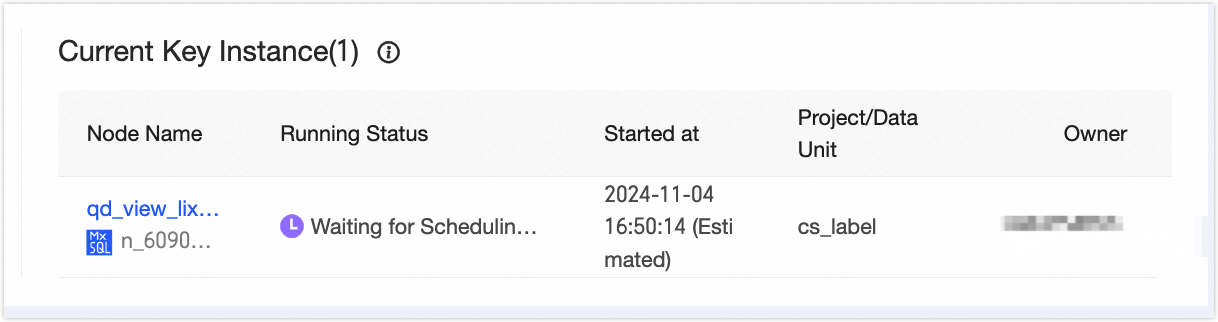
Current Critical Instance |
The highest instance on the critical path that has yet to run successfully. |
|
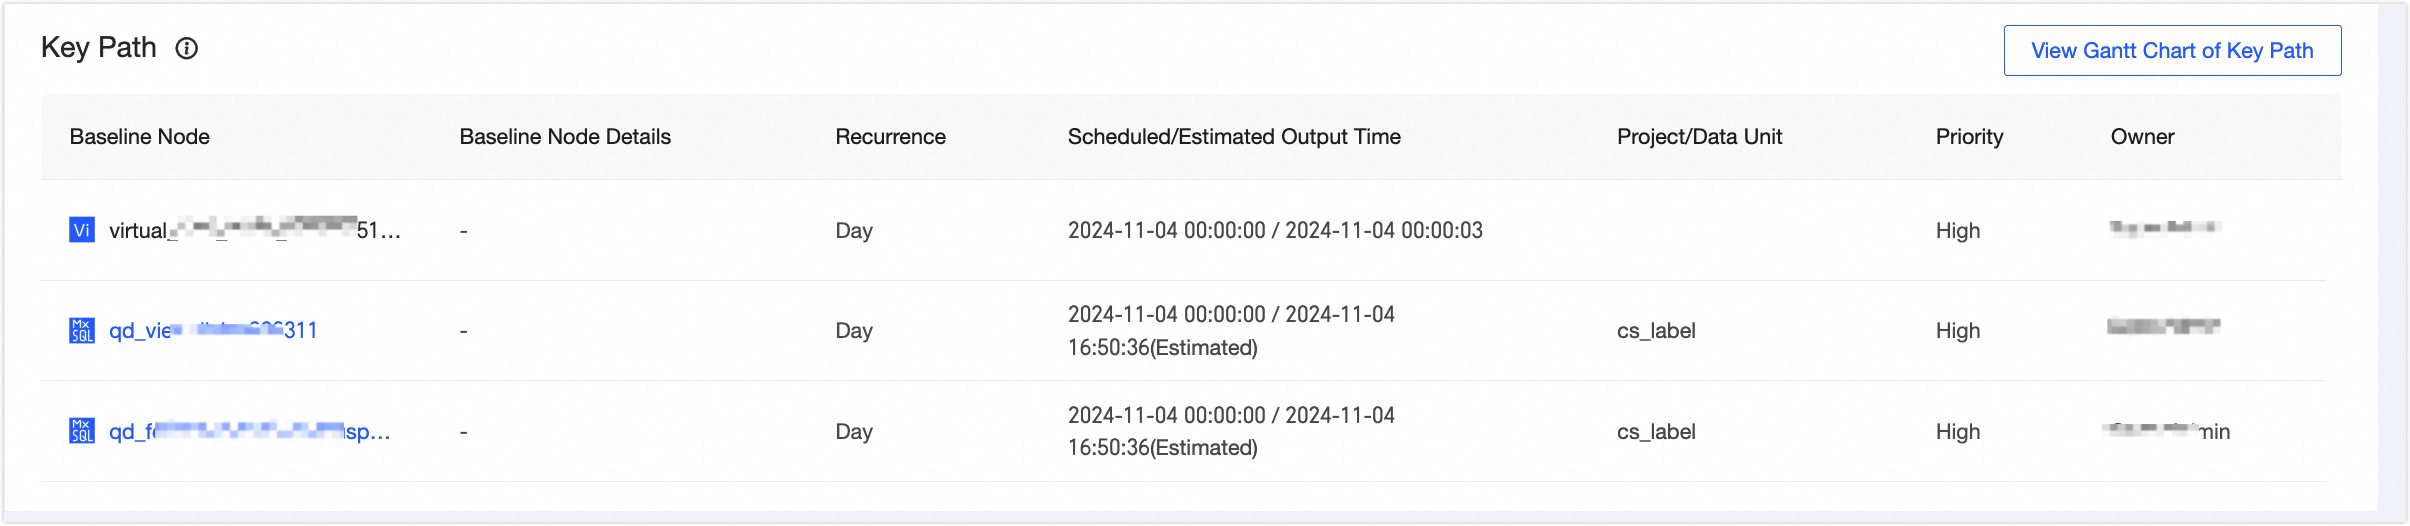
Critical path |
The longest path of guaranteed objects affecting the baseline. Shows the guarantee object name, details (logical table node), scheduled/expected output time, project/section, priority, and owner. You can single click to view the critical path Gantt chart to open the critical path Gantt chart. view critical path Gantt chart or . |
|
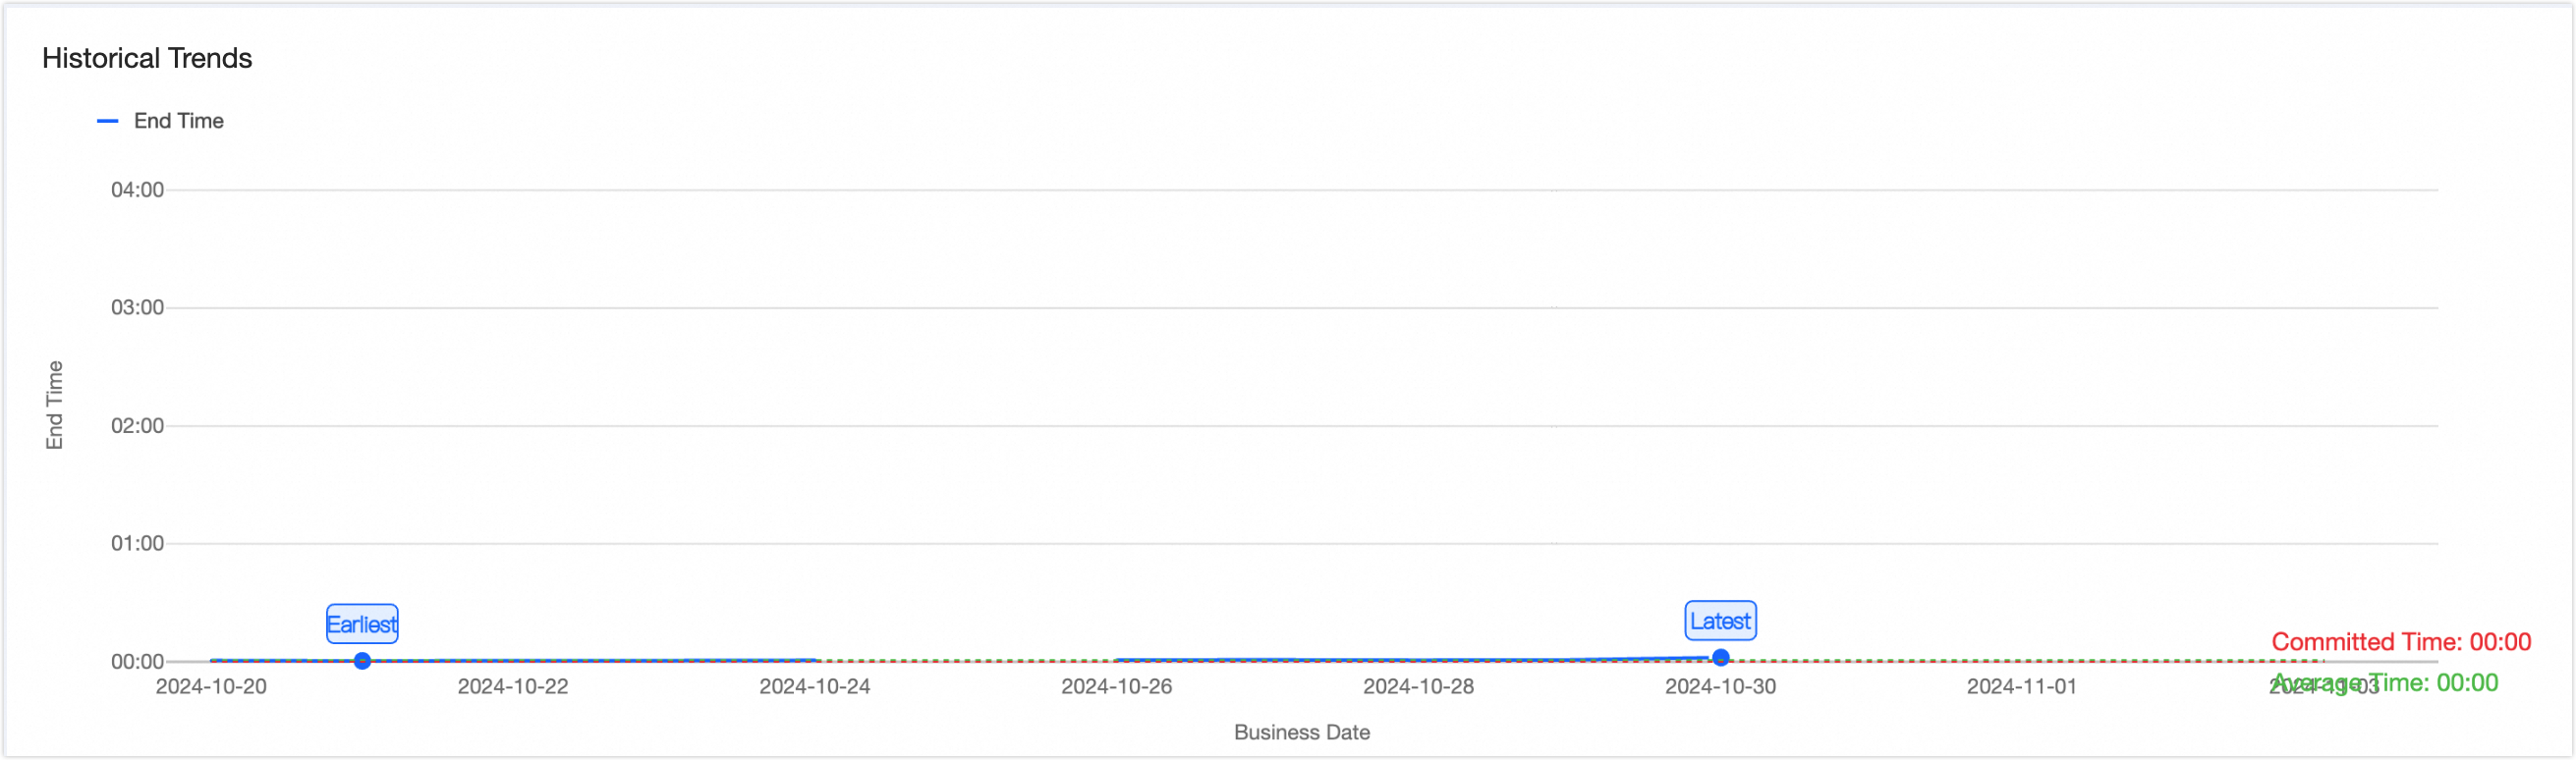
Historical running trends |
Historical running trend chart.
Note
|
|
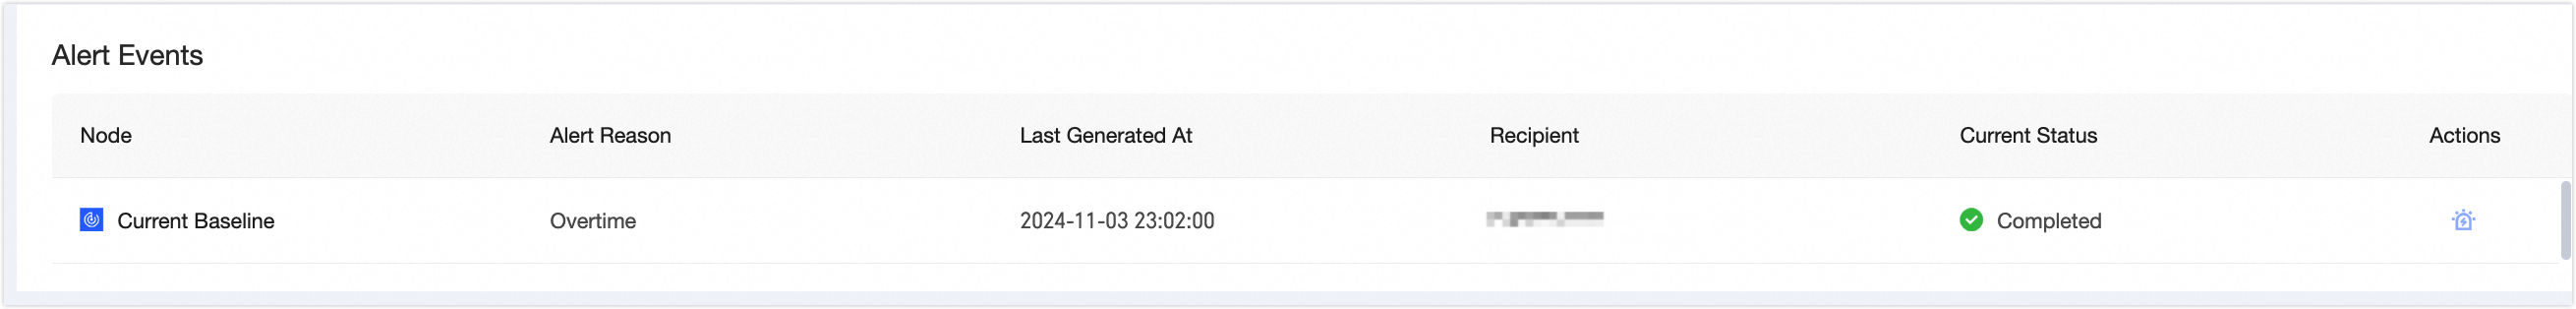
Alert events |
A log of alert events triggered by the baseline instance, including alert node, reason, latest alert time, recipient, status, and actions.
|
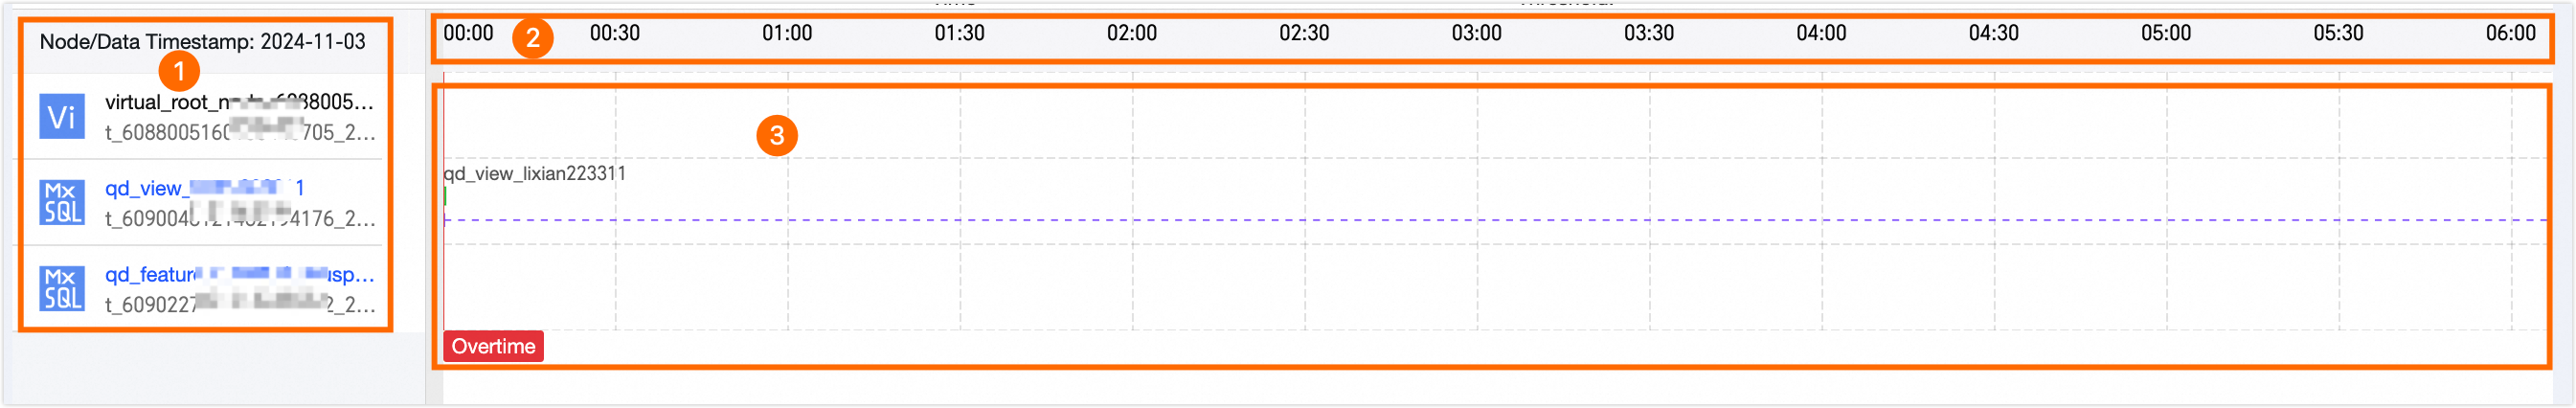
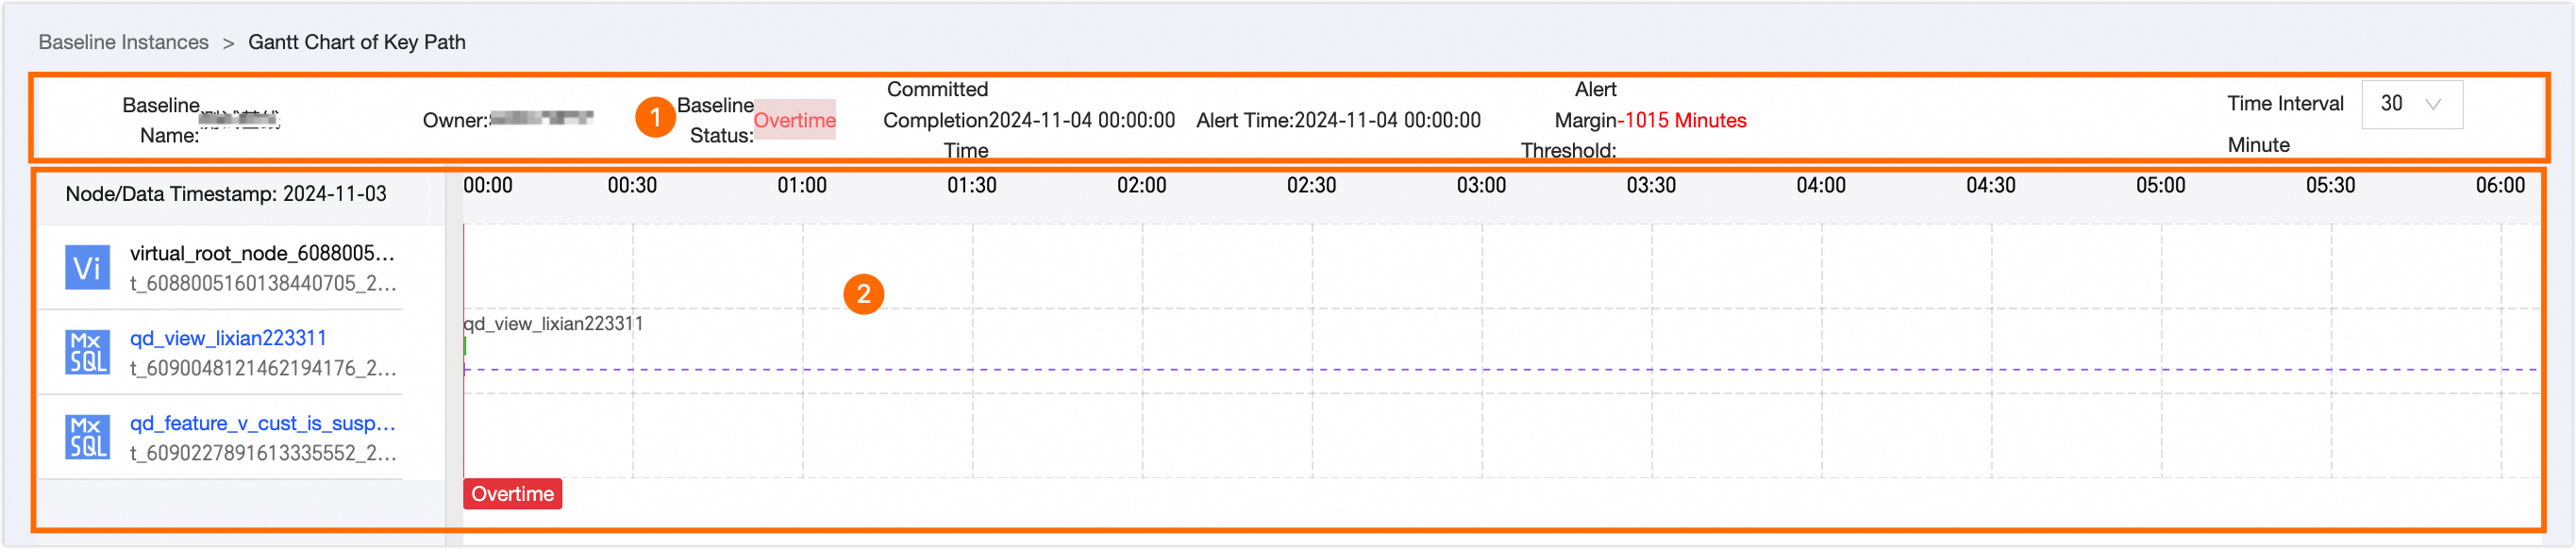
View critical path Gantt chart
The critical path is the task sequence that determines the minimum completion time for a baseline instance. The Gantt chart shows task status and duration within the baseline instance.
|
Area |
Description |
|
①Basic information |
Includes baseline name, owner, baseline status, commitment time, alert time, and slack. You can set the time interval to 10 minutes or 30 minutes. Note
Use a 10-minute interval for shorter runtimes. |
|
②Critical path Gantt chart |
The chart includes the critical path node list and the progress time and status of each node within the current baseline instance.
|