The Alert Events page displays alert events from the Batch Processing, Real-time Computing, Stream Pipeline, Baseline Monitoring, Data Quality, and Data Service modules. This topic describes how to view and handle alert events.
View alert events
On the Dataphin page, click the Alert
 icon in the upper-right corner to open the Alert Center page.
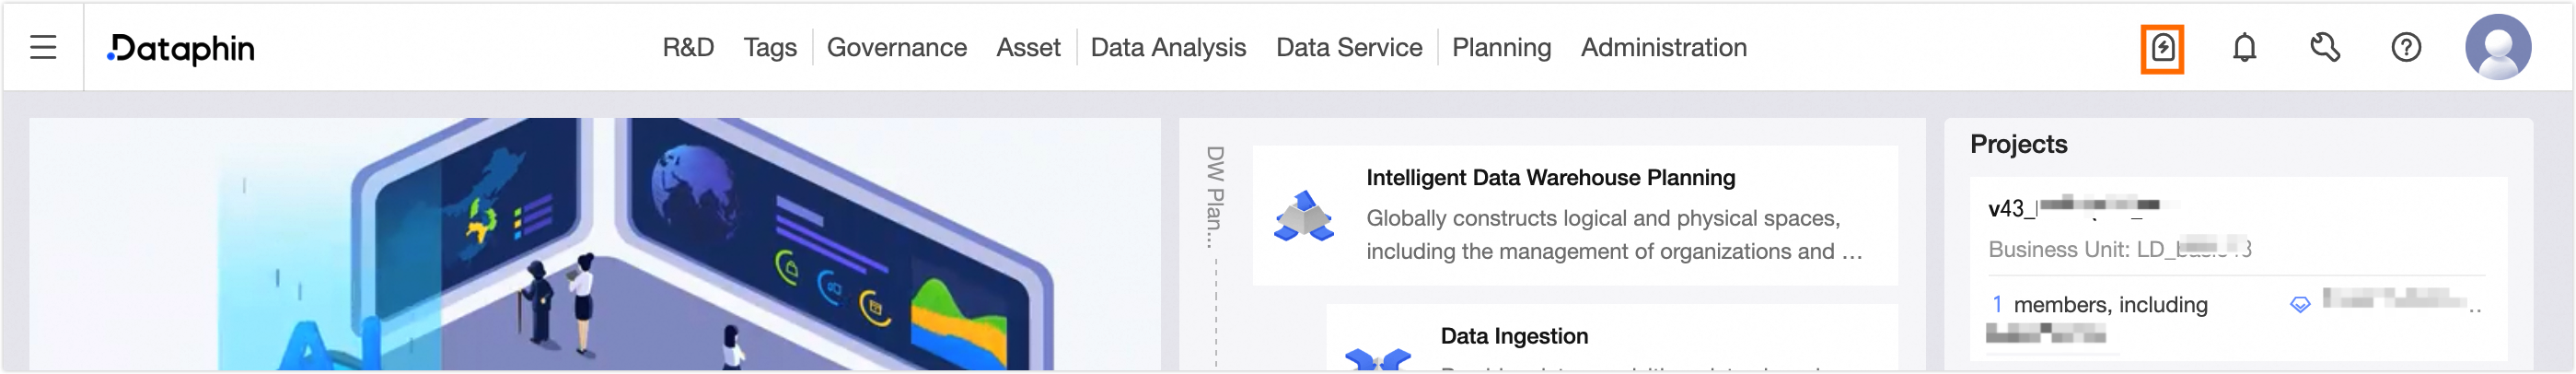
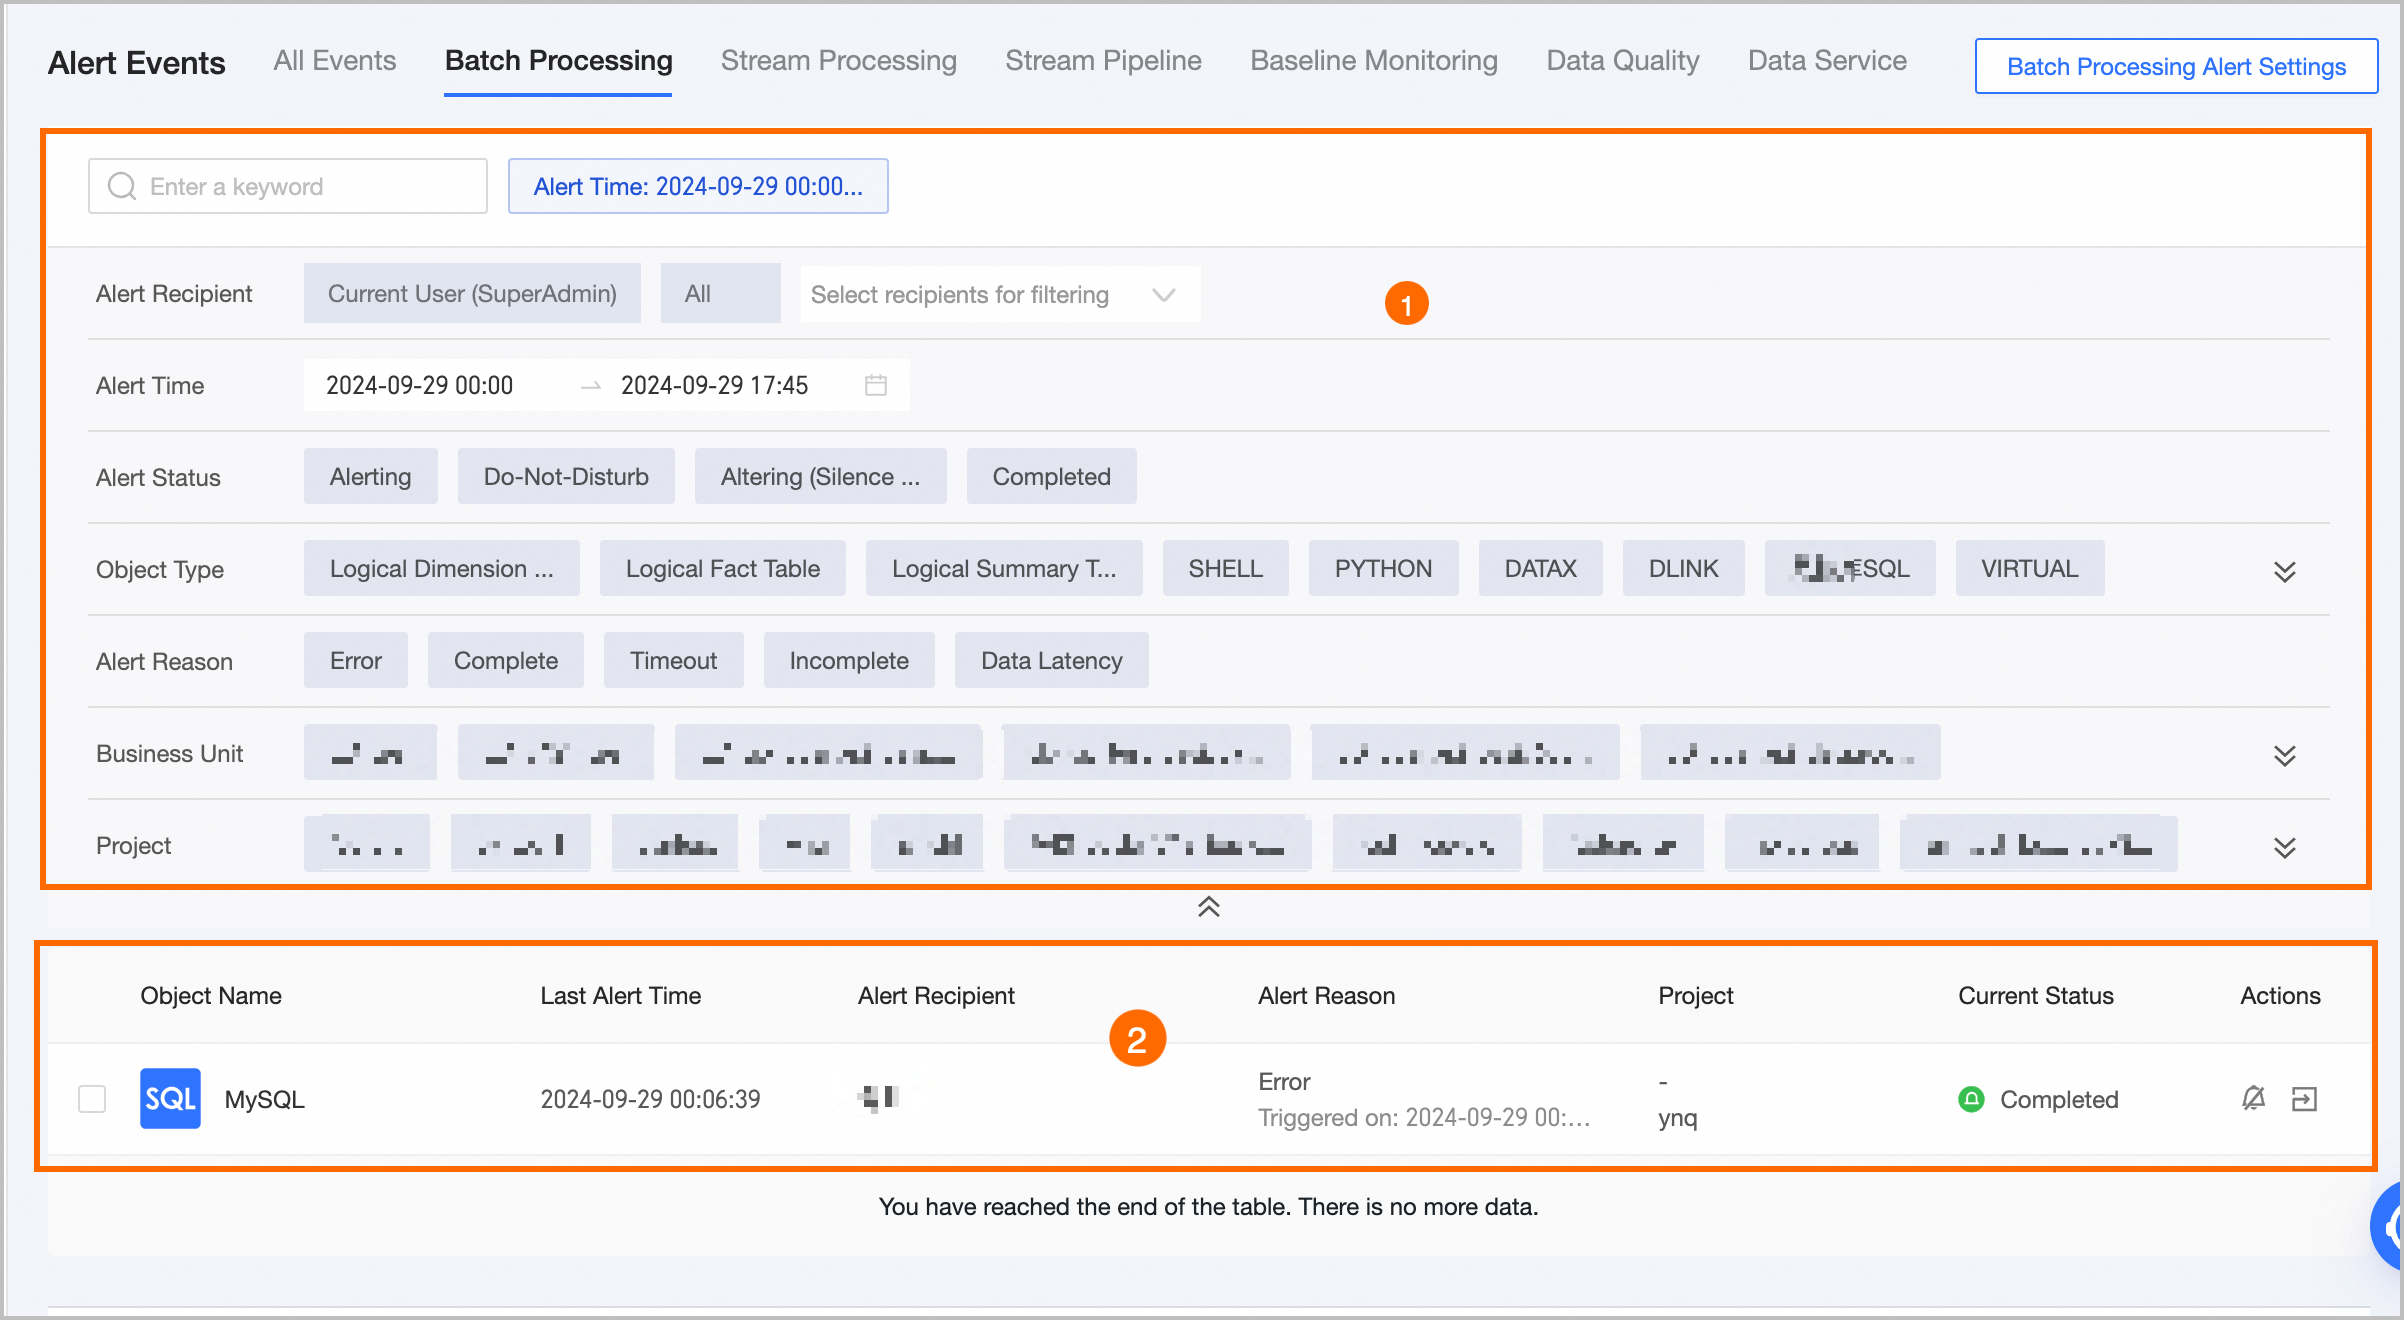
On the Alert Event page, click the Batch Processing, Real-time Computing, Stream Pipeline, Baseline Monitoring, Data Quality, or Data Service tab to view alert events for the corresponding module. Each module tab has the same layout. The following figure uses the Batch Processing tab as an example.
Area
Description
① Filter and search area
Search for alert events by keywords such as the alert object name. You can also filter alert events by Alert Recipient, Alert Date, Alert Status, File Format, Alert Reason, Business Unit, or Project.
Alert Recipient: Filter by Me (superadmin), All, owner of the alert object, on-call schedule, or custom user.
Alert Time: Select an alert time within the last month.
② Alert event list
Displays the object name, last alert time, alert recipient, alert reason, project, and current status of the alert event. You can also set the alert object to Do-Not-Disturb or Handle Alert.
Alert Reason: The cause of the alert event. An alert event contains only one alert rule. The alert reasons vary by module.
Batch Processing: Includes Error, Complete, Timeout, and Incomplete.
Data Quality: Includes Table Rule Violation, Field Rule Violation, and Custom Rule Violation.
Data Service: Includes Abnormal average response time, Abnormal number of calls, Abnormal error rate, and Abnormal offline percentage.
Real-time Computing: Includes Excessive service latency, TPS out of range, Failure rate exceeds configured ratio, Data retention exceeds configuration, and Backpressure duration exceeds configuration.
The supported alarm metrics vary by compute engine.
If projects within a tenant are attached only to the Blink compute engine, Backpressure duration exceeds configuration is not supported.
If projects within a tenant are attached only to the open source Flink compute engine, Excessive service latency and Data retention exceeds configuration are not supported.
If a project in a tenant is attached to a real-time computing engine that includes both Blink and open source Flink, both engine types are supported.
Real-time Computing includes alerts for Excessive Service Latency and Failures Exceeding The Configured Ratio.
Current Status: The current status of the alert object. Valid values: Completed, Alerting, Do-Not-Disturb, and Alerting (Cool-down Period).
Completed: The alert event is complete.
Alerting: The alert mode is set to frequent alerting, and the alert has started but has not ended.
Do-Not-Disturb: You can set the status of alert events that are in the Alerting or Completed state to Do-Not-Disturb.
Alerting (Cool-down Period): This status is based on custom alert logic from different systems. For example, Data Service collects metrics every second, but the alert interval is at least 5 minutes.
View alert events: Click the name of an alert object to view its details. For more information, see View the details of an alert event.
Do-Not-Disturb: Set unimportant alert objects to the Do-Not-Disturb state. For more information, see Set the status of an alert event to Do-Not-Disturb.
Handle an alert: To handle an alert event, find the event and click the Handle
 icon. You can also click an Object Name and then click Handle on the Alert Event Details page. You will be redirected to the task page to handle the event based on its cause.
View the details of an alert event
On the All Events page, click an Object Name to open the Alert Event Details page. This page displays details such as the object type, source system, alert reason, alert frequency, first and last alert times, alert count, alert recipients, and notification method. You can perform the Do-Not-Disturb and Handle Alert operations, or click the related links for more information.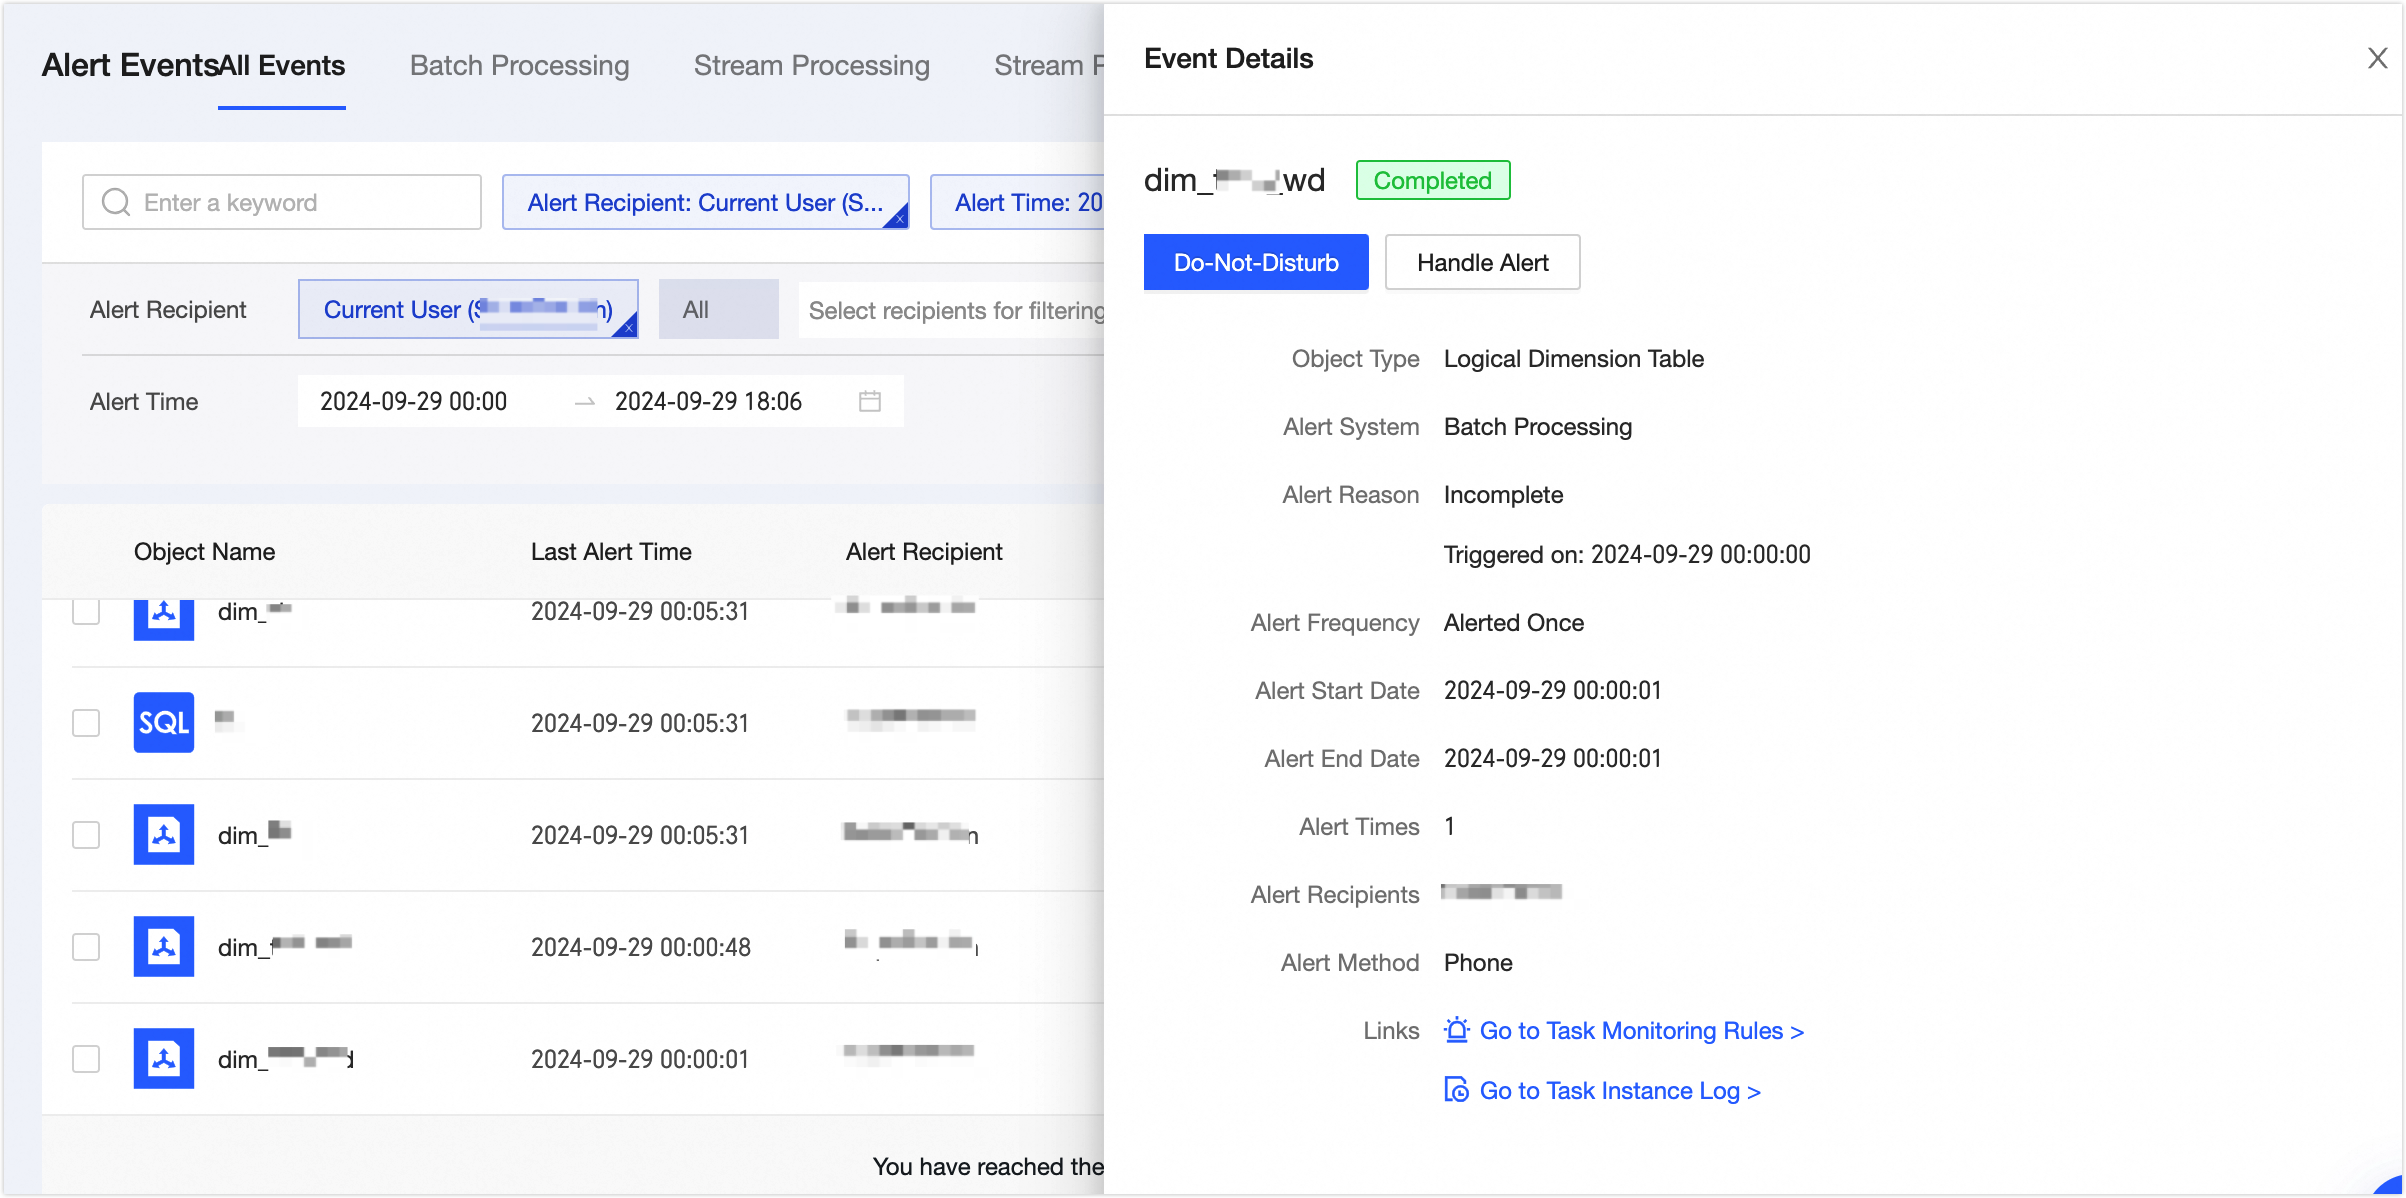
Set the status of an alert event to Do-Not-Disturb
You can set unimportant alert objects to the Do-Not-Disturb state. You can set this status only for events that are in the Alerting or Completed state.
Find the alert event and click the Do-Not-Disturb
 icon. You can also click an Object Name and then click Do-Not-Disturb on the Alert Event Details page.
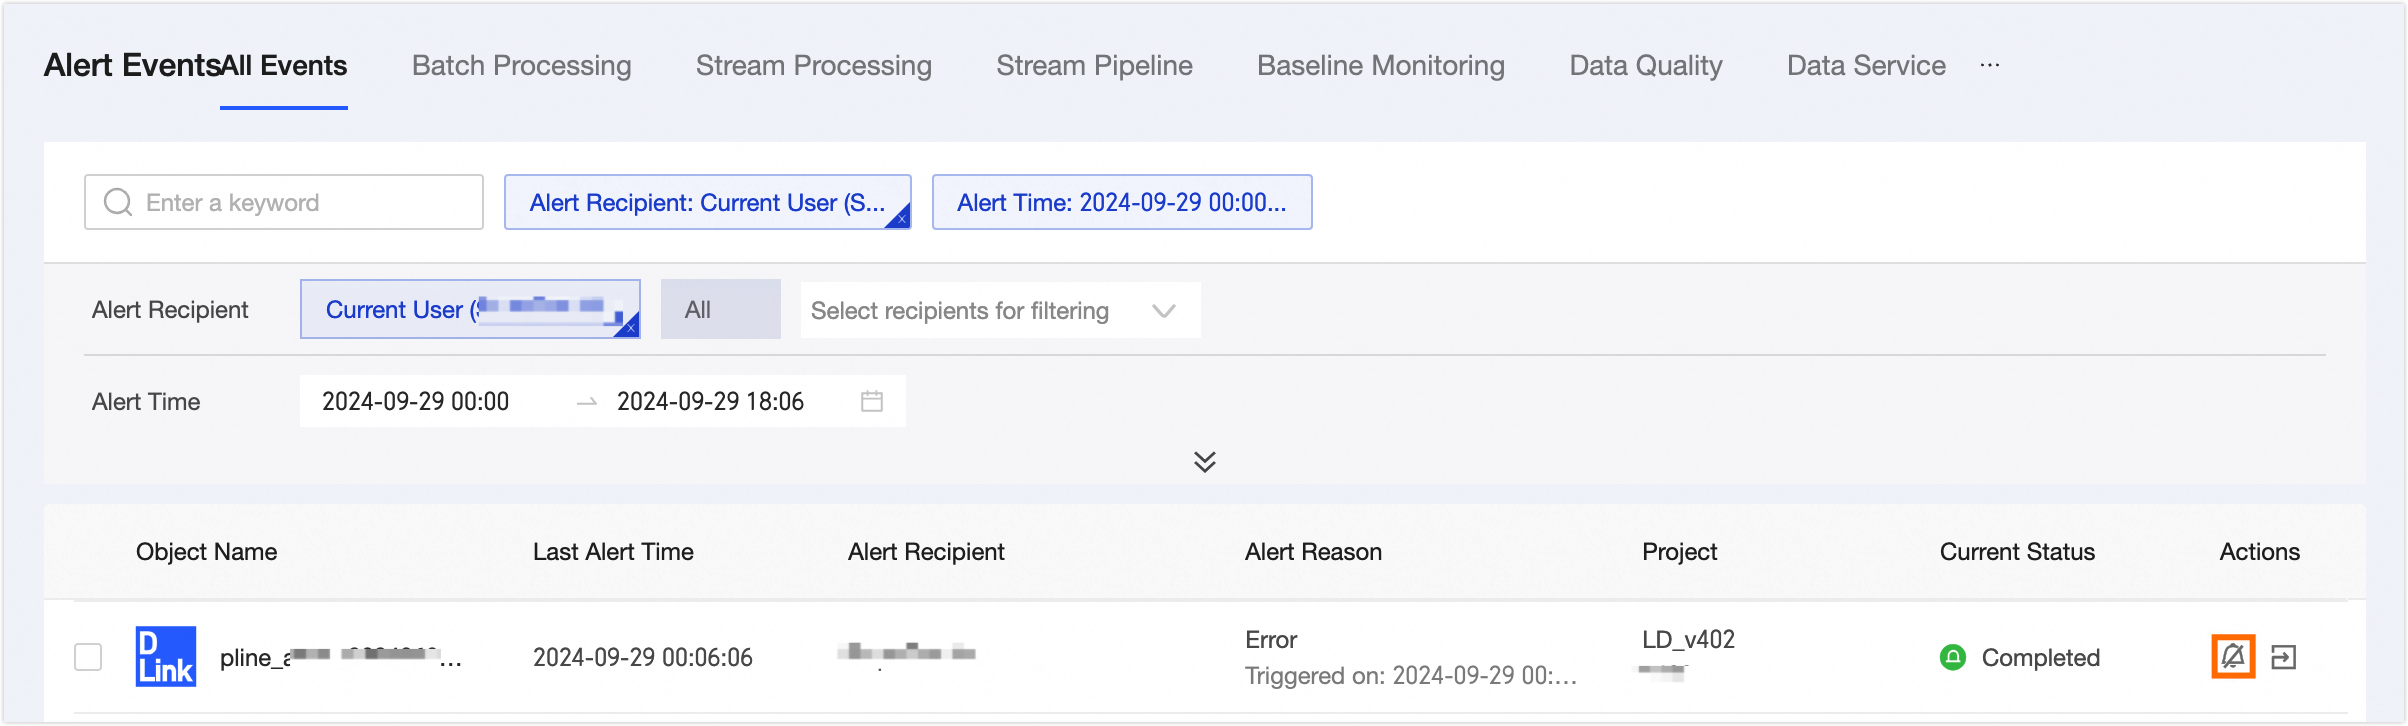
In the Alert Do-Not-Disturb dialog box, set the Do-Not-Disturb Duration. Select All Day or enter a Specified Duration.
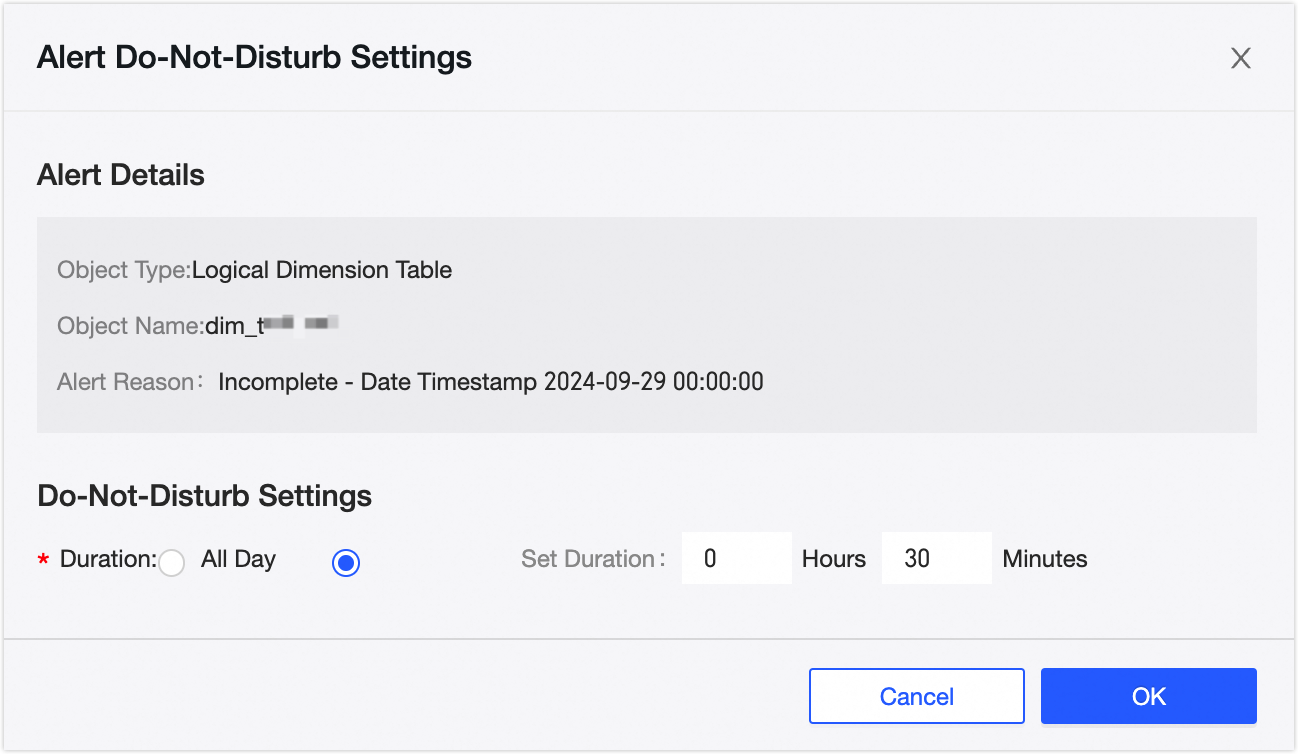
Click OK.
The status of the alert event changes from Alerting or Completed to Do-Not-Disturb.