This topic describes common issues related to resource scheduling.
1. The resource scheduling dashboard shows no data or the displayed time is not updated
5. A "resource waiting" message appears when running a shared node, but resources are sufficient
12. A commented-out resource annotation is still counted in node optimization recommendations
1. The resource scheduling dashboard shows no data or the display time is not updated
Check if the Prometheus component is installed and if the connection to Prometheus is normal.
If the Prometheus component is not installed, contact the Dataphin deployment team. If the component is installed but the displayed time is outdated, the issue might be an abnormal connection to Prometheus. Contact the Dataphin O&M team for troubleshooting. You can also determine if the connection is abnormal by following these steps:
Log on to the Dataphin cluster.
Run the
kubectl get pods -n dataphin | grep rscommand to find the rs pod.Run the
kubectl describe pod <pod_name> -n dataphincommand to find the primary rs pod.Check if the status of the
dataphin-rs-scheduler-rpc-servicelabel isactive. If the status isactive, it is the primary pod. If the status isstandby, it is the secondary pod.Run the
kubectl exec -it <pod_name> -n dataphin -- bashcommand to log on to the primary rs pod.Run the
cd /home/admin/logs/dataphin-rscommand to go to the rs log directory.Check the log for messages about an abnormal Prometheus connection. You can search by running the
grep "failed to connect to" <log_file>command. If the log contains this information, the connection is abnormal.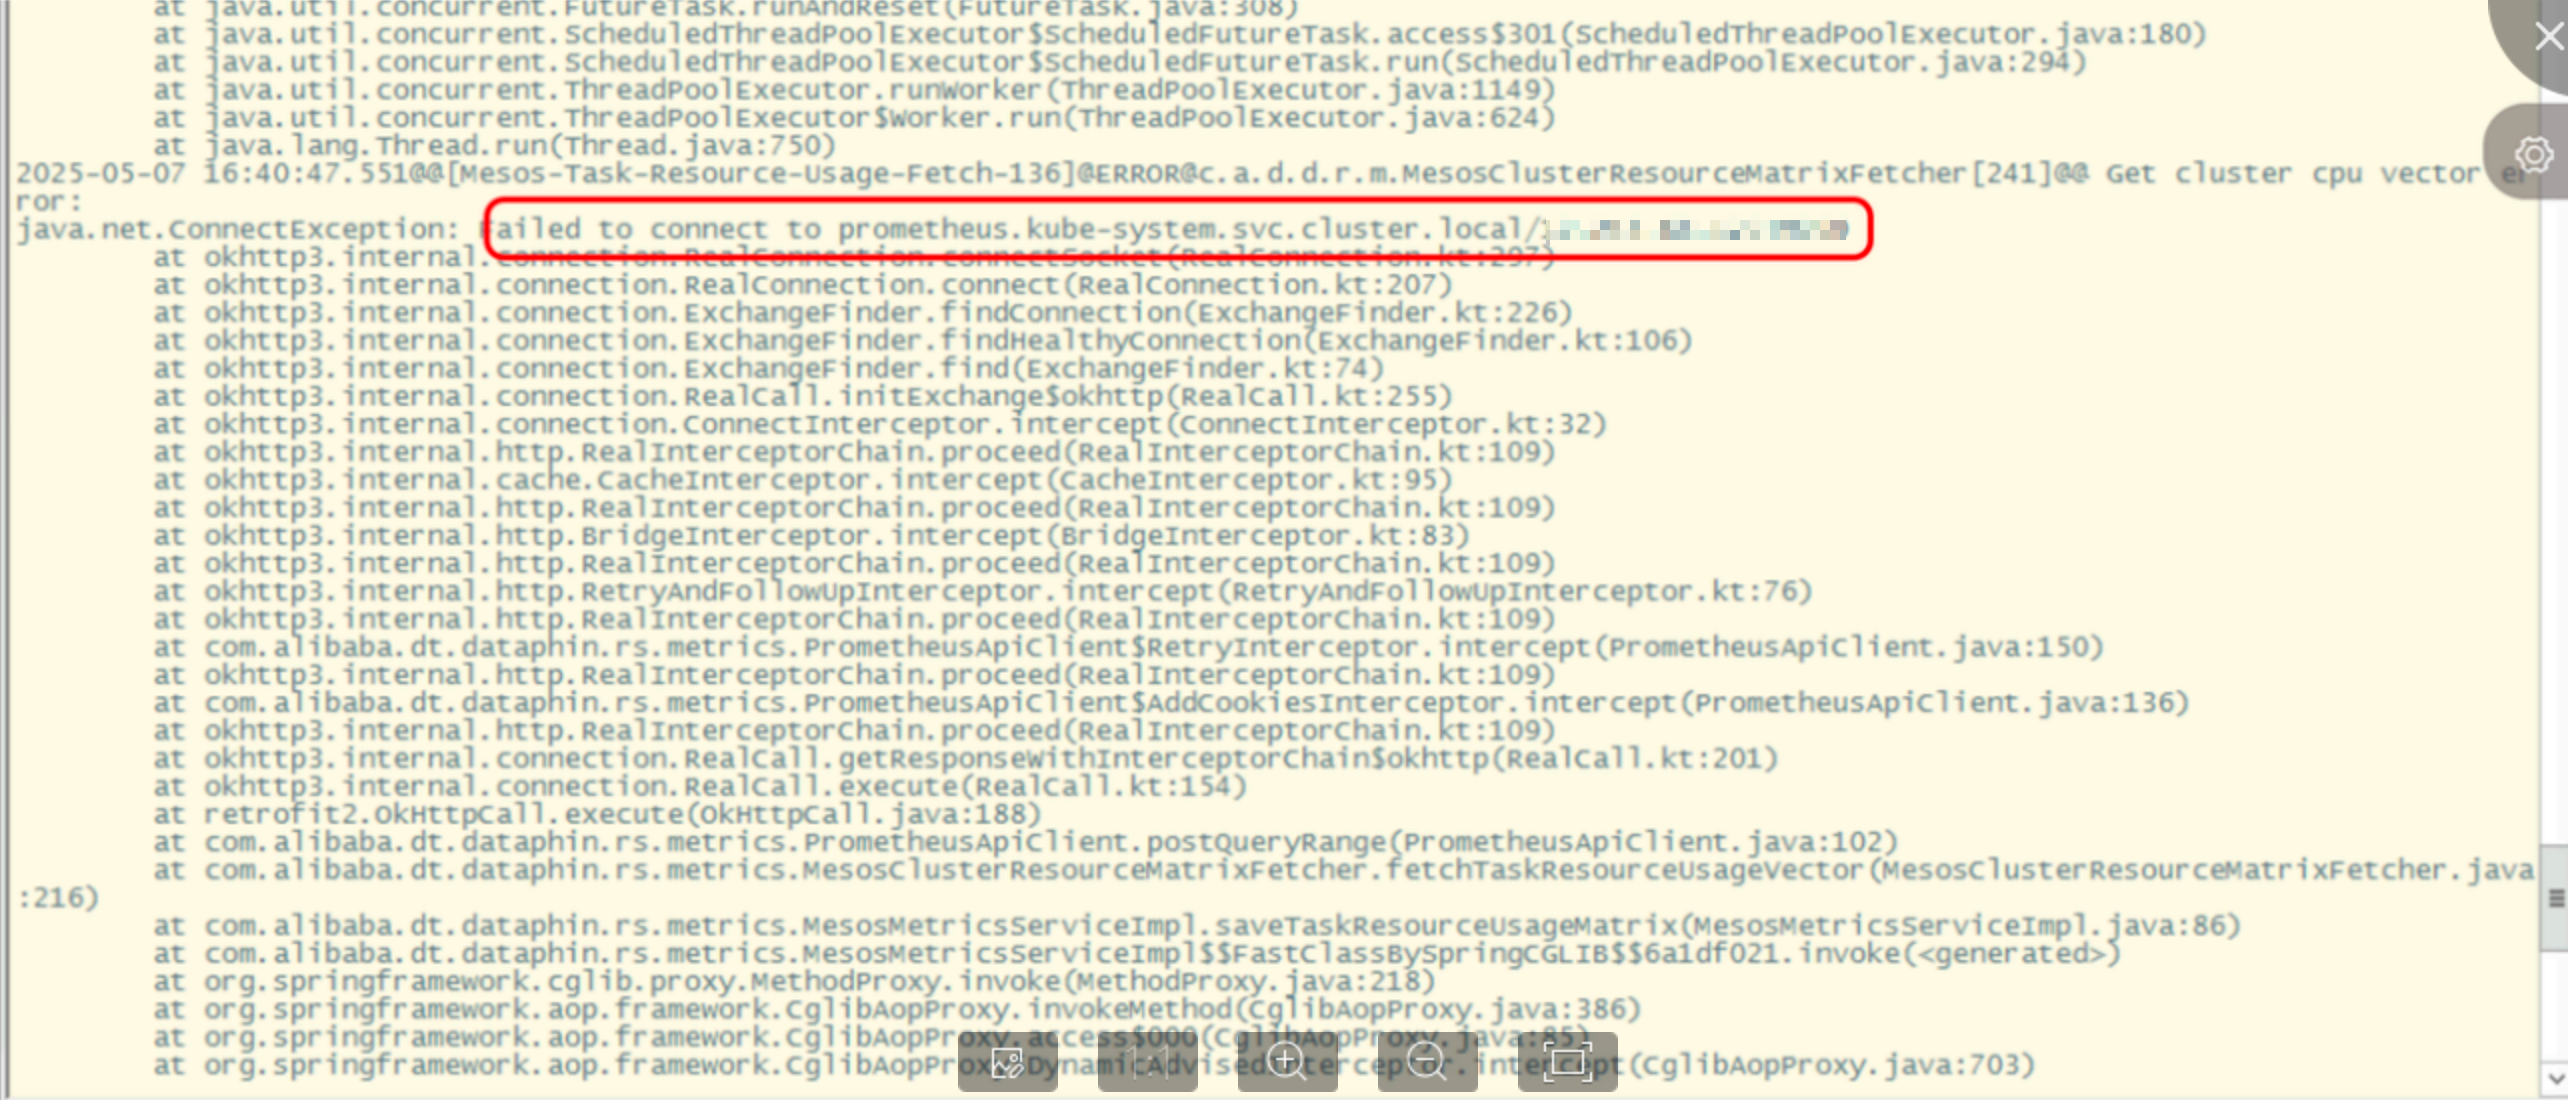
2. A node is executed again after it has already run successfully
Check if the node has an upstream dependency. If it does, a rerun of the upstream node triggers a rerun of the downstream node.
3. The Resource Settings page is not displayed
You must import the license to view the Management Center > System Settings > Resource Settings page.
4. A "resource waiting" message appears when running a node
Check for the following conditions in order:
Many nodes are running in the current resource group.
Many large, long-running nodes are continuously occupying the resource group's resources.
The current resource group is not configured properly. You can go to Management Center > System Settings > Resource Settings to configure the resource group.
The resource configuration for the current tenant is not appropriate. When the resource value of the current tenant changes, the resource groups for that tenant are adjusted accordingly.
For example, if the runtime log ends with a message similar to Sending to agent e405****-****-****-****-****2fc2, the node was successfully sent to the scheduling cluster. However, a problem may have occurred when the scheduling cluster tried to create the node pod. Possible reasons include the following:
The scheduling cluster has insufficient remaining resources to create a new node pod.
The scheduling cluster may have a fault. Common issues include network plugin or clock exceptions.
4.1. Suggestions for insufficient tenant resources
Stop low-priority nodes in the resource group to release resources.
Increase the allocation ratio for the tenant's resource group.
Use off-peak scheduling to prevent nodes from competing for resources during peak hours.
Optimize the resource configuration of nodes based on resource utilization. You can view node resource utilization on the resource dashboard.
4.2. Suggestions for insufficient cluster resources
Stop low-priority nodes in the resource group to release resources.
Use off-peak scheduling to prevent nodes from competing for resources during peak hours.
Optimize the resource configuration of nodes based on resource utilization. You can view node resource utilization on the resource dashboard.
Scale out the cluster resources.
5. A "resource waiting" message appears when running a shared node, but resources are sufficient
If resources are sufficient but a "resource waiting" message appears, the cause may be the concurrency limit for shared nodes. If the number of concurrent shared nodes exceeds the configured limit, new nodes are blocked and enter a waiting state.
The concurrency limit varies for different types of shared nodes.
SQL type default: By default, one shared container pod is created. One shared container pod can run 200 nodes concurrently.
Python and Shell type default: By default, one shared container pod is created. One shared container pod can run 15 nodes concurrently.
You can change the number of shared container pods and the number of concurrent nodes per pod as needed.
6. Do the resource-consuming instances in runtime diagnostics belong to the current resource group or the current tenant?
The resource-consuming instances in runtime diagnostics belong to the current tenant.
7. Automatic rerun is not triggered after a node times out, even though the number of automatic reruns on failure is set
By default, a node timeout does not trigger an automatic rerun on failure. To enable automatic reruns for timed-out nodes, you can go to O&M > Global Configurations > Runtime Configurations > Rerun Configurations and turn on the corresponding switch.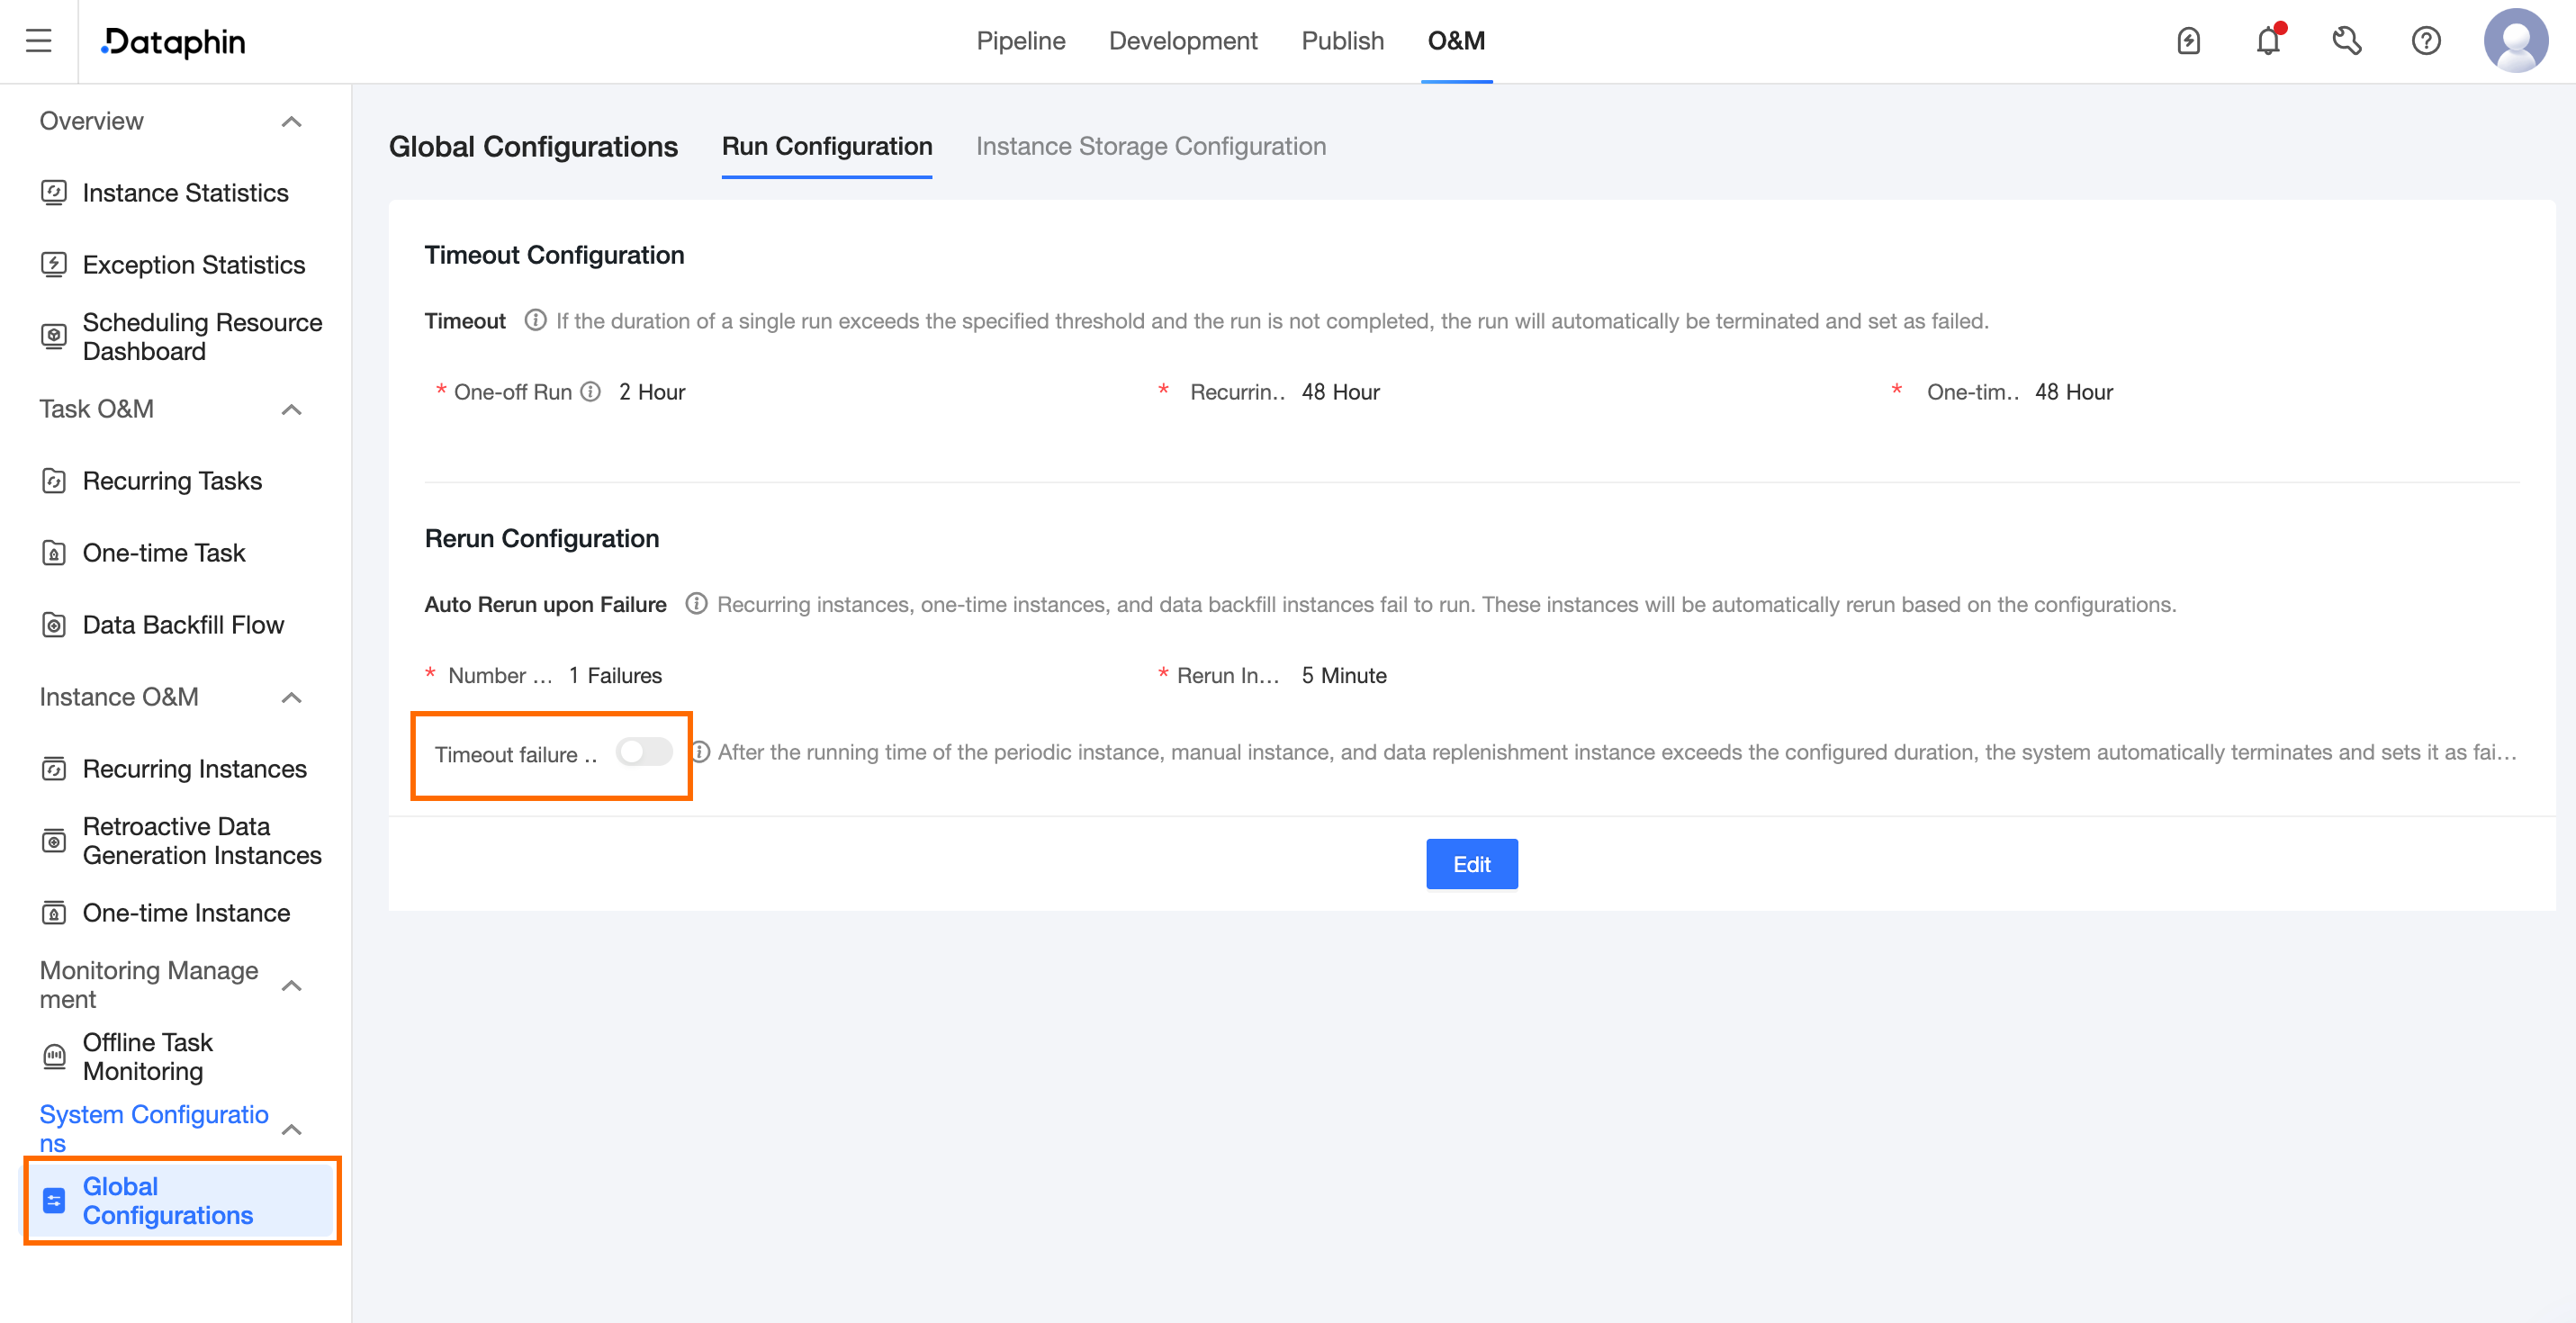
8. Offline task runtime resources
For more information about offline task runtime resources, see Node runtime resources.
For example, for a Python shared node type that starts 20 pods with each pod processing 50 nodes, you can calculate the required resources as follows.
The resources consumed by one pod consist of base resources and node resources. The base resources are 0.5 cores and 4,096 MB (4 GB). The default Python node resources are 0.1 cores and 256 MB. Therefore, the total resources required for one pod are 0.6 cores and 4,352 MB. If you deploy 20 pods, the required resources are 20 × 0.6 cores = 12 cores, and 20 × 4,352 MB = 87,040 MB (85 GB).
9. A "503 Service Temporarily Unavailable" error occurs when querying the instance list on the O&M page
First, check if the request was blocked by a Web Application Firewall (WAF). A WAF is a network security tool used to detect and block malicious traffic, such as SQL injections and cross-site scripting (XSS) attacks.
10. Timestamps in the runtime log appear out of order
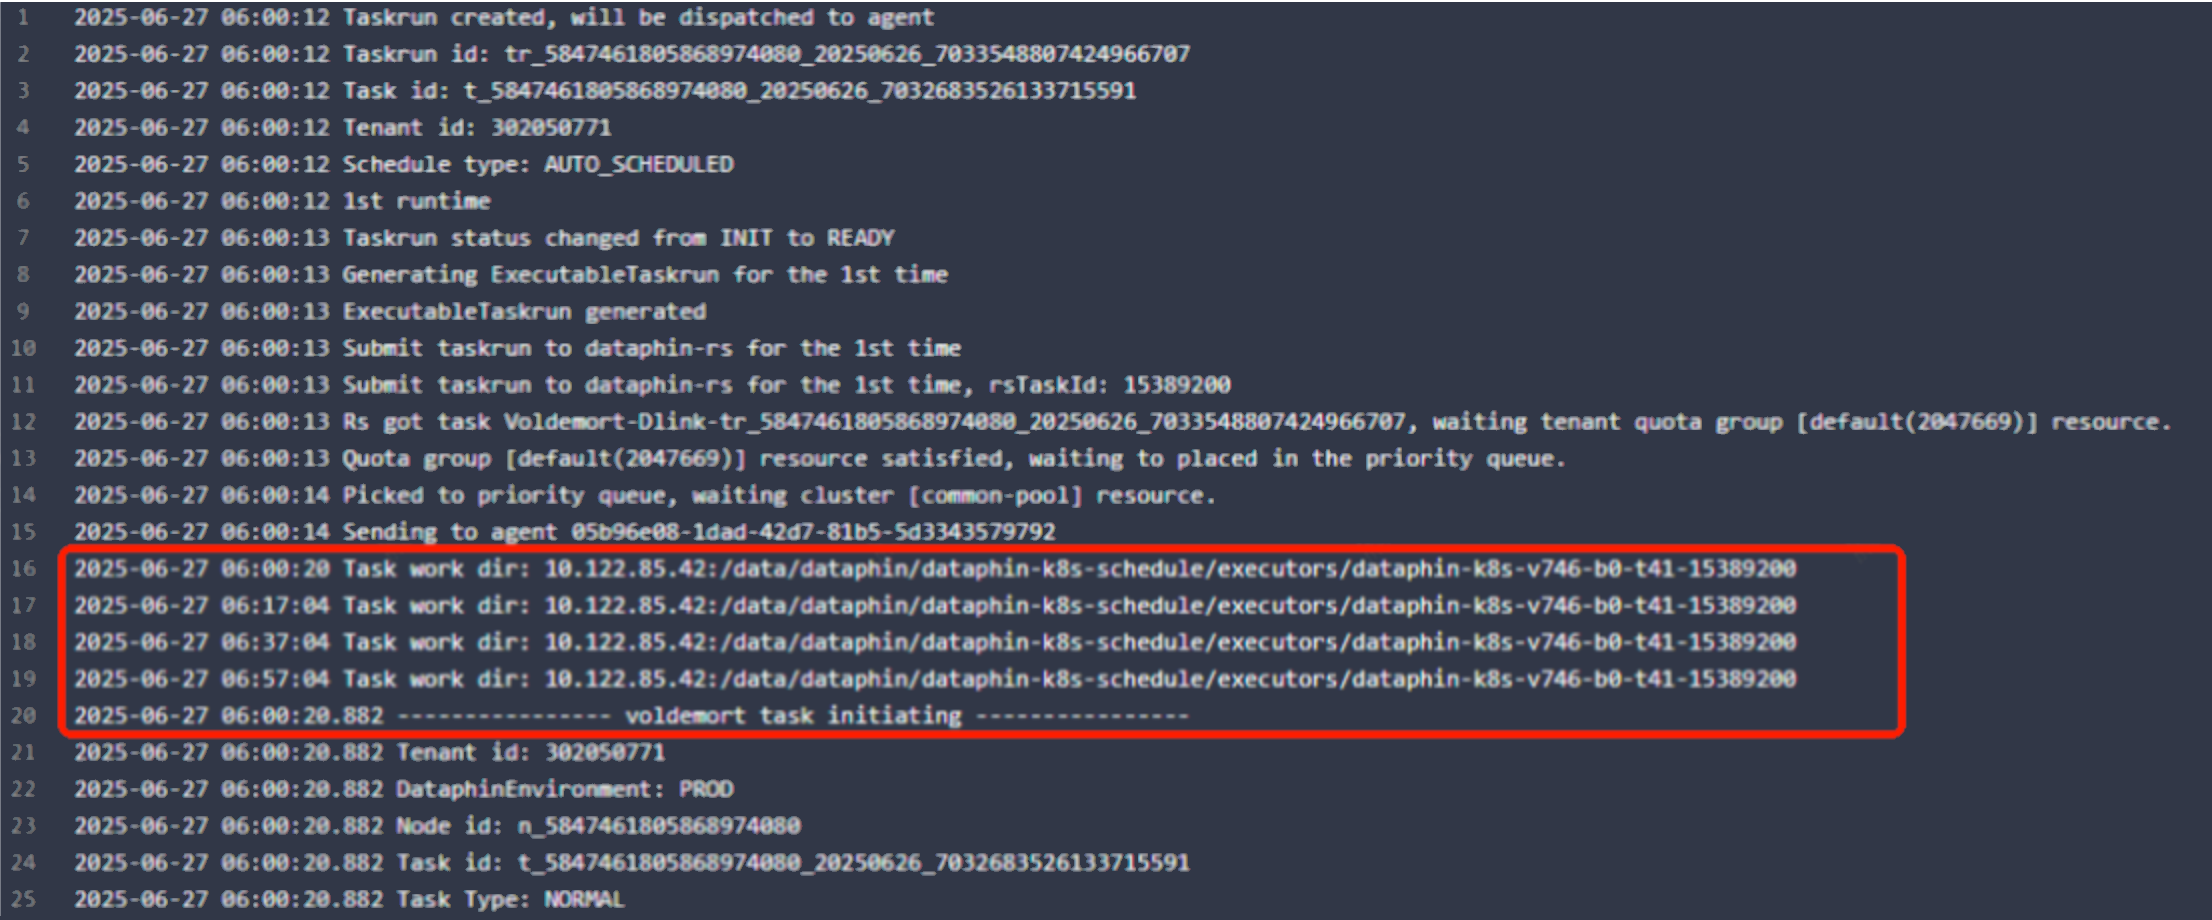
The timestamps are not out of order. The node runtime log is a combination of logs from three stages. The middle part consists of logs that are periodically polled from the server. The logs from the three stages are not sorted together by time.
11. Is there Python documentation for calling OpenAPI from a trigger-based node developed in Python?
Currently, only some APIs support development in Python. These include APIs that are published on the public cloud and O&M-related APIs.
References:
Introduction to trigger-based nodes: Dataphin v4.0: Cross-system scheduling dependencies are no longer a problem
API documentation: GetInstanceUpDownStream - Query the upstream and downstream instances of an instance
Instructions for developing trigger-based nodes: Instructions for developing trigger-based nodes
12. A commented-out resource annotation in the code is still counted in the recommended optimization node
Commented-out resource annotations still take effect. To exclude the resource from being counted, you must delete the annotation completely.
13. After an upgrade, a previously working OpenAPI call fails with a "tenantId cannot be empty" error
This error occurs if you upgrade from a version of Dataphin earlier than V3.0. Starting from Dataphin V3.x, the tenantId parameter is required.
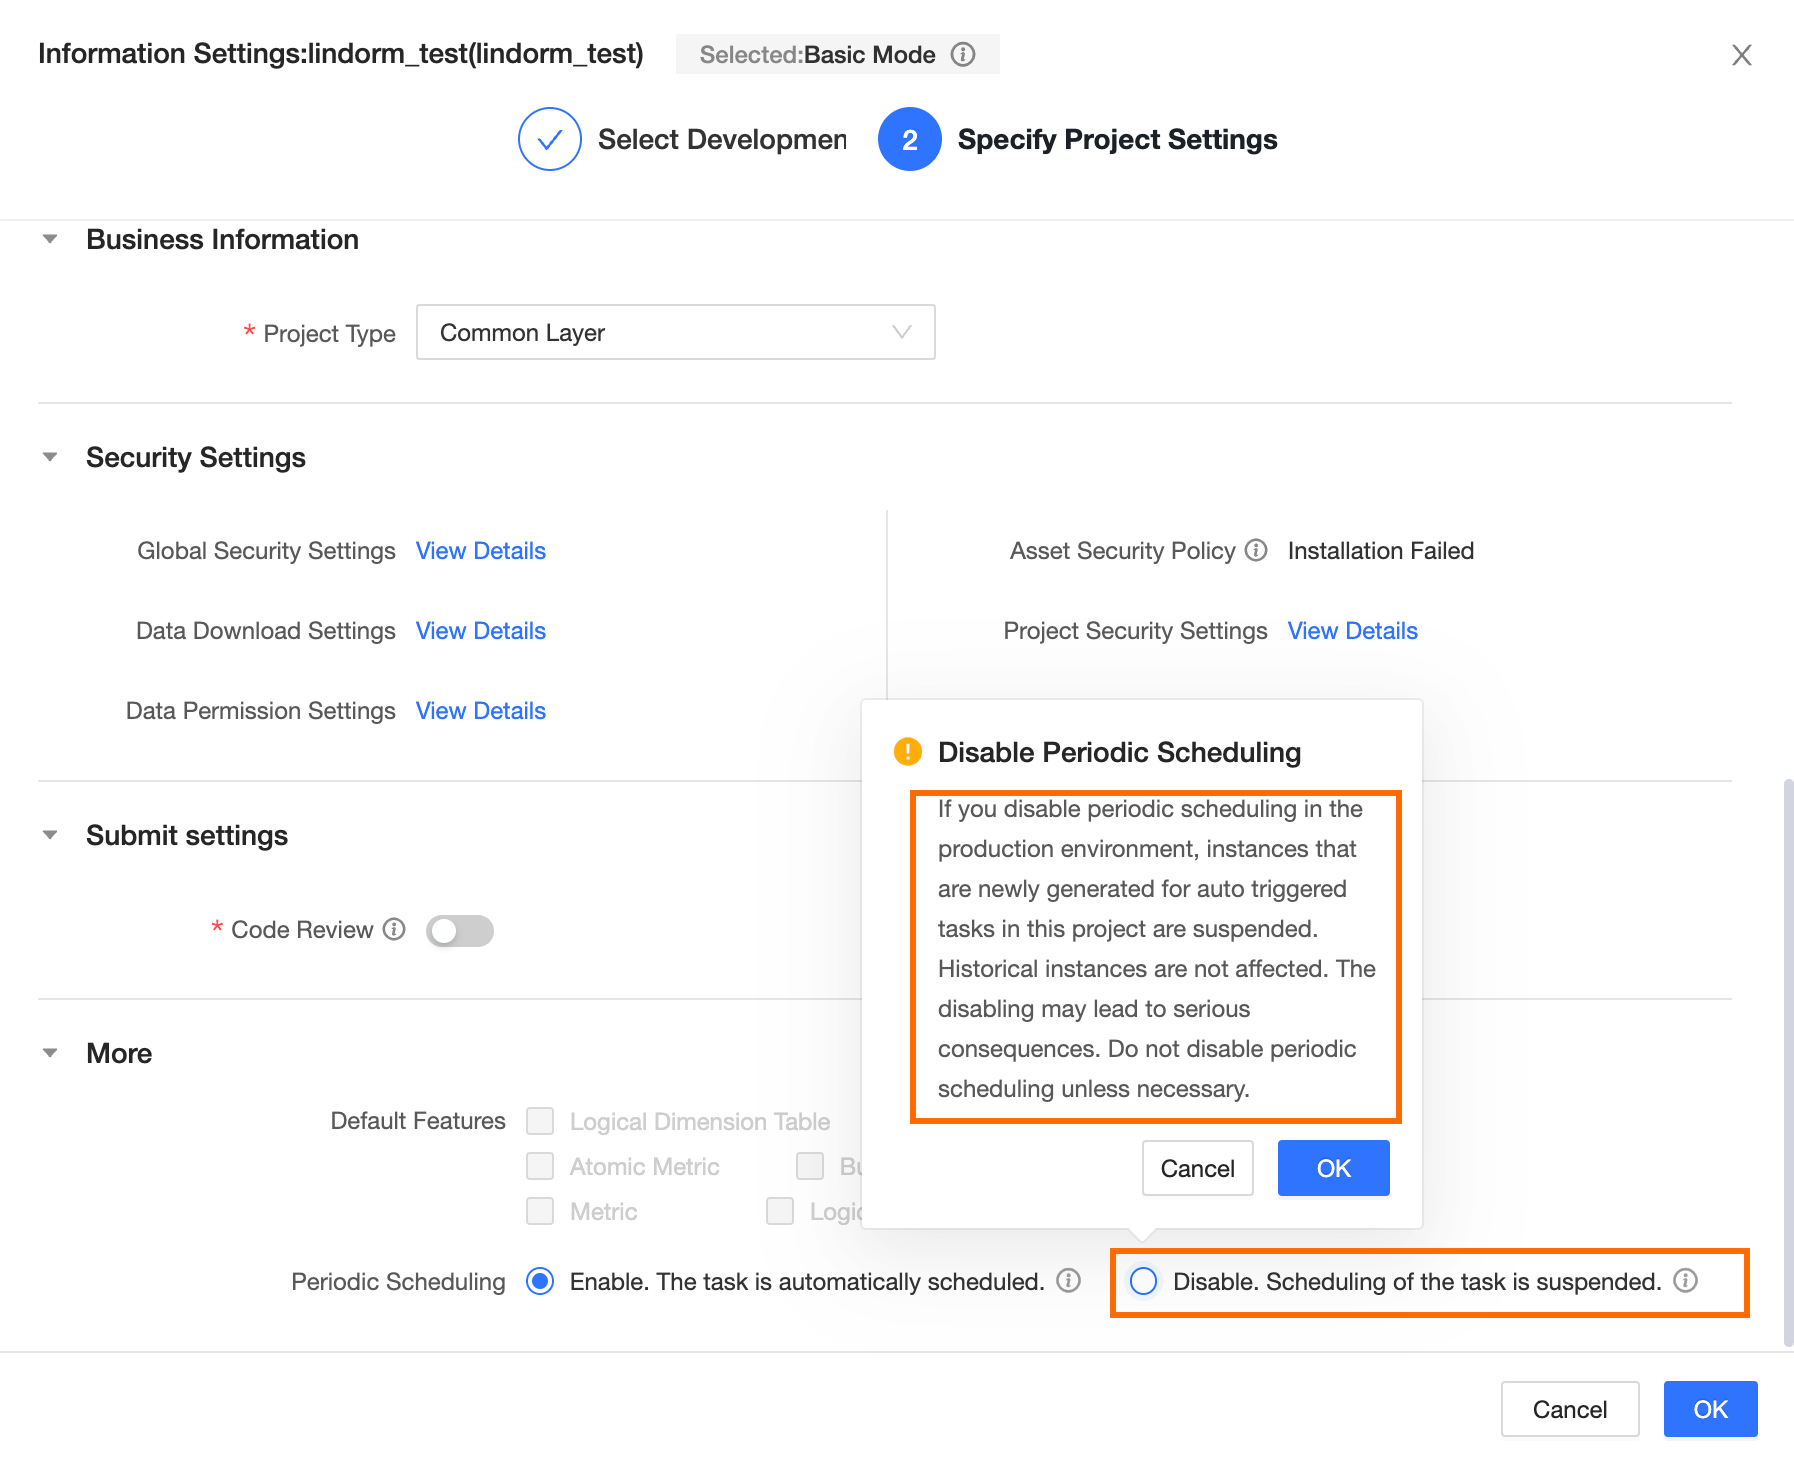
14. A node is shown as paused on the auto triggered task page in O&M, even though it is configured for normal scheduling
Check if the periodic scheduling for the project to which the node belongs is set to Disabled, Skip Execution. If so, change this setting to Enabled, Auto Schedule.