This case study illustrates the planning of business segments, projects, data domains, and metrics within a business model for a retail business group at a certain company. It demonstrates the construction of a data mid-end using Dataphin, providing insight into its core concepts.
Introduction to the case scenario
A certain company, a large conglomerate with interests spanning from retail supermarkets to finance and real estate, has an organizational structure depicted in the figure below. It comprises three independent business groups, each operating with its own responsibility system and managing its finances independently. The company is actively pursuing digital transformation and plans to leverage Dataphin to establish a data mid-end, starting with the retail business group as the initial phase of the project. 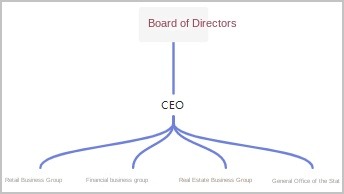
Business flow of the retail business group
The business flow of the retail business group is shown in the following figure. 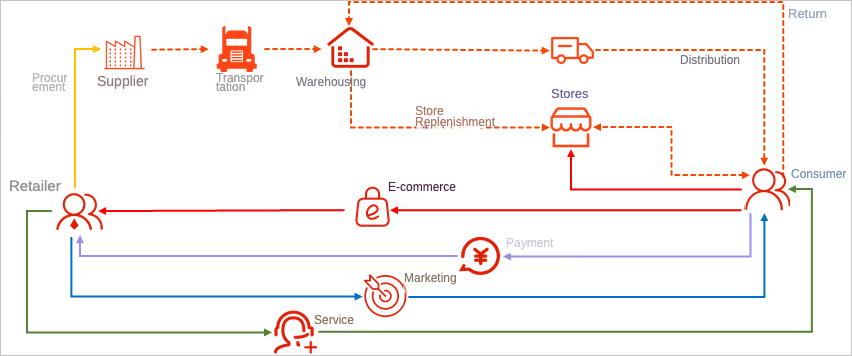
The retail business group operates both online self-operated E-commerce and offline supermarkets. The primary business processes include the following:
Supplier procurement, transportation, and warehousing.
Consumer order placement and payment.
Fulfillment and delivery of large items for online and store sales.
Marketing activities, including online promotions and offline discounts.
After-sales services, such as returns, exchanges, and complaints handling.
Architecture of the retail business group
The existing retail architecture of the retail business group is shown in the following figure. 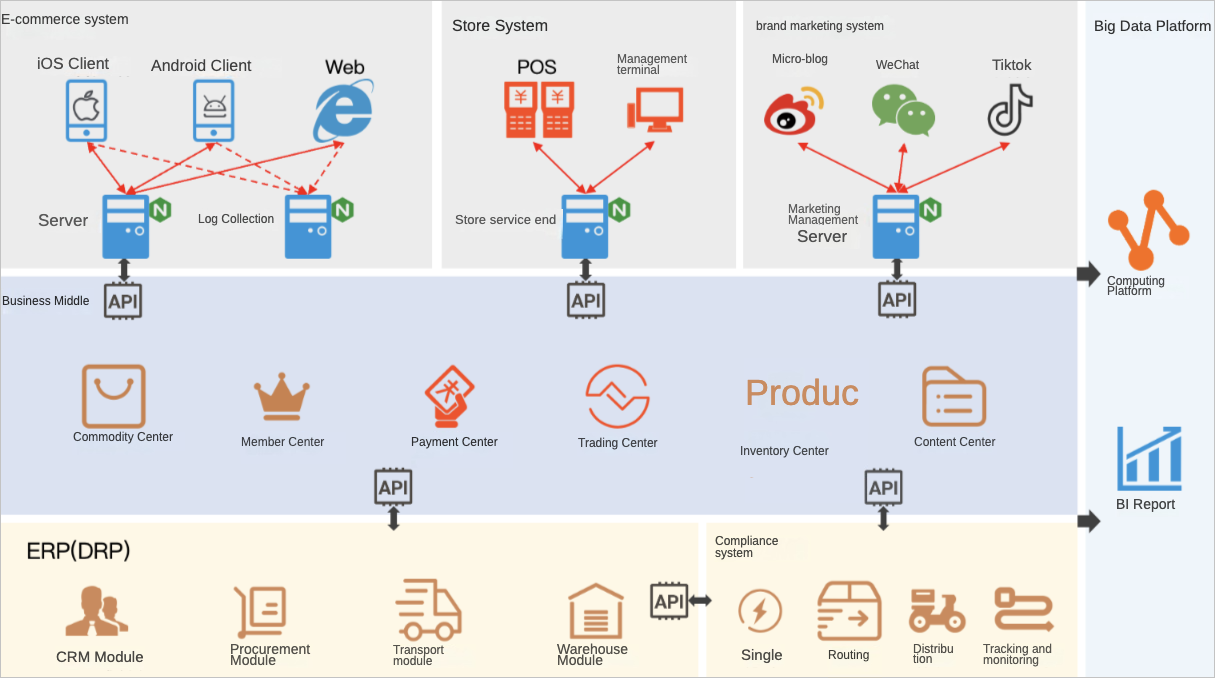
The Business Mid-end system manages members and products/inventory, centralizing order processing and marketing operations.
The E-commerce and store systems represent online and offline retail channels, respectively.
The ERP system is primarily utilized for supply chain management.
Planning the data warehouse
Planning Business Segments
The company operates a divisional system, with each division functioning independently and minimal interaction between them. This is evident in the following ways:
Divisions do not share resources and have separate personnel and office spaces. In terms of Dataphin implementation, there are no shared business objects between divisions.
Business processes are not transferred between divisions. For example, the retail group's procurement or sales processes are entirely separate from those of the finance group.
Based on these factors and the principles of data segment division, the company can establish three independent business segments:
Retail segment
Finance segment
Real estate segment
Planning Projects
The retail business group may be structured as a single project or divided into multiple projects within one business segment. For better management and resource allocation, the case proposes three pairs of projects (each pair consisting of a development and a production project):
ODS layer projects for storing daily synchronized raw data from various systems.
CDM layer projects for storing commonly used enterprise data and supporting multiple business scenarios.
ADS layer projects focused on specific business scenarios.
Dividing Data Domains
Following the principles of subject area division, the data domain details for the retail business group are as follows:
Member (consumer) domain
Product domain
Store domain
Transaction domain
Supply chain domain
Fulfillment domain
Marketing domain
Service domain
Traffic domain
Public domain
Determining Dimensions and Business Processes
To outline dimensions and business processes, follow these steps:
List business activities. The table below includes a selection of business activities.
Data domain
Business activity
Transaction domain
Order, payment
Supply chain domain
Procurement, transportation, warehousing (inbound, shelving, picking, outbound, inventory, etc.)
Fulfillment domain
Order acceptance, delivery
Identify participants and key nodes in each business activity. The table below includes a selection of participants and key nodes.
Data domain
Business activity
Participants
Key nodes
Transaction domain
Order
Consumer, store, product
Order placement, payment, order closure
ImportantOffline order placement, payment, and order closure are all completed at the moment of POS payment.
Transaction domain
Payment
Consumer
Create (payment order), payment, order closure
Supply chain domain
Procurement
Supplier, product, warehouse
Confirm purchase order, prepayment, shipment, receipt, final payment, order closure
Supply chain domain
Transportation, allocation
Warehouse, product, carrier, store
Confirm allocation order, dispatch, receipt, order closure
Fulfillment domain
Delivery
Warehouse, product, consumer
Shipment, receipt, order closure
Determine dimensions and their data domains.
Identify the participants of each business activity, and after deduplication, these become the dimensions. Some dimension attributes are also important analysis angles and should be set as dimensions. Assign dimensions to data domains based on the following principles:
Common objects participating in multiple data domain activities are usually assigned independent data domains, such as the consumer domain.
Objects involved only in a single data domain's activities belong to that domain.
Dimensions derived from a dimension's attributes belong to the same data domain as the original dimension.
The table below lists some dimensions and their corresponding data domains.
Data domain
Dimension
Consumer domain
Consumer, gender, age group, occupation, etc.
Product domain
Product, category
Store domain
Store
Supply chain domain
Supplier, warehouse, carrier
Determine Business Processes
Focus on key nodes of business activities, which can be set as business processes. The table below lists some key nodes.
Data domain
Business process
Transaction domain
Order placement, payment, order closure; create (payment order), payment, payment order closure
Supply chain domain
Confirm purchase order, prepayment, shipment, receipt, final payment, procurement order closure; confirm allocation order, dispatch, receipt, allocation order closure
Fulfillment domain
Shipment, receipt, order closure
Configure Logical Dimension Tables
Add attributes to a dimension and define their sources, which may be fields from a physical table in the ODS layer or calculated fields. Associating dimensions will result in a logical dimension table. The table below shows the consumer dimension table, including a selection of attributes.
Attribute field
Description
Source field
Associated dimension
customer_id
Customer ID
dummy_retail_ods.s_customer.id
None
customer_name
Consumer name
dummy_retail_ods.s_customer.name
None
reg_date
Registration date
dummy_retail_ods.s_customer.reg_date
None
gender
Gender
dummy_retail_ods.s_customer.gender
Gender
address_id
Consumer registration address
dummy_retail_ods.s_customer.address_id
Address
The address is a public domain dimension, and its logical dimension table is outlined in the table below, including a selection of attributes.
Attribute field
Description
Source field
Associated dimension
address_id
Internal ID
dummy_retail_ods.s_address.id
None
region_id
Region ID
dummy_retail_ods.s_address.region_id
Region
province_id
Province ID
dummy_retail_ods.s_address.prov_id
Province
city_id
City ID
dummy_retail_ods.s_address.city_id
City
district_id
District ID
dummy_retail_ods.s_address.district_id
District
street
Street
dummy_retail_ods.s_address.street
None
address_detail
Full address
dummy_retail_ods.s_address.addr
None
Configure Logical Fact Tables
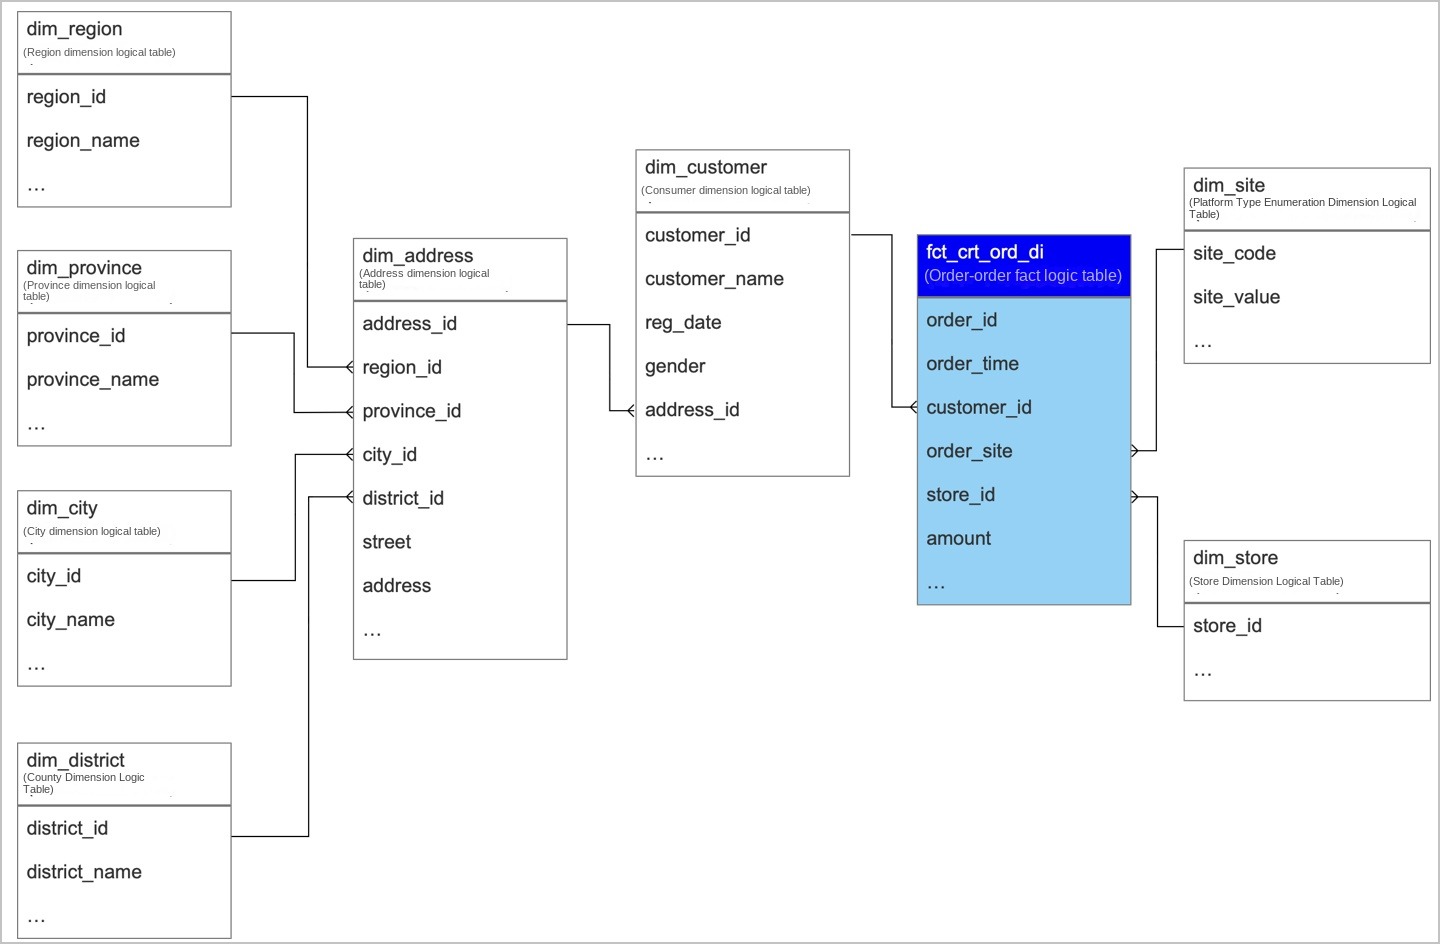
Add attributes to a business process and define their sources. Associating dimensions will result in a logical fact table. The table below shows the order placement fact table, including a selection of attributes.
Attribute field
Description
Source field
Associated dimension
order_id
Order ID
dummy_retail_ods.s_order.id
None
order_time
Order placement time
dummy_retail_ods.s_order.gmt_create
None
customer_id
Consumer (buyer) ID
dummy_retail_ods.s_order.buyer_id
Consumer
order_site
Order source platform
dummy_retail_ods.s_order.order_source
Platform type (enumeration)
store_id
Store ID
dummy_retail_ods.s_order.store_id
Store
amount
Order amount
dummy_retail_ods.s_order.amount
None
This logical fact table is linked to the consumer dimension, which in turn is connected to the address. The address then correlates with various region-related dimensions.
Defining metrics
The example below demonstrates how the consumer operations team calculates the online order amount for each consumer over the past 30 days.
Using traditional SQL development, the following code calculates the online order amount for each consumer over the past 30 days.
--Assume today is 2021/10/01
select customer_id
      ,sum(amount) as order_amt_30d
  from fct_crt_ord_di
 where ds >= '20210901'
   and ds <= '20210930'
   and order_site = 1
 group by customer_id
The following describes how to define the statistical period, statistic granularity, statistical timeliness, atomic metric, business filter, and derived metric based on the SQL code:
Statistical Period
The statistical period defines the time span of the source data for the metric. For this metric, it is the past 30 days, indicating that the source data consists of orders created within this timeframe.
Statistic Granularity
Statistic granularity refers to the dimension that requires aggregation after a Group By operation. For this metric, the consumer dimension is the granularity of analysis.
Statistical Timeliness
Given the statistical period is the last 30 days, and the granularity is daily, the statistical timeliness for this metric is also daily.
Atomic Metric
The order amount serves as the atomic metric for this measure, calculated using the logic
sum(amount). It represents the most fundamental and non-divisible event. In SQL terms, the expression for the order amountsum(amount)is a straightforward aggregation.Business Filter
While the statistical period limits the timeframe of the source data, additional filter conditions refine the data included in the statistics. These conditions constitute the business filter. For this metric, counting only online orders is the business filter, with the logic
order_site=1.Derived Metric
The derived metric in this example is the online order amount for each consumer over the past 30 days.