Database Autonomy Service (DAS) allows you to view the performance trends of database instances based on a variety of performance metrics and custom charts. DAS provides diagnostics capabilities to help you understand the health status of your instances. You can select a time range and manually perform diagnostics on instances within the specified time range.
Prerequisites
The database instance that you want to manage is connected to DAS and is in the Accessed state. For more information, see Connect a database instance to DAS.
Procedure
Log on to the DAS console.
In the left-side navigation pane, click Instance Monitoring.
On the page that appears, find the database instance that you want to manage and click the instance ID. The instance details page appears.
In the left-side navigation pane, click Dashboard.
On the Performance Trends tab, view the trend charts of metrics within a specific time range.
Click More Metrics and select the metrics that you want to view.
NoteClick the
 icon to the right of a metric name to view the details of the metric.
 Select one or more event levels. If events of the specified levels are detected, DAS displays the detected events in the CPU Utilization trend chart.
You can click an event in a trend chart to view the diagnostic result in the event details.
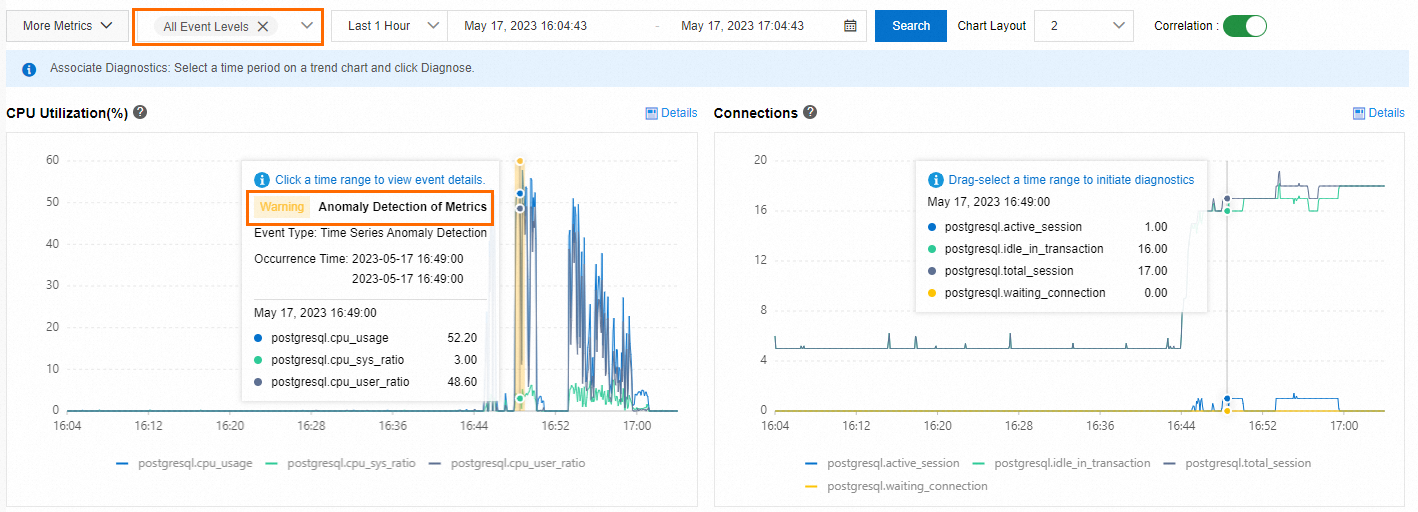
Drag and select a time range in the trend chart of a metric and click Diagnose to analyze the trend of the metric within the selected time range.
Click Details in the trend chart of a metric to view the enlarged trend chart. You can change the time range to view the trend of the metric within the specified time range.
On the Performance Trend Comparison tab, view the comparison of trends of a metric within different time ranges.
Click More Metrics and select the metrics for which you want to compare trends.
On the Custom Charts tab, create dashboards to display the metrics that you want to view. You can add multiple metrics to a dashboard. This facilitates troubleshooting and performance analysis.
Click Add Monitoring Dashboard. In the Create Monitoring Dashboard dialog box, enter a dashboard name and click OK.Dashboard Name
Click Add Node and Metrics. In the Select Metrics of Monitoring Chart dialog box, select the nodes and metrics that you want to view and click the
 icon.
icon. Click OK.