Deadlocks in ApsaraDB RDS for SQL Server can be difficult to diagnose from application logs alone. Database Autonomy Service (DAS) provides the Lock Optimization feature, which records every deadlock event and lets you trace the exact SQL statements, sessions, and resources involved — giving you the data needed to identify root causes and reduce recurring deadlocks.
This topic walks you through the full diagnostic workflow: navigate to the deadlock statistics, read the trend data to spot patterns, expand session details to find the problem queries, and use the deadlock diagram to understand lock relationships.
Limitations
Instances running SQL Server 2008 R2 with standard SSDs or enhanced SSDs (ESSDs) are not supported.
How it works
When a transaction modifies a resource, SQL Server locks that resource to prevent conflicting changes from concurrent transactions. A deadlock occurs when two or more transactions each hold a lock the other needs. 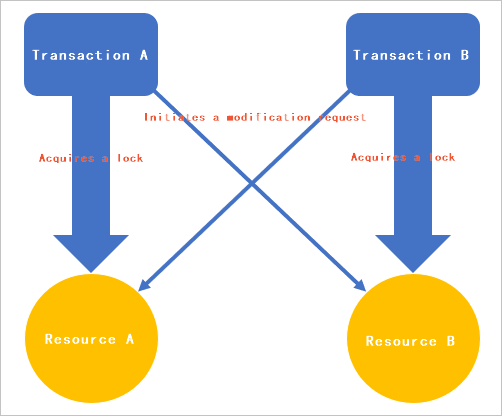
SQL Server resolves the deadlock by terminating the transaction that is least expensive to roll back. If your application receives that termination, it must resubmit the transaction.
DAS runs an internal deadlock monitor thread that periodically scans your RDS instance. When a deadlock is detected, DAS evaluates the blocking and blocked sessions and terminates the session in which the transaction can be rolled back at a lower cost than the other session. For example, if a deadlock occurs between a session that executes the SELECT statement and a session that executes the UPDATE statement, DAS terminates the SELECT session because rolling it back costs less. DAS then records the event so you can review it from the DeadLock tab.
Deadlock types
DAS can detect and classify the following deadlock types:
KeyDeadlockObjectDeadLockRIDDeadlockPageDeadlockComplieDeadlock
For details on each type, see Lock granularity and hierarchies.Lock granularity and hierarchies
Lock modes
SQL Server uses the following lock modes to control how concurrent transactions access the same resource:
| Mode | Description |
|---|---|
| Shared (S) | After a transaction acquires a shared lock, the resource can be read but not modified until the lock is released. |
| Update (U) | After a transaction acquires an update lock, another transaction cannot modify the resource until it acquires an exclusive lock on it. |
| Exclusive (X) | After a transaction acquires an exclusive lock, no other transaction can access the resource until the lock is released. |
For details, see Lock modes.Lock modes
View deadlock statistics
Log on to the DAS console.
In the left-side navigation pane, click Instance Monitoring.
Find the target instance and click its instance ID to open the instance details page.
In the left-side navigation pane, click Lock Optimization. On the Lock Optimization page, click the DeadLock tab.
On the DeadLock tab, review the deadlock statistics described in the sections below.
DeadLock tab reference
Numbers of deadlocks

Displays the total number of deadlocks that occurred across different time periods.
Deadlock trend
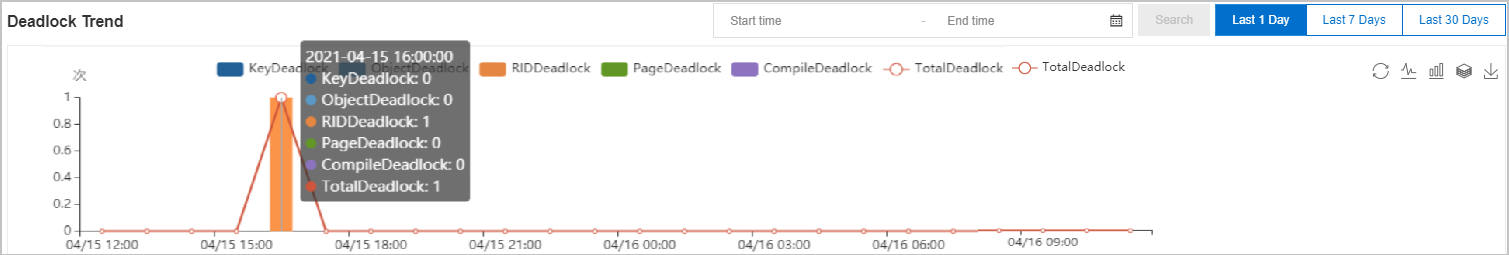
Displays a time-series breakdown of deadlock types. Use the following controls to query deadlock data:
Set a start time and end time, then click Search to view deadlocks within that range.
NoteThe time range cannot exceed 30 days.
Click Last 24 Hours, Last 7 Days, or Last Month to jump to a preset range.
Hover over a point in the trend chart to see the types and counts of deadlocks at that timestamp.
Use the
 icons in the upper-right corner to change the chart display style or download the chart.
Deadlock details
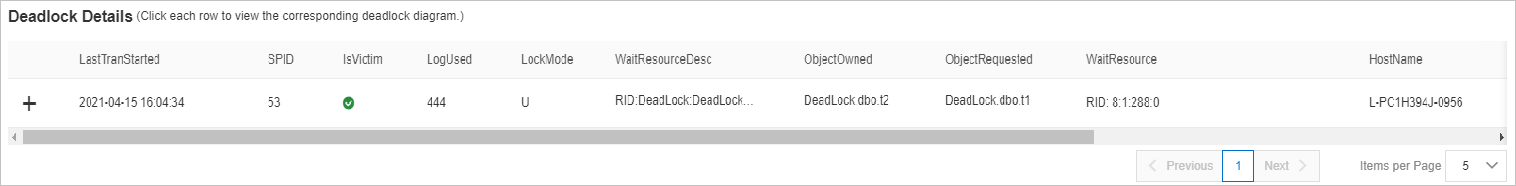
Lists all recorded deadlock events. Click the ![]() icon to the left of a record to expand the blocking and blocked session details.
icon to the left of a record to expand the blocking and blocked session details.
Each session entry includes the following fields:
| Field | Description |
|---|---|
LastTranStarted | The time the transaction started in this session. |
SPID | The session ID. |
IsVictim | Whether this session was terminated as the deadlock victim. |
LogUsed | The size of transaction log generated in this session, in bytes. |
LockMode | The lock mode held by this session. See Lock modes. |
WaitResourceDesc | Details of the resource this session is waiting to acquire. |
ObjectOwned | The object currently locked by this session. |
ObjectRequested | The object this session is requesting to lock. |
WaitResource | The name of the resource this session is waiting for. |
HostName | The host running the transaction in this session. |
LoginName | The account used to run the transaction. |
Status | The current status of the transaction. |
ClientApp | The client application that initiated the transaction. |
SQLText | The SQL statement executed in this session. Click the statement to open it in a window where you can copy it for further analysis. |
Deadlock diagram
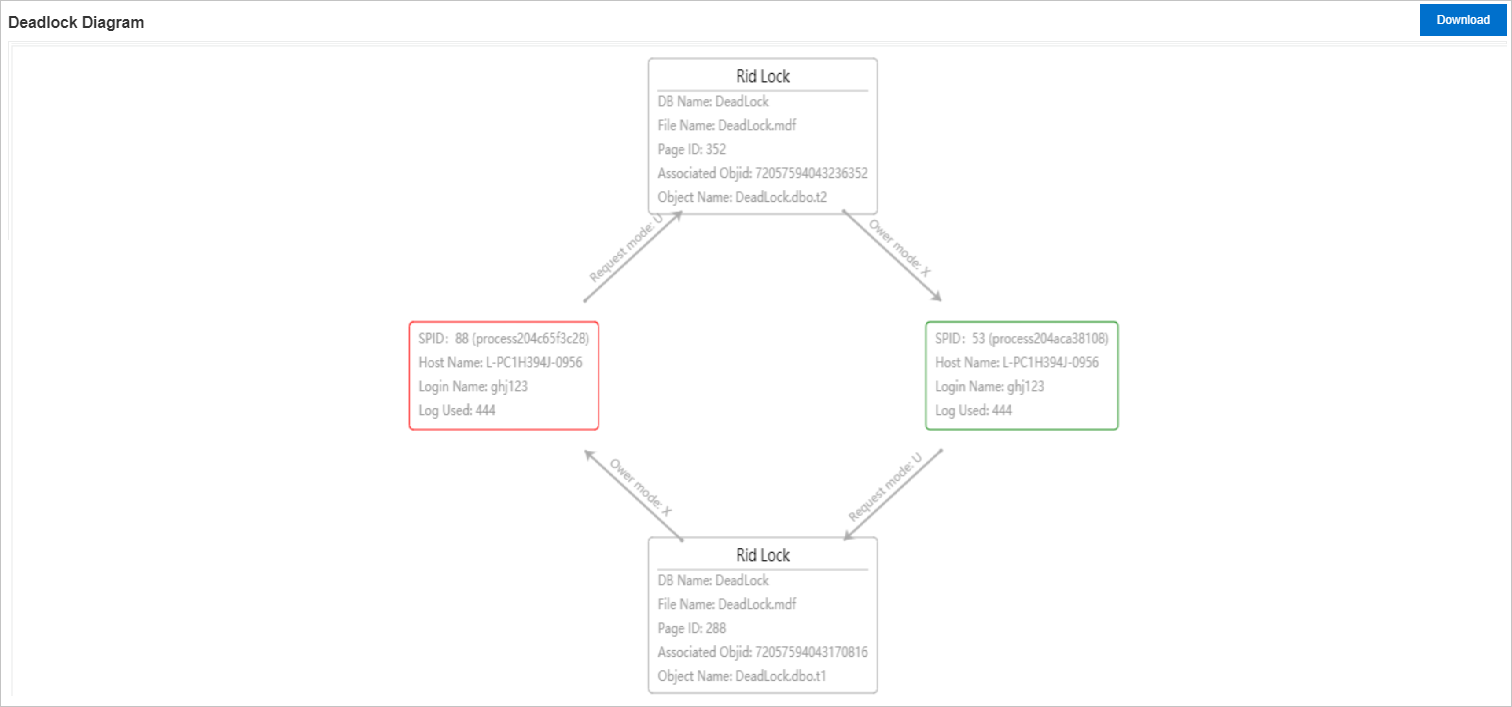
Click any deadlock record in the Deadlock details section to load its deadlock diagram here. The diagram shows the relationships between the blocking and blocked sessions and the details of each locked resource.
Click Download to save the diagram as an XDL file. The XDL file contains the full deadlock details in XML format, which you can open in SQL Server Management Studio (SSMS) for deeper analysis. For more information, see Download SQL Server Management Studio (SSMS).
What's next
After identifying the deadlock sessions and SQL statements:
Copy the
SQLTextfrom the victim or blocking session. Examine its execution plan to find missing indexes or inefficient access patterns that increase lock hold time.If deadlocks recur, reduce transaction scope, adjust the order in which transactions acquire locks, or add indexes to minimize lock contention.