A traffic playback report is a core tool for database performance stress testing and comparative analysis. It compares various performance metrics between a source and a destination instance to help you comprehensively evaluate the performance of the database instance.
Core principles and key considerations
Before you read the report, it is important to understand how traffic playback works and its limitations. This knowledge helps you interpret the playback results correctly.
Principles/Considerations | Description |
Playback dependency | The traffic playback feature relies heavily on the audit log of the source instance. The replayed traffic content, concurrency, and execution order are all derived from this log. |
Not a 100% reproduction | Playback cannot reproduce the exact real-time pressure and transaction sequence. This is because of the time precision of audit logs, which is usually in seconds, and small differences in the playback environment, such as network latency or kernel scheduling. The result is a highly realistic simulation, not an exact replication. |
Risk of SQL truncation | The audit log of the source instance has a length limit. This limit can cause long SQL statements to be truncated. Truncation has two possible effects:
|
Comprehensive assessment | Do not draw conclusions from a single metric. Perform a comprehensive assessment using multiple performance metrics from the report. These metrics include CPU, Queries Per Second (QPS), latency percentiles, and SQL performance. |
In-depth guide to traffic playback report
The report consists of five core modules: Overview, Performance Trend, SQL Distribution, Related SQL, and Parameter Comparison.
Overview - Your performance summary panel
This module provides an executive summary of the report. It offers a top-level comparison of core performance metrics for both instances, which helps you form an overall impression of the playback results in under 30 seconds.
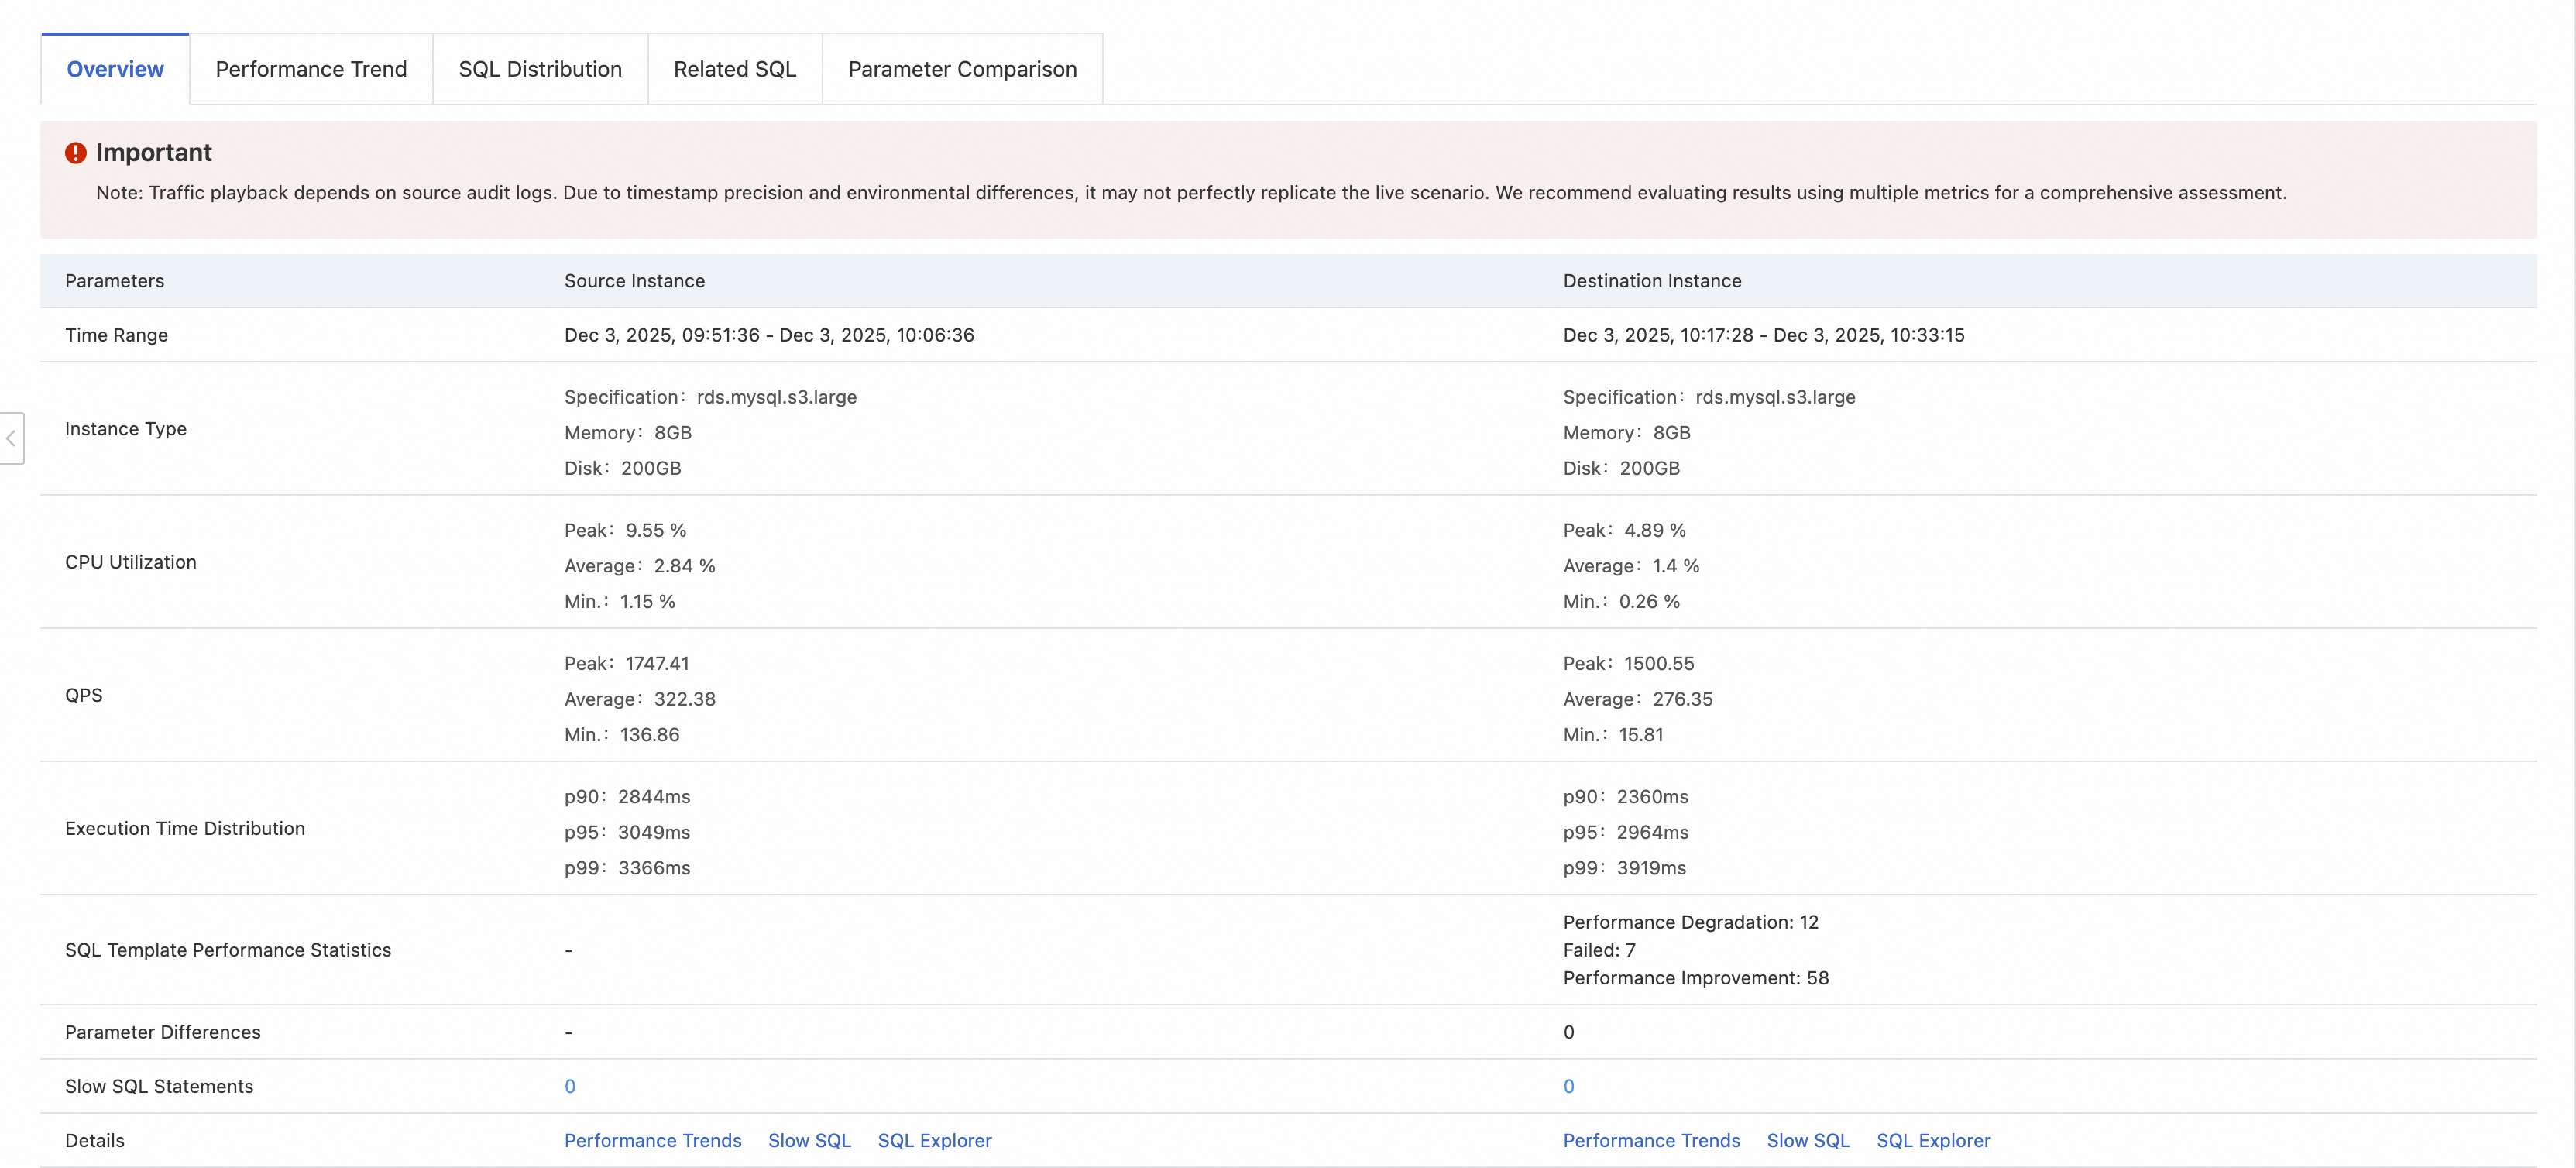
Key metric | Interpretation and points of focus |
Time Range | Confirm the playback range and comparison baseline are correct. Focus on differences in the instance type. This is a common cause of performance differences. |
Instance Type | |
CPU Utilization | Provides a preliminary assessment of load capacity. |
QPS | |
Execution Time Distribution | Evaluate the user experience. P99 latency represents the worst-case user experience. |
SQL Template Performance Statistics | Quickly identify potential problems. |
Parameters Differences | Indicates potential configuration issues. Go directly to the Parameter Comparison module for details. |
Slow SQL Statements | A count of slow query SQL statements. |
Performance Trend - A time-lapse of performance changes
This module uses time series charts to dynamically show how the performance metrics for both instances changed during the playback.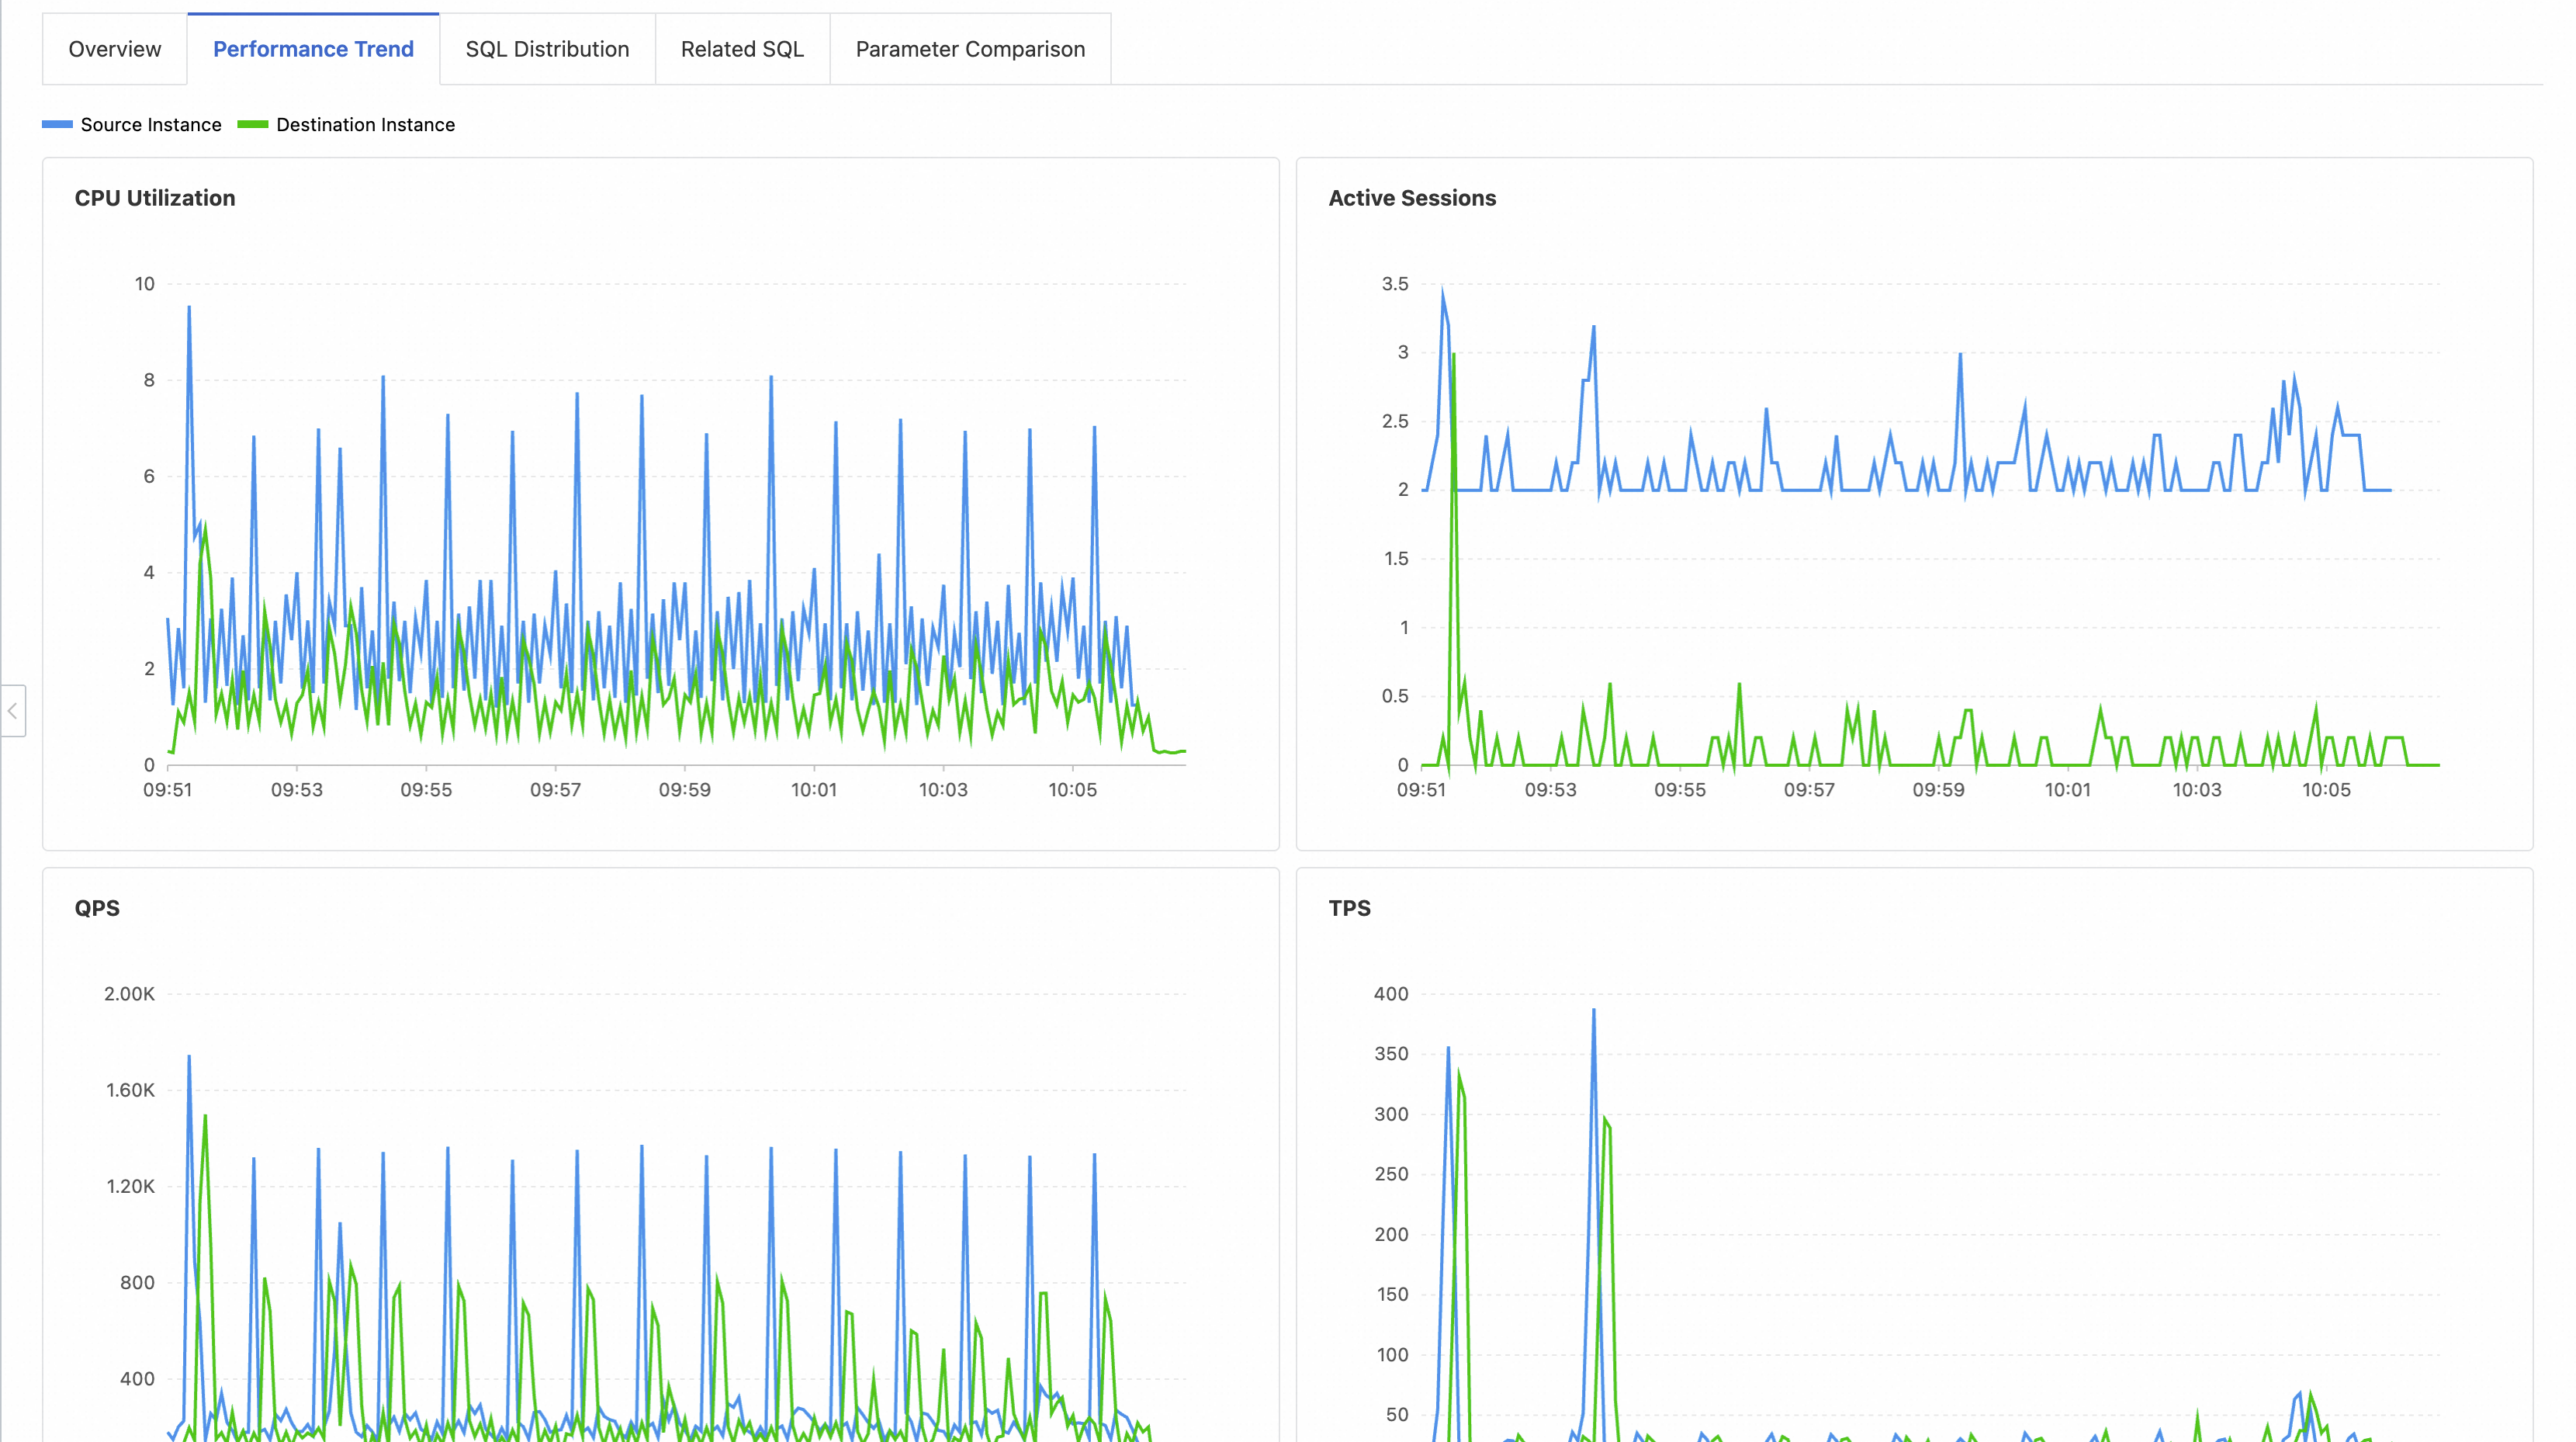
Key points of focus:
Trend consistency: Check if the curves for the destination instance, such as CPU Utilization and Active Sessions, closely follow the shape of the source instance's curves. This indicates its ability to handle a similar load.
Glitches and fluctuations: Look for abnormal spikes or dips in the destination instance's curves. These usually indicate a performance fluctuation or a bottleneck event at a specific time.
Peak and recovery: During the peak load period, evaluate whether the destination instance's CPU Utilization hit a bottleneck too soon and whether its key metrics could return to normal quickly after the load decreased.
SQL Distribution - Instance's SQL health profile
This module provides a high-level view of the overall execution time distribution and errors for SQL statements. It helps you understand the "SQL health" of the instance.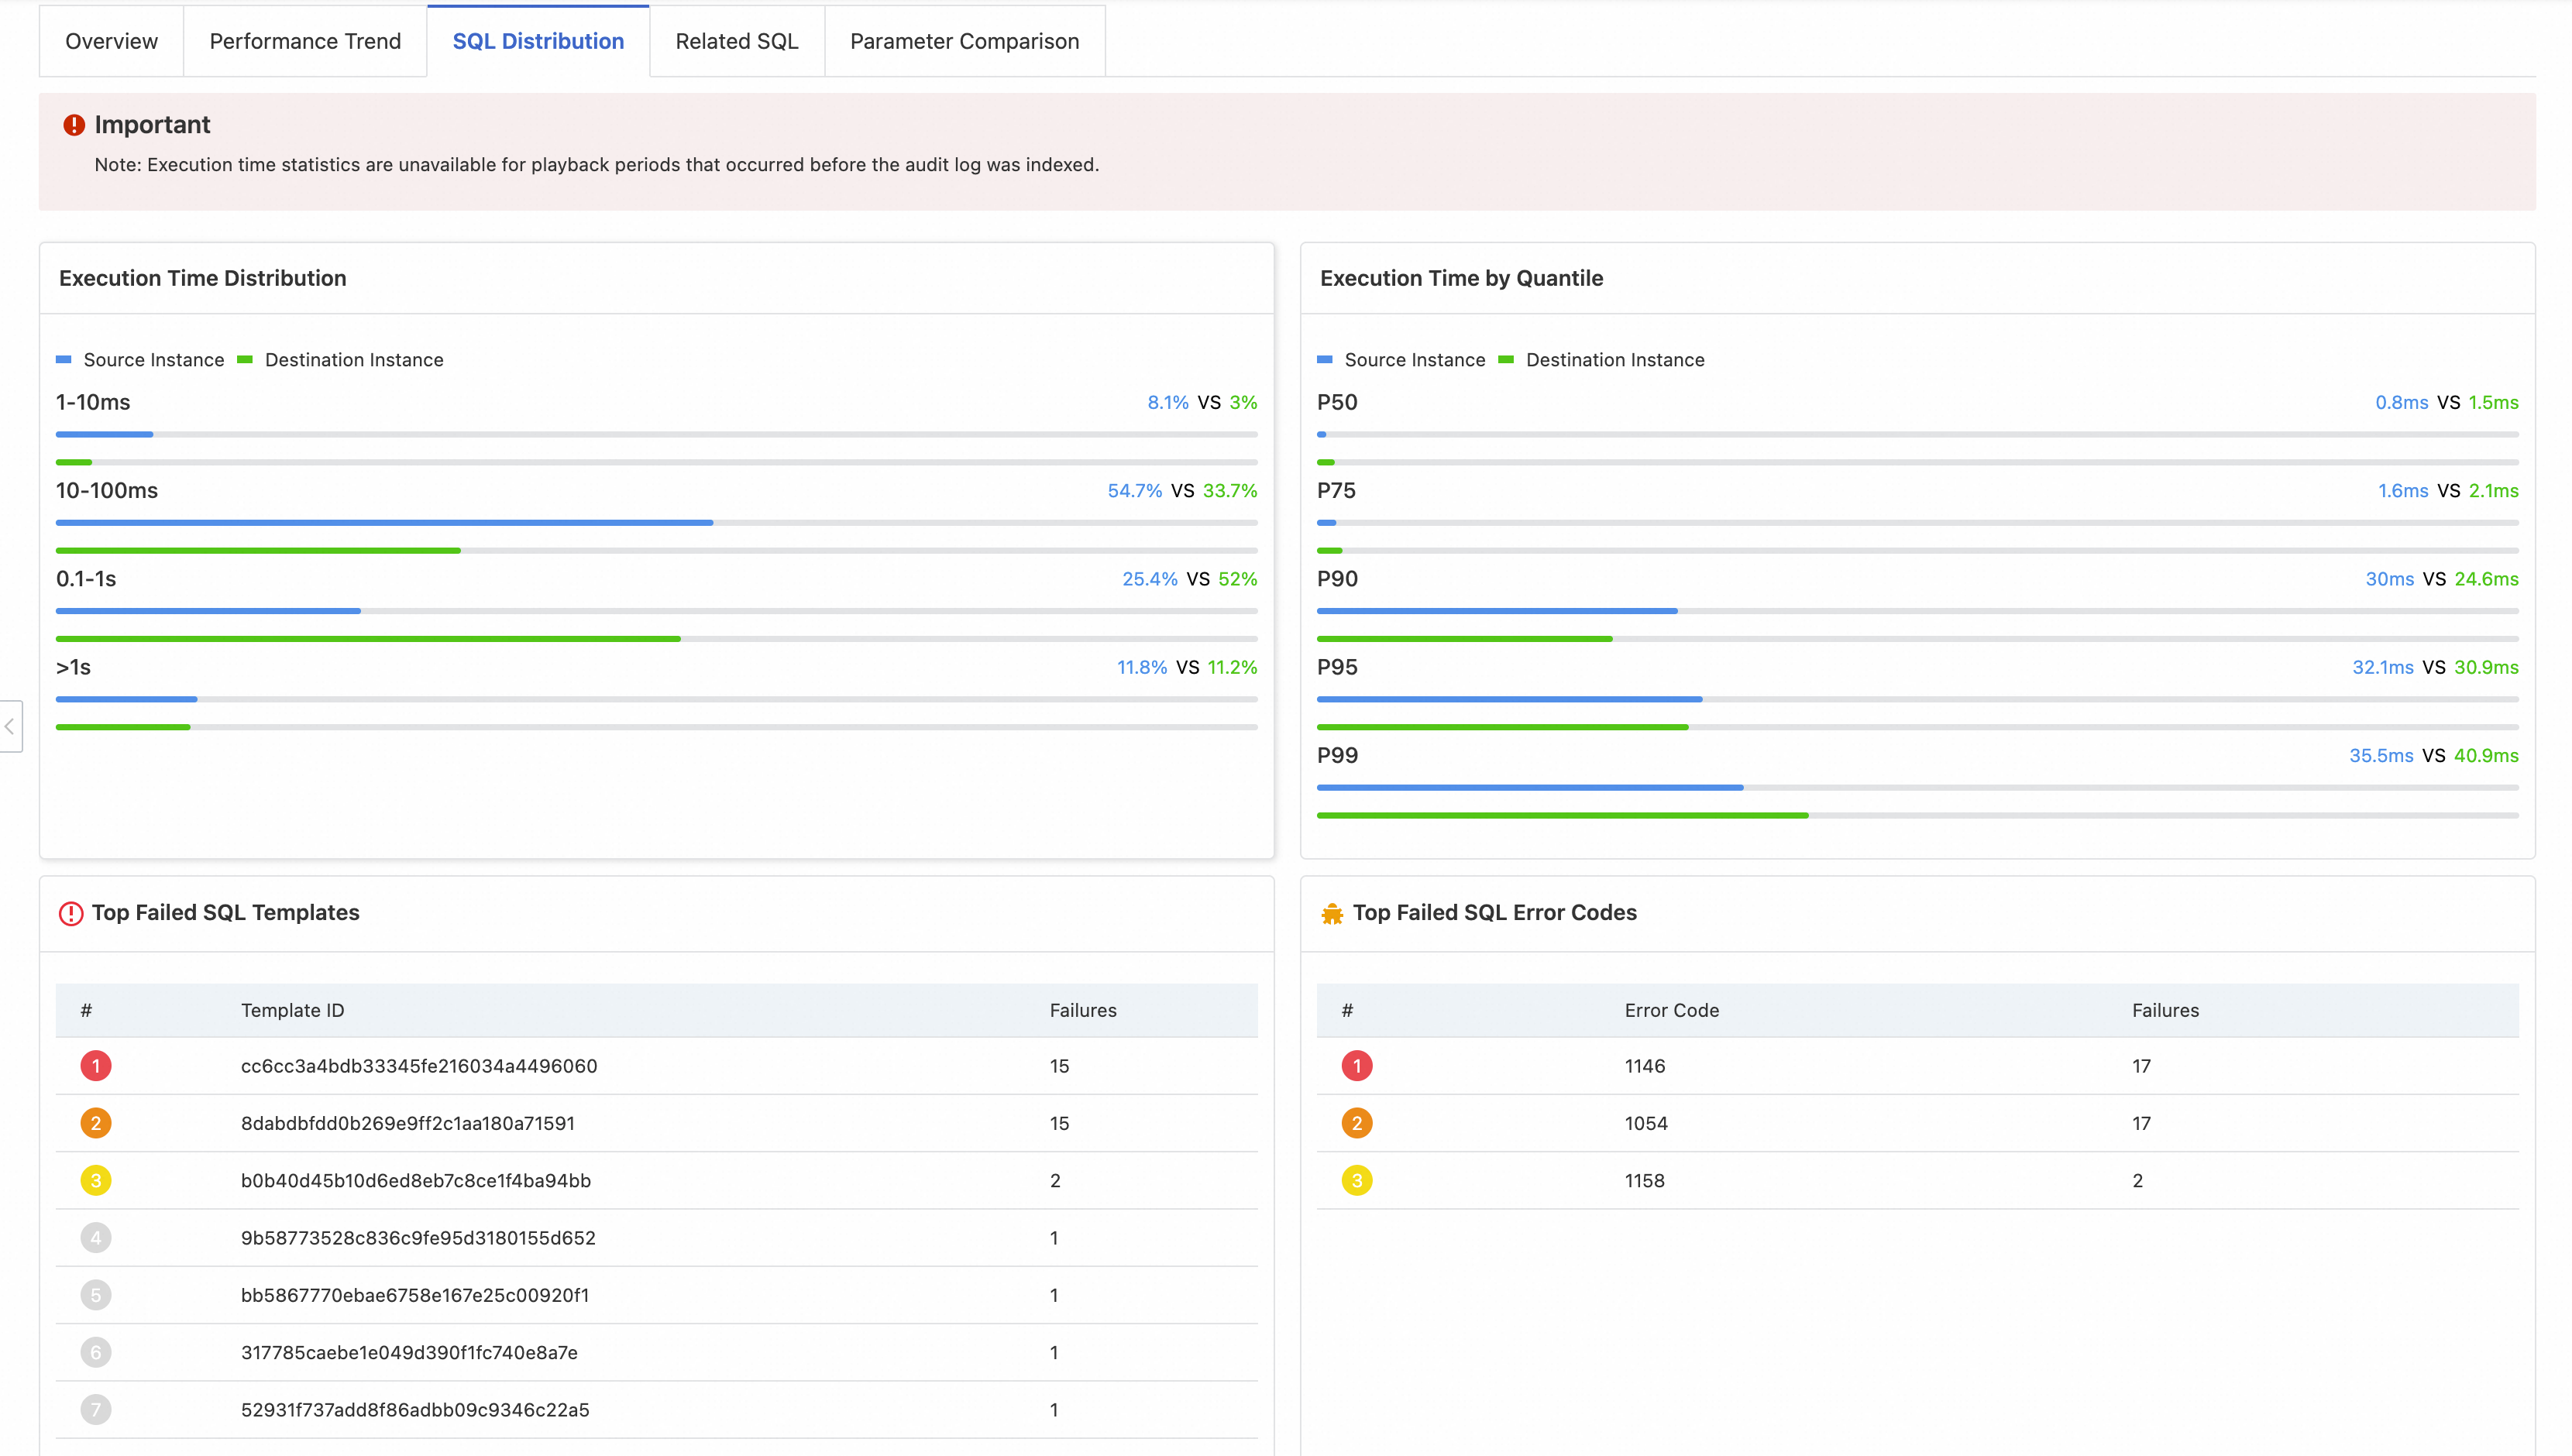
Chart/List | Description | Interpretation and points of focus |
Execution Time Distribution | A column chart that shows the percentage of SQL statements in different execution duration ranges. | Evaluate overall SQL quality. |
Execution Time by Quantile | Shows the latency at key percentiles. | Quantify latency levels. |
Top Failed SQL Templates | Shows the SQL templates that failed most often. | Pinpoint common errors. |
Top Failed SQL Error Codes | Shows the error codes that occurred most often. |
Note: If the traffic playback is performed before the audit log index for the source instance is created, some statistics in this module might be missing.
Related SQL - Per-query performance comparison
This is the most specific and actionable module in the report. It lists performance comparison data for each SQL template. Developers and DBAs use this data as the primary basis for SQL optimization.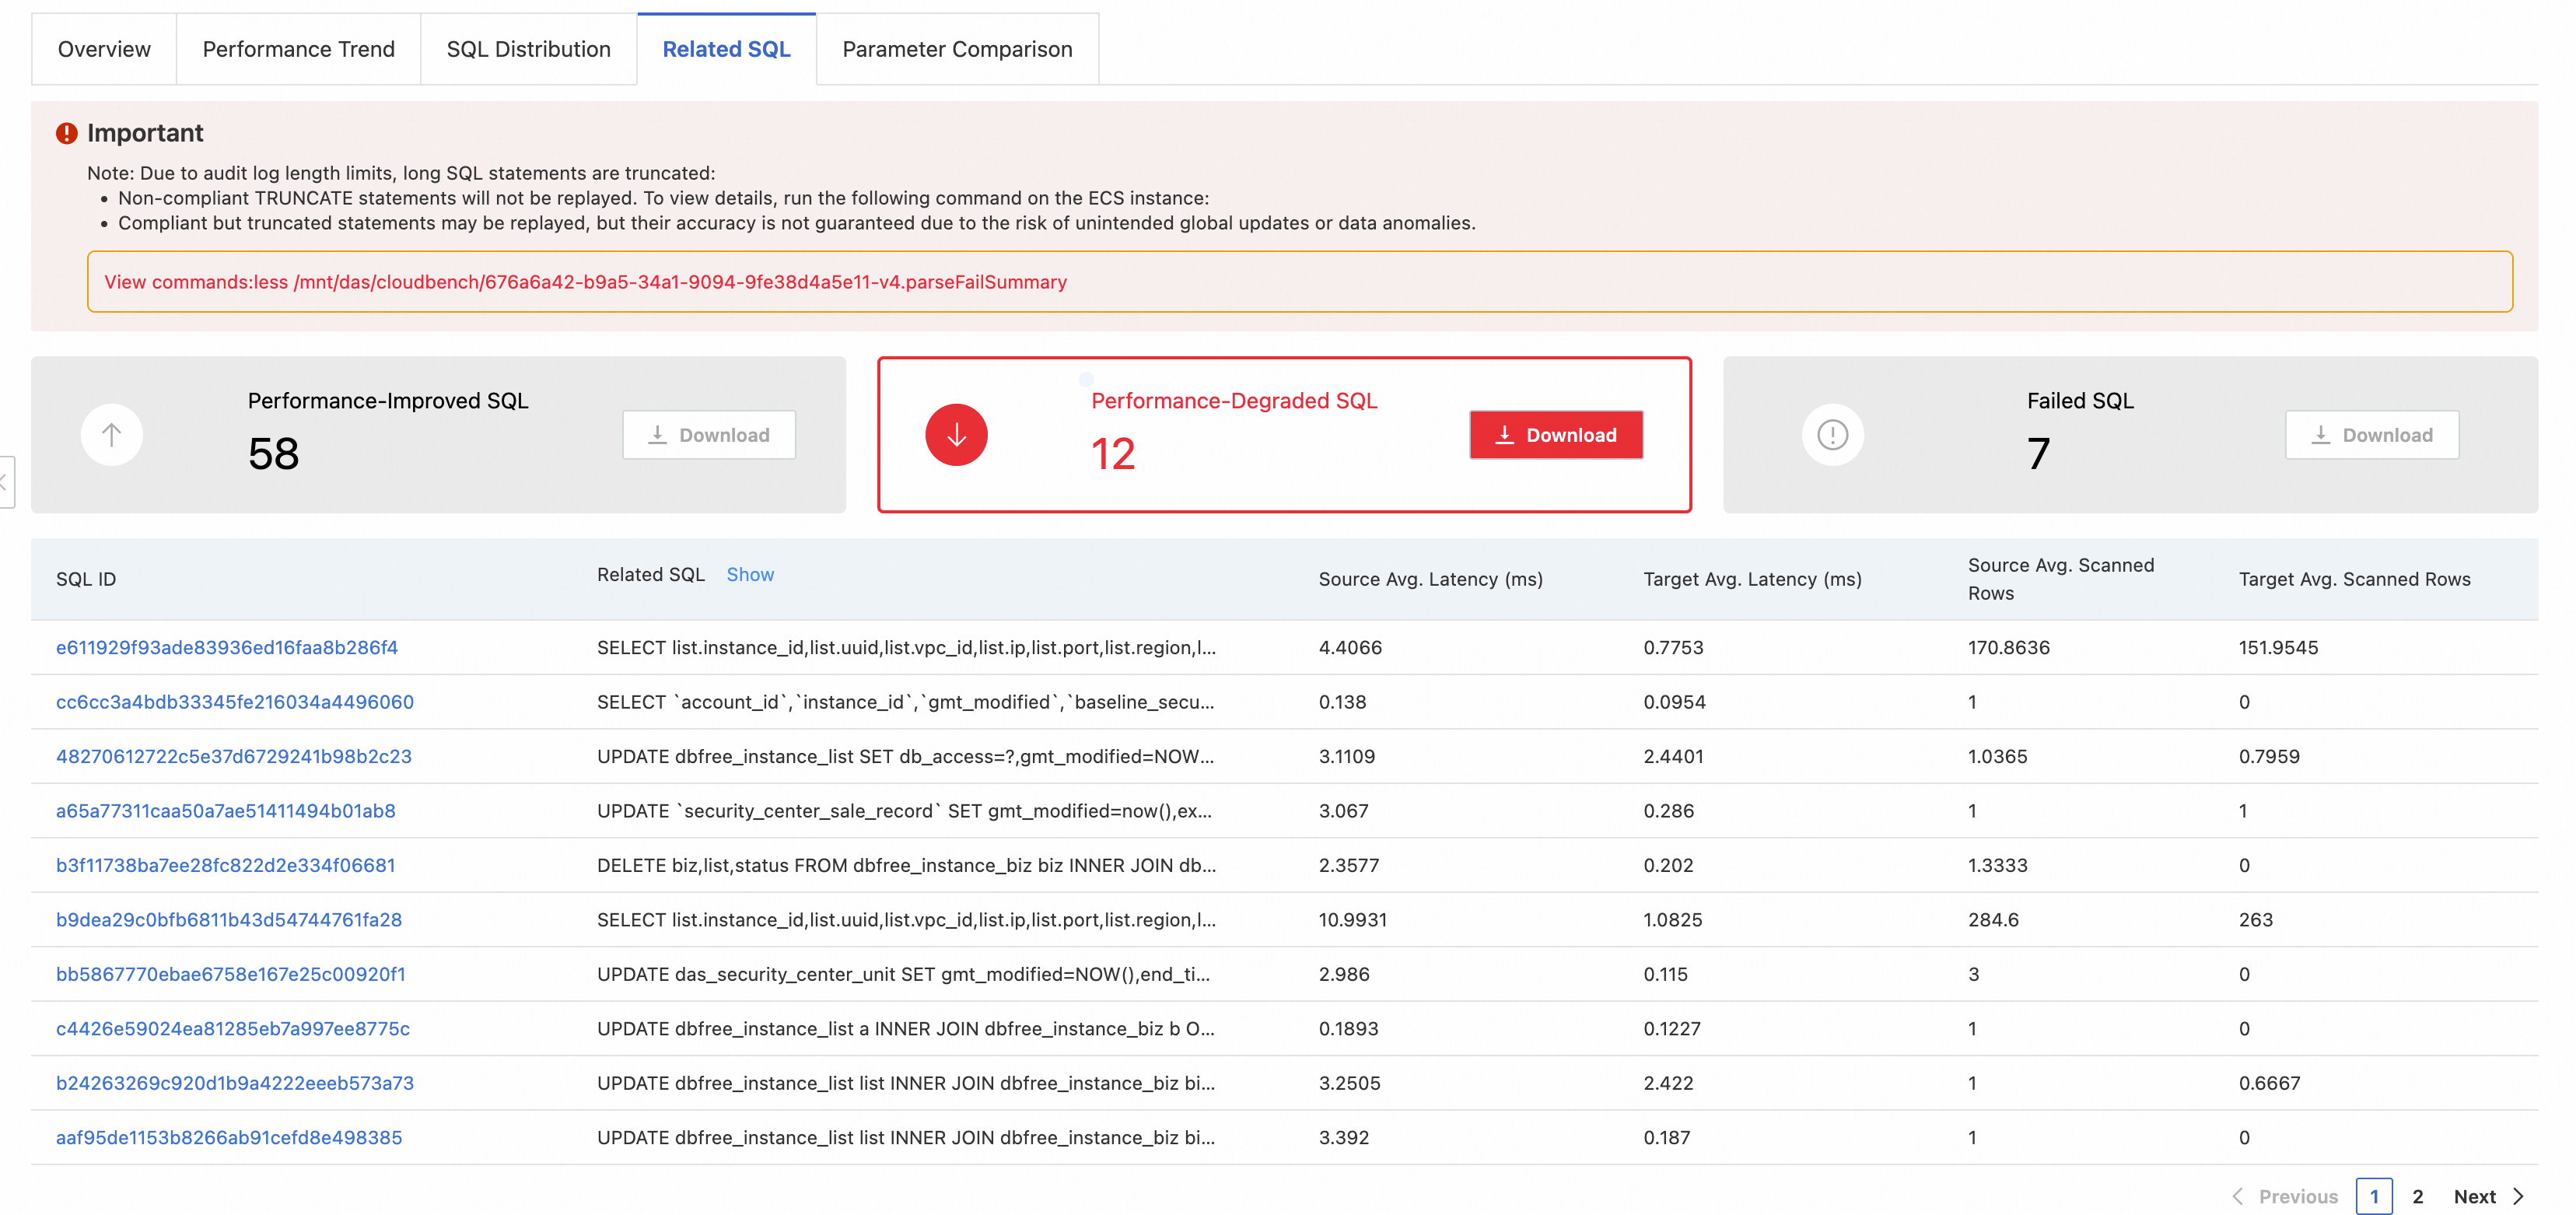
Core features:
Categorization and statistics: All SQL templates are divided into three categories: Performance-improved SQL, Performance-degraded SQL, and Failed SQL. This module provides counts and lets you download the lists.
Detailed data: The table lists key information for each SQL template. This includes the average response time and the average number of scanned rows for both the source and destination instances.
Failure reason: For failed SQL statements, the error code is displayed directly.
Optimization steps:
Prioritize Failed SQL: Check the error codes to resolve critical issues such as syntax errors, permission issues, or data inconsistencies.
Focus on analyzing the Performance-degraded SQL: This is the core of performance optimization. By comparing the execution duration and the number of scanned rows for both instances, you can usually locate the problem quickly (for example, an invalid index on the destination instance can cause a sharp increase in the number of scanned rows).
Learn from the Performance-improved SQL by analyzing why these SQL statements perform better on the destination instance. The performance may have improved because of a new version of the optimizer, better parameter settings, or hardware advantages. You can apply these insights to other optimization tasks.
Parameter Comparison - Configuration root cause of performance differences
When you find a performance difference, this module helps you quickly check whether it is caused by different database configuration parameters.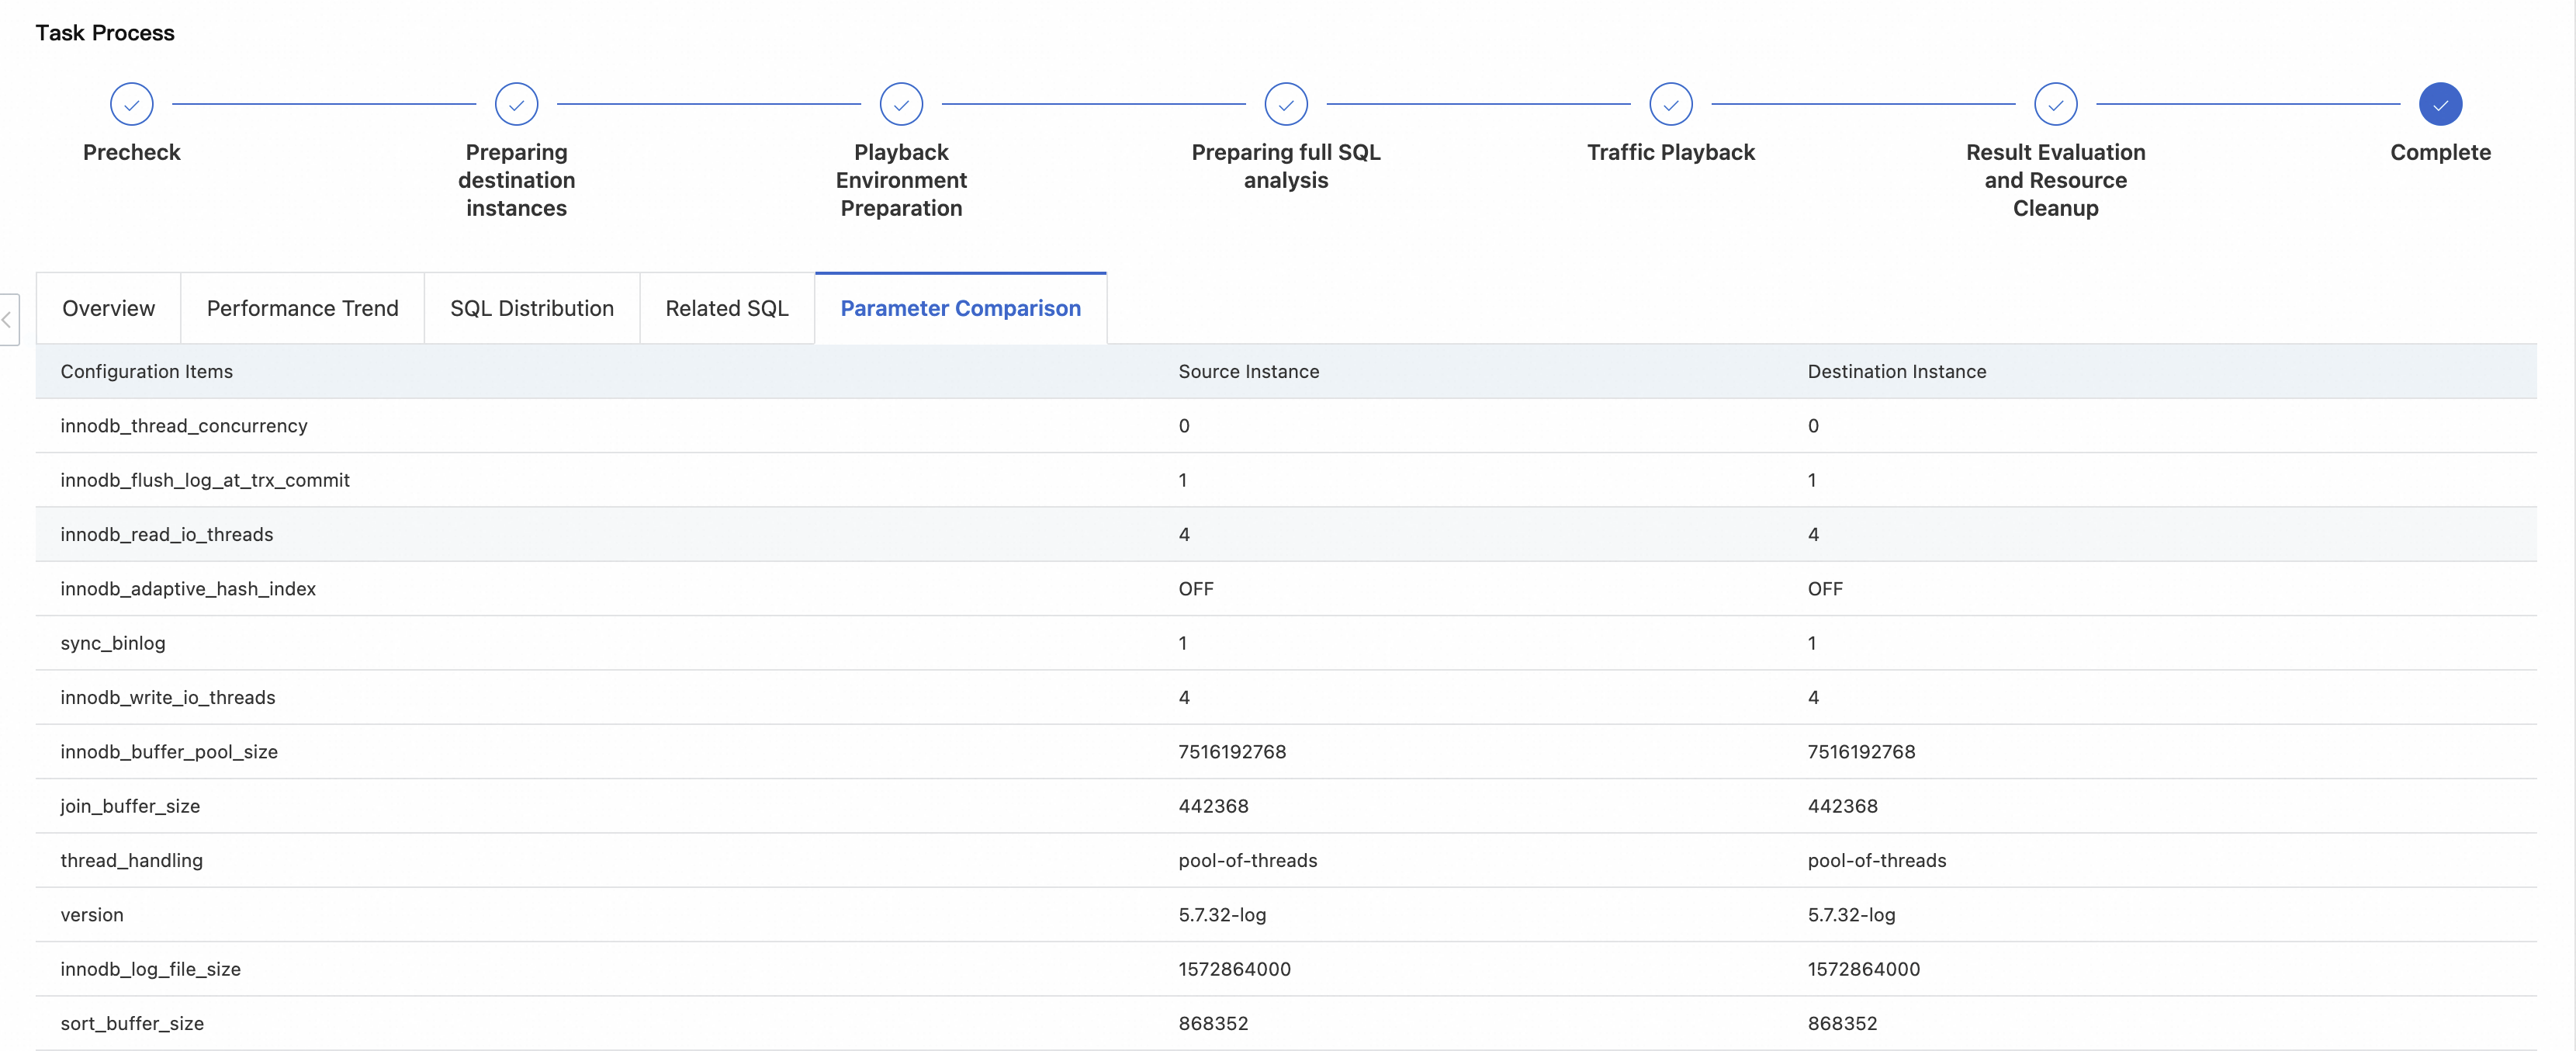
Display: This module displays all database parameters for both instances side-by-side. It highlights parameters with different values.
Common key parameters that affect performance:
Memory-related:
innodb_buffer_pool_size,join_buffer_sizeI/O-related:
innodb_flush_log_at_trx_commit,sync_binlog,innodb_read_io_threadsConcurrency-related:
innodb_thread_concurrency,thread_handlingDatabase version: The
versionitself is also an important "parameter".
Comparing these differences often explains why the performance of the destination instance differs from the source instance.
Best practices
Go from a macro to a micro view. First, obtain a general understanding from the Overview and Performance Trend modules. Then, use the SQL Distribution, Related SQL, and Parameter Comparison modules to dive into specific SQL statements and configuration details.
Use association analysis. Correlate the time points of performance fluctuations found in the Performance Trend module with the slow or failed SQL statements from the SQL Distribution and Related SQL modules. This helps you find the specific cause of the fluctuation.
Verify parameter impact. If you find that a key parameter is inconsistent in the Parameter Comparison module, try changing the parameter on the destination instance to match the source instance. Then, run the traffic playback again. This helps you verify whether that parameter is the root cause of the performance difference.
Focus on degradation, not absolute values. A SQL statement might execute in only 50 ms on the destination instance. However, if it takes only 5 ms on the source instance, its performance is severely degraded. This type of SQL statement requires close attention.