The Performance Trends feature in Database Autonomy Service (DAS) offers extensive performance metrics and powerful diagnostic tools. It automatically detects events on your database instance, performs a diagnosis, and provides root cause analysis with recommendations. You can also run a manual diagnosis on a specific time range for a comprehensive health overview of your instance.
Prerequisites
The target database instance must be connected to DAS with a normal connection status.
Feature overview
-
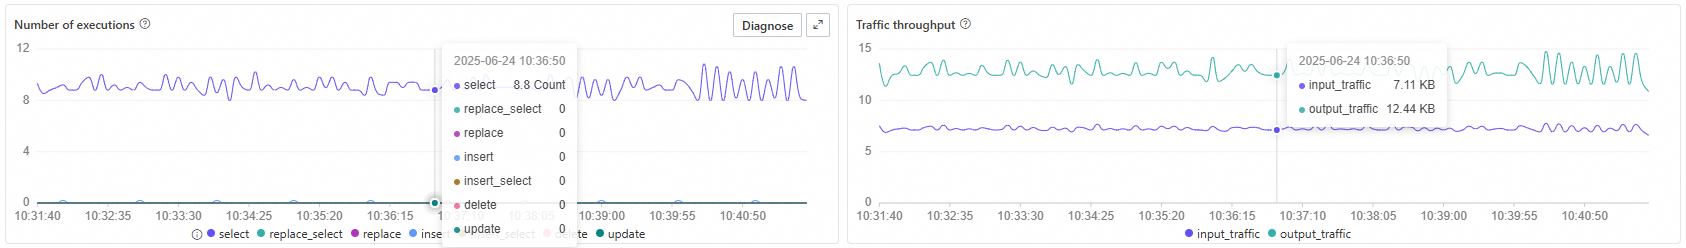
Performance Trends includes metrics such as TPS, QPS, and throughput.
-
The data granularity of metrics in Performance Trends depends on the selected time range. The granularity becomes coarser as the time range increases.
Procedure
Log on to the DAS console.
In the navigation pane on the left, click .
Find the target instance and click the instance ID to open the instance details page.
-
In the left-side navigation pane, click Dashboard.
-
Node
For a cluster, you can choose to display metrics for a Standalone or Multi-Node.
-
Real-time mode
To the left of the time selector are a blue Play icon, a Last 10 minutes preset, and the specific start and end times.
Click the
 icon on the right side of the time selector and then click OK in the subsequent dialog box to enable real-time mode and view live metrics.
Click the
 icon on the right side of the time selector to turn off real-time mode.
 -
Monitoring view
You can select a metrics dashboard. Currently, only the DAS standard view is supported.
-
Data granularity
The available options are 5 seconds, 30 seconds, and minute.
You can select a data granularity to view metrics at different levels of detail.
-
Columns
Click the Columns drop-down list to change the number of charts displayed per row.
-
Compact display
Enable the Compact Display switch for a more condensed view.
-
Linked cursors
Enable the linked cursors toggle. When you hover over one chart, cursors appear on all other charts to show data for the same point in time.
-
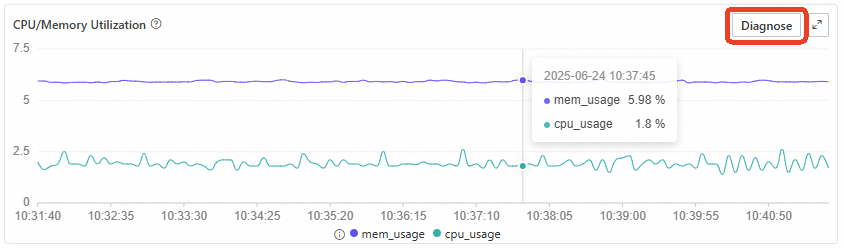
Diagnosis
Click the Diagnose button in the upper-right corner of the chart area to run a diagnosis on the current view.
After the diagnosis completes, the panel displays an overall status, such as Normal, and a summary message like "0 issues found". Results are categorized under four items: resource, session, slow request, and all requests. A green checkmark indicates a normal status for an item. To run the diagnosis again, click Re-diagnose. For more information, click the Details link next to any item.
-