Database Autonomy Service (DAS) automatically detects slow queries and inefficient SQL statements, diagnoses their root causes, and applies fixes—without manual intervention. It reduces query latency and lowers resource consumption by rewriting SQL statements and adjusting index usage.
Why manual SQL optimization breaks down
Database administrators (DBAs) and developers face a compounding problem: SQL workloads are not static. Business iteration, data distribution shifts, hot spot changes, and database version upgrades constantly reshape performance profiles. Keeping up requires disproportionate time and headcount.
Manual optimization has two structural weaknesses tied to two time points:
T1 — when a performance exception is detected and optimization begins
T2 — when the fix is applied and the instance returns to normal
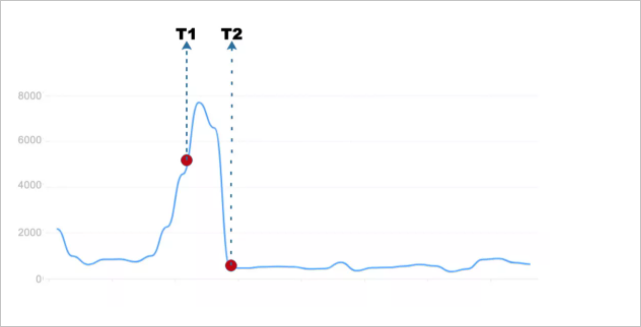
In traditional workflows, T1 arrives late—often after the problem has been degrading user experience for an extended period. The gap between T1 and T2 depends entirely on manual effort, during which failure risk accumulates. As data volumes grow, this model breaks down: adding more people does not solve the problem.
Building automated SQL optimization that closes this loop is difficult across six dimensions:
| Dimension | Challenge |
|---|---|
| Accuracy | Detecting the right exceptions at the right time, without noise |
| Diagnostics | Generating actionable, high-confidence optimization suggestions |
| Security | Ensuring online changes cannot destabilize production |
| Comprehensiveness | Tracking optimization outcomes across multiple dimensions in real time |
| Linkage | Coordinating SQL throttling and SQL optimization to address both symptoms and root causes |
| Scale | Supporting automatic optimization across hundreds of thousands to millions of servers |
How it works
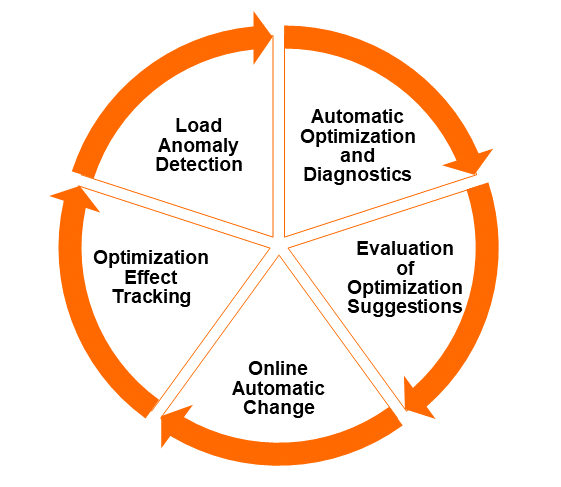
DAS automatic SQL optimization runs as a five-stage closed loop. Each stage feeds the next, eliminating the gaps that manual processes leave open.
Stage 1: Detect
DAS continuously monitors workloads for three issue types: new SQL statements that cause slow queries, SQL statements whose performance has deteriorated, and consistently inefficient SQL statements. Detection fires under three conditions:
Scheduled analysis — slow queries are analyzed offline on a regular O&M time window cadence
Real-time deterioration — the workload exception detection algorithm identifies performance drops as they happen; for complex incidents, automatic SQL throttling and automatic SQL optimization activate together
Workload changes — when business SQL is published or unpublished, DAS detects that data volume or query distribution has shifted beyond what existing indexes can handle
Stage 2: Diagnose
Problematic SQL statements are sent to the diagnostics engine, which uses a cost-based model—the same approach used by database optimizers—to evaluate every possible fix. Suggestions include creating optimal indexes, rewriting SQL statements, and recommending engines. Each suggestion is scored by execution cost, producing a ranked, quantitative result rather than a heuristic guess.
The SQL diagnostics and optimization feature has run in production at Alibaba Group for years, diagnosing approximately 50,000 SQL statements per day across the group's business applications. The diagnostic success rate has remained above 98%, and the slow query recommendation rate above 75%.
Stage 3: Plan
DAS automatically assesses the risk of each suggestion, generates a canary release plan, and schedules optimization tasks based on the current workload and instance profile. No manual scheduling is required.
Stage 4: Apply
Changes are released in the O&M time window. For sharding scenarios with large data volumes, the canary release plan applies changes in batches. During execution, DAS monitors replication lag between primary and secondary instances. If lag exceeds the configured threshold, index change tasks are immediately suspended—with only one change task running per instance at any time.
Stage 5: Verify and commit
After changes take effect, the decision engine starts a tracking task covering both the optimized SQL statements and related SQL templates. It uses a decision tree model to compare performance metrics before and after optimization, tracking full SQL statements and those causing slow queries.
The default tracking cycle is 24 hours. If performance deteriorates at any point, changes are automatically rolled back. If no rollback occurs within 24 hours, the optimization is marked successful and actual optimization benefits are calculated.
Event-driven coordination across the loop
The DAS Event Center ties these stages together. Exception events—from the alerting system, real-time detection, offline analysis, or workload monitoring—all flow into the Event Center. After diagnostics, DAS generates a new optimization event and routes it back to the Event Center to drive the next stage.
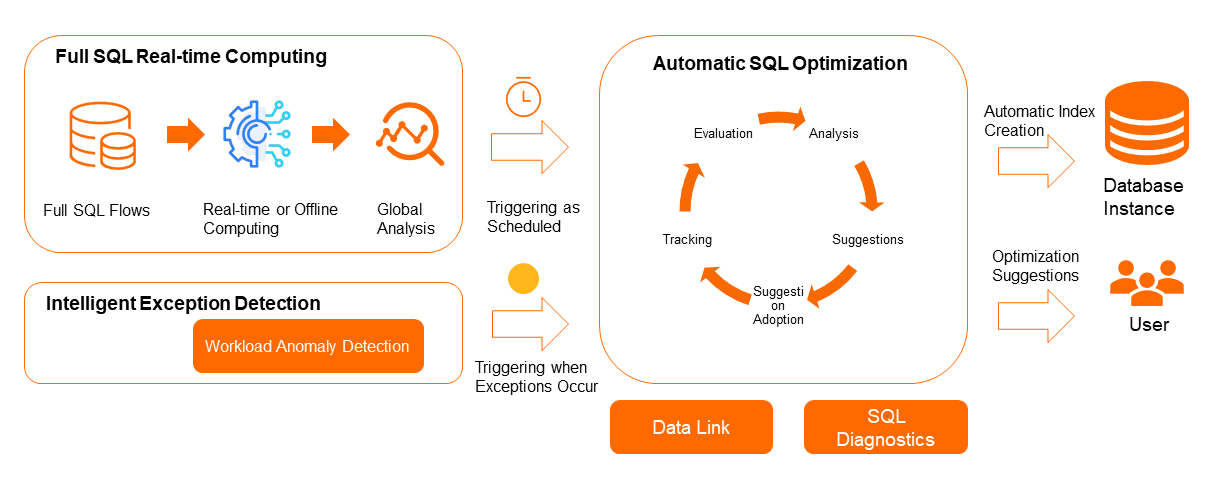
Automatic SQL optimization of DAS is a data-driven closed loop. The preceding figure illustrates the entire process in a simple way.
When you enable the autonomy service in the DAS autonomy center, you can choose whether optimization suggestions are applied automatically or require your approval before proceeding.
Change safety
Automated changes to production databases carry inherent risk. DAS addresses this through three layered safeguards:
Pre-change checks
Changes only proceed when all of the following metrics fall within safe ranges:
Replication lag between primary and secondary instances
Database workload
Tablespace usage
Changes are restricted to the configured O&M time window, keeping modifications away from peak traffic periods.
Canary release
For sharding scenarios involving large data volumes, DAS automatically generates a canary release plan that applies changes in batches rather than all at once. During execution, DAS monitors replication lag continuously. If lag exceeds the configured threshold, all index change tasks for that instance are suspended immediately. Only one change task runs per instance at any time.
Automatic rollback
After each change, the decision engine tracks the performance of optimized SQL statements and related SQL templates using a decision tree model. It compares metrics before and after optimization across full SQL statements and slow query SQL. If performance deteriorates at any point during the 24-hour tracking window, changes are automatically rolled back—no manual intervention required.
Supported database engines
Automatic SQL optimization supports the following database engines: ApsaraDB RDS for MySQL, PolarDB for MySQL, and ApsaraDB RDS for PostgreSQL.