On the file system details page in NAS console, you can view the information about a CPFS file system, such as the storage type, resource usage, version, protocol type, and version number.
View the resource usage of a file system
Log on to the NAS console.
In the left-side navigation pane, choose File System > File System List.
In the top navigation bar, select a region.
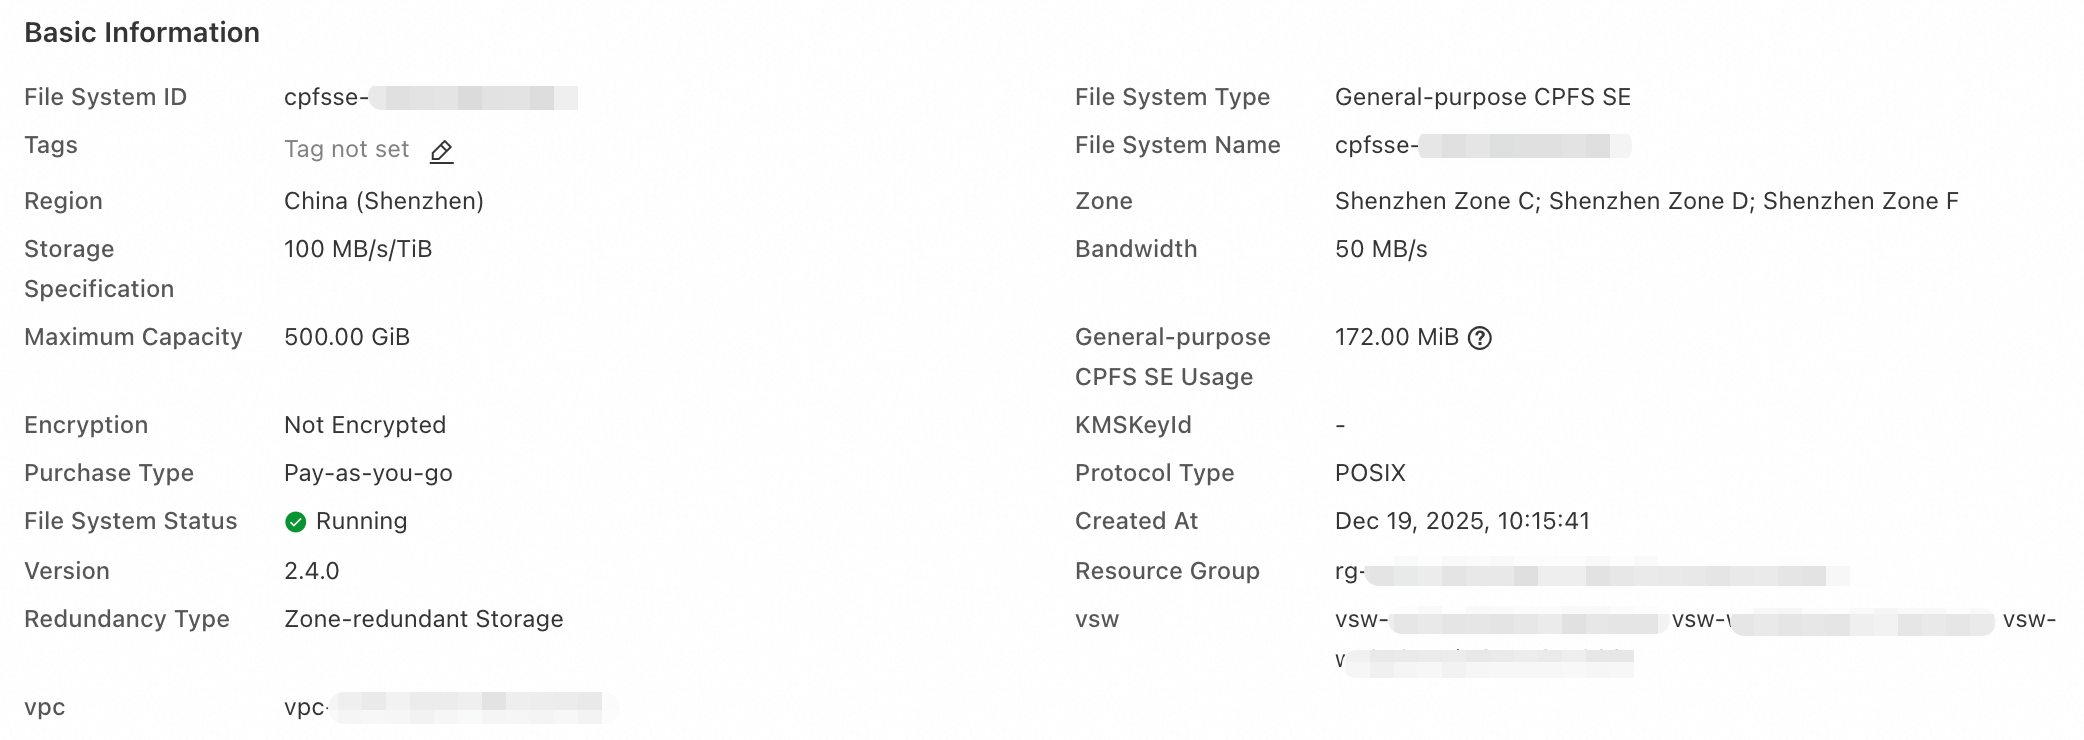
Find the file system whose resource usage you want to view and click the ID of the file system or click Manage in the Actions column. On the details page, view the used storage and the maximum capacity of the file system.
View the list of file systems
Log on to the NAS console.
In the left-side navigation pane, choose File System > File System List.
In the top navigation bar, select a region.
On the File System List page, view a list of all file systems in a region. You can also modify the name of a file system.
View the version number of a file system
Log on to the NAS console.
In the left-side navigation pane, choose File System > File System List.
In the top navigation bar, select a region.
On the File System List page, click the desired file system.
On the Basic Information tab, view the version number of the file system.
View the performance metrics of a file system
View the performance monitoring data of a file system in two ways.
File system details page
Log on to the NAS console.
In the left-side navigation pane, choose File System > File System List.
On the File System List page, click the target file system.
On the details page of the file system, click Performance Monitoring.
On the Performance Monitoring tab, view the performance metrics such as IOPS and throughput.
If you use the Network File System (NFS) protocol to access the CPFS file system, you can also view the NFS IOPS.
View the Performance Monitoring page
Log on to the NAS console.
In the left-side navigation pane, choose > .
In the top navigation bar, select a region.
On the page, perform the following steps to view the performance monitoring details of a specific file system.
From the File System Type drop-down list, select CPFS.
Select the ID of the file system from the File System ID drop-down list.
Select a time range, such as 1 Hour, 1 Day, 7 Days, 14 Days, Current Month, or Last Month. You can also specify a custom time range. The time range cannot exceed 30 days.
The Performance Monitoring page displays charts for metrics related to IOPS, throughput, latency, and metadata queries per second (QPS).
If you access the file system using the NFS protocol, the page displays performance monitoring charts for NFS.
Note If a chart displays No Data, it indicates that the file system has not received requests from clients or that the corresponding service is not enabled.
To generate monitoring data for write throughput, run the fio command on the client where the CPFS file system is mounted. For example, assume that the CPFS file system is mounted to the /mnt directory. For more information about performance tests for file systems, see Performance Testing.
fio -direct=1 -ioengine=libaio -iodepth=1 -rw=write -bs=1m -size=1G -numjobs=256 -runtime=600 -time_based=1 -group_reporting -directory="/mnt" -name=Seq_Write_Testing
View the capacity of a file system
Monitor the capacity of the CPFS file system in the following two ways.
View file system details
Log on to the NAS console.
In the left-side navigation pane, choose File System > File System List.
On the File System List page, click the target file system.
On the details page of the file system, click .
On the Capacity Monitoring tab, view the capacity metrics such as storage capacity and number of files.
View information on the Capacity Monitoring page
Log on to the NAS console.
In the left-side navigation pane, choose Monitoring Audit > .
In the top navigation bar, select a region.
On the Capacity Monitoring page, perform the following steps to view the capacity monitoring details of the CPFS file system:
From the File System Type drop-down list, select CPFS.
Select the ID of the file system from the File System ID drop-down list.
Select a time range. You can select 1 Hour, 1 Day, 7 Day, 14 Days, Current Month, or Last Month. You can also specify a custom time range. The maximum time range is 30 days. To view capacity data for more than one month, see Resource usage and bills.
The Capacity Monitoring page displays the Storage Space and the Number of Files charts.
Storage Space: shows the total storage space and data volume.
Number of Files: shows the maximum number of files, the number of allocated files, the number of used files, the number of files allocated by filesets, the number of files used by filesets, the number of files allocated by the root fileset, and the number of files used by the root fileset.
Note In a file system, all files other than those in independently created filesets belong to the root fileset.
For more information about the metrics, see Metrics.
View the storage redundancy type of a file system
Log on to the CPFS console.
In the left-side navigation pane, choose File System > File System List.
In the top navigation bar, select a region.
On the File System List page, click the target file system.
On the Basic Information page of the file system, view the redundancy type of the file system.