OpenClaw works with the openclaw-cms-plugin and diagnostics-otel plugins to report complete AI agent traces and runtime metrics to AI Application Observability in Cloud Monitor 2.0. The openclaw-cms-plugin reports traces and follows the OpenTelemetry GenAI semantic conventions to generate a structured trace for each request. The diagnostics-otel plugin reports metrics by collecting real-time operational data such as token consumption rates, queries per second (QPS), and queue depth. After you enable these plugins, you can view comprehensive monitoring data for your OpenClaw application in Cloud Monitor 2.0, including complete traces, model invocation latency, token consumption details, and tool call details.
Limits
Limit | Description |
OpenClaw version | v26.2.19 or later. Earlier versions do not include the |
Reporting protocol | Only HTTP/Protobuf is supported. HTTP/JSON and gRPC are not supported. |
Data type | Only trace and metric data are supported. Log data is not supported. |
Cloud Monitor service | You have activated Cloud Monitor 2.0 and created a workspace. |
Step 1: Get the integration command
Before you install the plugins, obtain the integration command from the Cloud Monitor 2.0 console.
Log on to the Cloud Monitor 2.0 console and select your target workspace.
In the navigation pane on the left, click Integration Center.
In the AI Application Observability section, click the OpenClaw card.
In the parameter configuration section, enter an application name, select a connection method, and then click Get next to LicenseKey.
The page generates an integration command based on the specified parameters. You can click the copy icon in the upper-right corner to copy the command. The command contains endpoint information, such as the endpoint URL and license key. If you plan to perform a manual installation, record the following information:
Parameter
Description
Example
Endpoint
OTLP trace and metric reporting endpoint
https://proj-xtrace-xxx.cn-hangzhou-intranet.log.aliyuncs.com/apm/trace/opentelemetry/v1/traceshttps://proj-xtrace-xxx.cn-hangzhou-intranet.log.aliyuncs.com/apm/trace/opentelemetry/v1/metrics
x-arms-license-key
LicenseKey for data write authentication
d95vgxi0cn@xxxxxx-arms-project
Simple Log Service project name
proj-xtrace-xxx-cn-hangzhoux-cms-workspace
Cloud Monitor 2.0 workspace ID
default-cms-xxx-cn-hangzhouserviceName
The application name.
openclaw-xxx
Step 2: Install the integration
Method 1: One-click installation (recommended)
Open a terminal on the machine where OpenClaw is installed, paste the copied installation command, and run it.
curl -fsSL https://arms-apm-cn-hangzhou-pre.oss-cn-hangzhou.aliyuncs.com/openclaw-cms-plugin/install.sh | bash -s -- \
  --endpoint "https://YOUR-ENDPOINT-URL" \
  --x-arms-license-key "YOUR-LICENSE-KEY" \
  --x-arms-project "YOUR-PROJECT" \
  --x-cms-workspace "YOUR-WORKSPACE" \
  --serviceName "YOUR-SERVICE-NAME"
The installation script automatically performs the following actions:
Checks the environment for Node.js, npm, and the OpenClaw CLI.
Downloads and extracts the
openclaw-cms-pluginto the OpenClaw extensions directory.Installs the runtime dependencies for the plugin.
Locates the
diagnostics-otelextension and automatically installs its dependencies if they are not already installed.Updates the
openclaw.jsonfile with the configurations for both plugins.Restarts the gateway to apply the changes.
The following output indicates a successful installation:
[INFO]  Checking prerequisites...
[OK]    Node.js v24.14.0
[OK]    npm 11.9.0
[OK]    OpenClaw CLI found
[INFO]  Downloading plugin...
[OK]    Downloaded
[INFO]  Extracting...
[OK]    Extracted
[INFO]  Installing npm dependencies...
[OK]    Dependencies installed
[INFO]  Locating diagnostics-otel extension...
[OK]    Found diagnostics-otel at: /home/.../extensions/diagnostics-otel
[OK]    diagnostics-otel dependencies already present
[INFO]  Updating config...
[OK]    Config updated
[INFO]  Restarting OpenClaw gateway...
[OK]    Gateway restarted

════════════════════════════════════════════════════
  ✅ openclaw-cms-plugin installed successfully!
════════════════════════════════════════════════════
Installation parameters
Parameter | Required | Description |
| Yes | The OTLP data reporting endpoint. Obtain this value from the Integration Center in the Cloud Monitor 2.0 console. |
| Yes | The license key for authenticating data writes. |
| Yes | The name of the Simple Log Service project. |
| Yes | The ID of the Cloud Monitor 2.0 workspace. |
| Yes | The service name for reporting. This name appears as the application name in the application list of Cloud Monitor 2.0. |
| No | A custom download URL for the tarball. |
| No | A custom installation directory. |
| No | Skips the configuration for diagnostics-otel. This enables trace reporting but disables metric reporting. |
Method 2: Manual installation
To manually install the plugins, follow these steps.
1. Download and extract the plugin
curl -fsSL -o openclaw-cms-plugin.tar.gz https://arms-apm-cn-hangzhou-pre.oss-cn-hangzhou.aliyuncs.com/openclaw-cms-plugin/openclaw-cms-plugin.tar.gz
tar -xzf openclaw-cms-plugin.tar.gz
cd openclaw-cms-plugin
npm install --omit=dev
2. Enable the diagnostics-otel plugin
openclaw plugins enable diagnostics-otel3. Edit the configuration file
Edit the ~/.openclaw/openclaw.json file and add the following configuration. Replace the placeholders with the endpoint information that you obtained in Step 1.
{
  "plugins": {
    "allow": ["openclaw-cms-plugin", "diagnostics-otel"],
    "load": {
      "paths": ["<PATH-TO-OPENCLAW-CMS-PLUGIN>"]
    },
    "entries": {
      "openclaw-cms-plugin": {
        "enabled": true,
        "config": {
          "endpoint": "<YOUR-ENDPOINT>",
          "headers": {
            "x-arms-license-key": "<YOUR-LICENSE-KEY>",
            "x-arms-project": "<YOUR-ARMS-PROJECT>",
            "x-cms-workspace": "<YOUR-WORKSPACE-ID>"
          },
          "serviceName": "<YOUR-SERVICE-NAME>"
        }
      },
      "diagnostics-otel": {
        "enabled": true
      }
    }
  },
  "diagnostics": {
    "enabled": true,
    "otel": {
      "enabled": true,
      "endpoint": "<YOUR-ENDPOINT>",
      "protocol": "http/protobuf",
      "headers": {
        "x-arms-license-key": "<YOUR-LICENSE-KEY>",
        "x-arms-project": "<YOUR-ARMS-PROJECT>",
        "x-cms-workspace": "<YOUR-WORKSPACE-ID>"
      },
      "serviceName": "<YOUR-SERVICE-NAME>",
      "traces": false,
      "metrics": true,
      "logs": false
    }
  }
}
4. Restart the gateway
openclaw gateway restartMethod 3: Automated installation in a Kubernetes environment
If you deploy OpenClaw in a Kubernetes environment, you can use the following one-click integration method.
Ensure that you have not manually modified the container startup command in your OpenClaw image. If you use an OpenClaw service hosted on Compute Nest, enable the Cloud Monitor observability configurations when you create the service instance in Compute Nest.
Step 1: Install the ARMS agent (ack-onepilot)
-
Log on to the ACK console. On the Clusters page, click the name of the cluster.
In the left-side navigation pane, click Component Management. In the upper-right corner, search for ack-onepilot.
ImportantEnsure that the version of ack-onepilot is 5.2.0 or later.
-
Click Install on the ack-onepilot card.
NoteBy default, the ack-onepilot component supports 1,000 pods. For every additional 1,000 pods in the cluster, you must add 0.5 CPU cores and 512 MB memory for the component.
-
In the dialog box that appears, configure the parameters and click OK. We recommend that you use the default values.
NoteAfter you install ack-onepilot, you can upgrade, configure, or uninstall it on the Add-ons page.
Step 2: Grant ARMS access permissions
ACK managed clusters
If an ARMS addon token does not exist in the ACK managed cluster, manually grant permissions to access ARMS resources. If an ARMS addon token already exists, skip to Step 3: Enable application monitoring for OpenClaw.
If a cluster has ARMS Addon Token, ARMS performs password-free authorization on the cluster. ARMS Addon Token may not exist in some ACK managed clusters. We recommend that you check whether an ACK managed cluster has ARMS Addon Token before you use ARMS to monitor applications in the cluster. If the cluster has no ARMS Addon Token, you must authorize the cluster to access ARMS.
ACK dedicated clusters and registered clusters
ACK dedicated clusters and ACK One registered clusters require two things:
Your Alibaba Cloud account must have the AliyunARMSFullAccess and AliyunSTSAssumeRoleAccess permissions. See Manage permissions for RAM users.
The ack-onepilot component must have an AccessKey pair with ARMS permissions.
Provide the AccessKey pair to ack-onepilot using either of these methods.
Method 1: Specify the AccessKey pair in Helm
Log on to the ACK console. Click Clusters, then click the cluster name.
In the left-side navigation pane, choose Applications > Helm. Click Update next to ack-onepilot.
Replace the
accessKeyandaccessKeySecretvalues with your AccessKey ID and AccessKey secret. Click OK.NoteTo get an AccessKey pair, see Create an AccessKey pair.
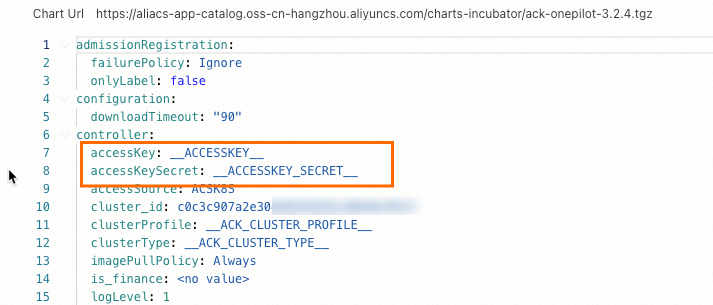
Restart the application Deployment.
Method 2: Use a Kubernetes Secret
Log on to the ACK console. Click Clusters, then click the cluster name.
In the left-side navigation pane, choose Configurations > Secrets. Select the ack-onepilot namespace and create a Secret to store your AccessKey ID and AccessKey secret.
NoteTo get an AccessKey pair, see Create an AccessKey pair.

In the left-side navigation pane, choose Workloads > Deployments. Click the ack-onepilot component (typically named
ack-onepilot-ack-onepilotin theack-onepilotnamespace).In the upper-right corner, click Edit. In the Environment Variables section, add these two variables and reference the Secret values: Click OK.
Environment variable Description ONE_PILOT_ACCESSKEYReferences the AccessKey ID stored in the Secret ONE_PILOT_ACCESSKEY_SECRETReferences the AccessKey secret stored in the Secret 
ACK serverless clusters (ASK) and ECI-integrated clusters
Complete authorization on the Resource Access Authorization page, then restart all pods of the ack-onepilot component.
Step 3: Enable application monitoring for OpenClaw
Log on to the ACK console. In the left navigation pane, click Clusters.
On the Clusters page, click the name of your cluster. In the left navigation pane, click .
On the Deployment page, find the target application and choose
 > Edit YAML from the Actions column.
To create a new application, click Create from YAML.
In the YAML file, add the following
labelsunder spec.template.metadata.labels: apsara.apm/application-type: openclaw # Specifies that this is an OpenClaw application. armsPilotAutoEnable: 'on' armsPilotCreateAppName: "deployment-name" # The display name of the application in ARMS. # armsPilotAppWorkspace: "workspace" # Replace with the current workspace name.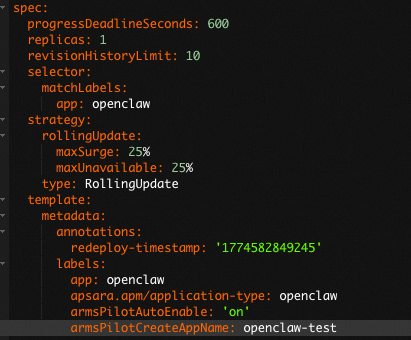
Click Update.
Parameters
openclaw-cms-plugin configuration
Parameter | Type | Required | Description |
| String | Yes | The OTLP data reporting endpoint. Obtain this from the Integration Center in the Cloud Monitor 2.0 console. |
| String | Yes | The license key for authenticating data writes. |
| String | Yes | The name of the Simple Log Service project where trace data is stored. |
| String | Yes | The ID of the Cloud Monitor 2.0 workspace for data reporting. |
| String | Yes | The service name for reporting. This appears as the application name in the application list of Cloud Monitor 2.0. |
diagnostics-otel configuration
Parameter | Type | Required | Description |
| Boolean | Yes | Specifies whether to enable the diagnostics feature. Set the value to |
| Boolean | Yes | Specifies whether to enable OpenTelemetry data export. Set the value to |
| String | Yes | The OTLP data reporting endpoint. The plugin automatically appends |
| String | Yes | The reporting protocol. Only |
| Object | Yes | The authentication headers included in the reporting request. |
| String | Yes | The service name for reporting. We recommend that you use the same |
| Boolean | Yes | Specifies whether to report trace data. We recommend that you set this to |
| Boolean | Yes | Specifies whether to report metric data. Set this to |
| Boolean | Yes | Specifies whether to report log data. Cloud Monitor 2.0 does not support this feature. We recommend that you set this to |
| Number | No | The trace sampling rate. Valid values are 0.0 to 1.0. This applies only to the root span. A value of |
| Number | No | The batch flush interval in milliseconds. The minimum value is |
Step 3: Verify the installation
Run the following command to check whether the plugins are active:
openclaw plugins listThe expected output looks like this:
┌──────────────┬──────────┬──────────┬────────────────────────────────────────────────────────────────────────────────────────────────────────────────┬──────────┐
│ Name         │ ID       │ Status   │ Source                                                                                                         │ Version  │
├──────────────┼──────────┼──────────┼────────────────────────────────────────────────────────────────────────────────────────────────────────────────┼──────────┤
│ OpenClaw     │ openclaw │ loaded   │ ~/.openclaw/extensions/openclaw-cms-plugin/index.ts                                                            │ 0.1.1    │
│ CMS Plugin   │ -cms-    │          │ Report OpenClaw AI agent execution traces to Alibaba Cloud CMS via OpenTelemetry                               │          │
│ Diagnostics  │ diagnost │ loaded   │ stock:diagnostics-otel/index.ts                                                                                │ 2026.3.1 │
│ OpenTelemetr │ ics-otel │          │ Export diagnostics events to OpenTelemetry                                                                     │          │
└──────────────┴──────────┴──────────┴────────────────────────────────────────────────────────────────────────────────────────────────────────────────┴──────────┘
Step 4: View monitoring data
After the installation is complete, send a few messages to OpenClaw to trigger the agent. You can then view the monitoring data reported by OpenClaw in the Cloud Monitor 2.0 console.
Log on to the Cloud Monitor 2.0 console and select your target workspace.
In the left-side navigation pane, choose Application Observability > AI Application Observability.
In the application list, find the service name you configured (for example,
openclaw-gateway).Click the application name or choose Trace Analysis to view the trace, token consumption, LLM input and output, and latency distribution.
Uninstall
To uninstall the plugins, run the following command:
curl -fsSL https://arms-apm-cn-hangzhou-pre.oss-cn-hangzhou.aliyuncs.com/openclaw-cms-plugin/uninstall.sh | bashThe uninstall script automatically removes the openclaw-cms-plugin installation directory and all related configurations from openclaw.json. It also disables the configuration for diagnostics-otel.
Parameter | Description |
| Skips the confirmation prompt. |
| Specifies the plugin installation directory. If not specified, the directory is automatically detected. |
| Uninstalls only the |
FAQ
No data appears in the console after configuration?
Check the following items in order:
Confirm that your OpenClaw version is v26.2.19 or later. Run
openclaw --versionto verify.Confirm that the gateway has been restarted. The one-click installation restarts it automatically. For manual installations, you must run
openclaw gateway restart. If the restart fails, runopenclaw doctor, fix any issues, and then restart the gateway.Confirm that the Endpoint URL is correct and reachable over the network. Test connectivity with
curl.Confirm that all three header values (
x-arms-license-key,x-arms-project, andx-cms-workspace) are correctly entered.Note that the default
flushIntervalMsis 60 seconds. For short-lived tasks, wait a few minutes before data appears.
Does integration affect OpenClaw performance?
The performance impact is minimal. The openclaw-cms-plugin uses OpenTelemetry's batch export mechanism. The plugin buffers span data in memory and reports it in batches at regular intervals, which does not block the normal processing flow of the agent.
Can I install only the trace plugin?
Yes. During installation, add the --disable-metrics parameter to skip the configuration for diagnostics-otel. This enables trace reporting only.
Will diagnostics-otel and openclaw-cms-plugin traces conflict?
No. The installation script sets diagnostics.otel.traces to false by default, making the openclaw-cms-plugin solely responsible for trace reporting. Even if both are reported simultaneously, there is no conflict.
Will installation overwrite my diagnostics-otel configuration?
No. The installation script uses a merge-update strategy. It only updates necessary fields such as endpoint and headers, and preserves your existing configurations for traces, logs, and sampleRate.
Why is token consumption always 0?
A bug in OpenClaw version 2026.3.8 causes token consumption to be collected incorrectly. A community fix is in progress. For more information, see the related issue: openclaw/openclaw#46616.
Can I use gRPC to report data?
The diagnostics-otel plugin in OpenClaw supports only http/protobuf. If you set grpc, the setting is silently ignored. No error occurs, but the setting has no effect.