A dashboard is a visualization feature that centralizes information, such as metrics, data trends, and status monitoring. It uses various visualization components to create a custom interface, which helps you quickly understand the operational status of your business or system.
Procedure
Log on to the Cloud Monitor 2.0 console, and select a workspace. In the left navigation pane, choose .
On the dashboard page, choose .
In the Create Dashboard dialog box, configure the dashboard and click OK.
Dashboard Name: Enter a custom name.
Layout Mode: Select Grid Layout or Free Layout.
On the dashboard page, you can view the Name and ID of each dashboard, along with the Details and Delete options in the Operations column.
In the Operations column, click Details for the desired dashboard.
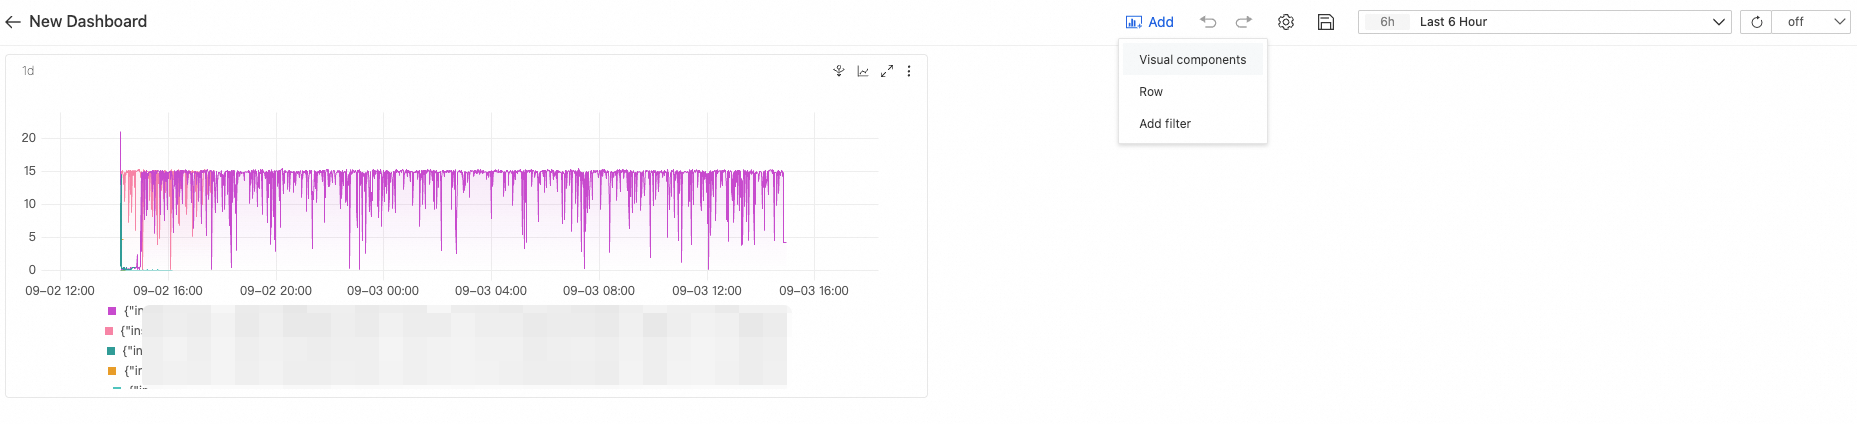
On the dashboard details page, click Add a new panel on the panel.
Alternatively, click the
 Add icon at the top and select Visualization Component.
 Undo: Undoes the addition of a visualization component.
 Redo: Restores an undone visualization component.
 Settings: Configures dashboard parameters.
Basic Configuration: Change the name and description of the dashboard.
Filter Management: Configure variables for use in data queries. Filter variables automatically append filter conditions. Placeholder variables are replaced using the $var format. The variables appear as input boxes or drop-down lists at the top of the dashboard.
LinkConfig: Create new links to custom external URLs. The links appear at the top of the dashboard for easy access.
JSON Model: View the dashboard configuration in JSON format. You can copy the JSON content to migrate the dashboard or modify its features in batches.
 Save: After you configure the visualization component, click Save to add it to the dashboard.
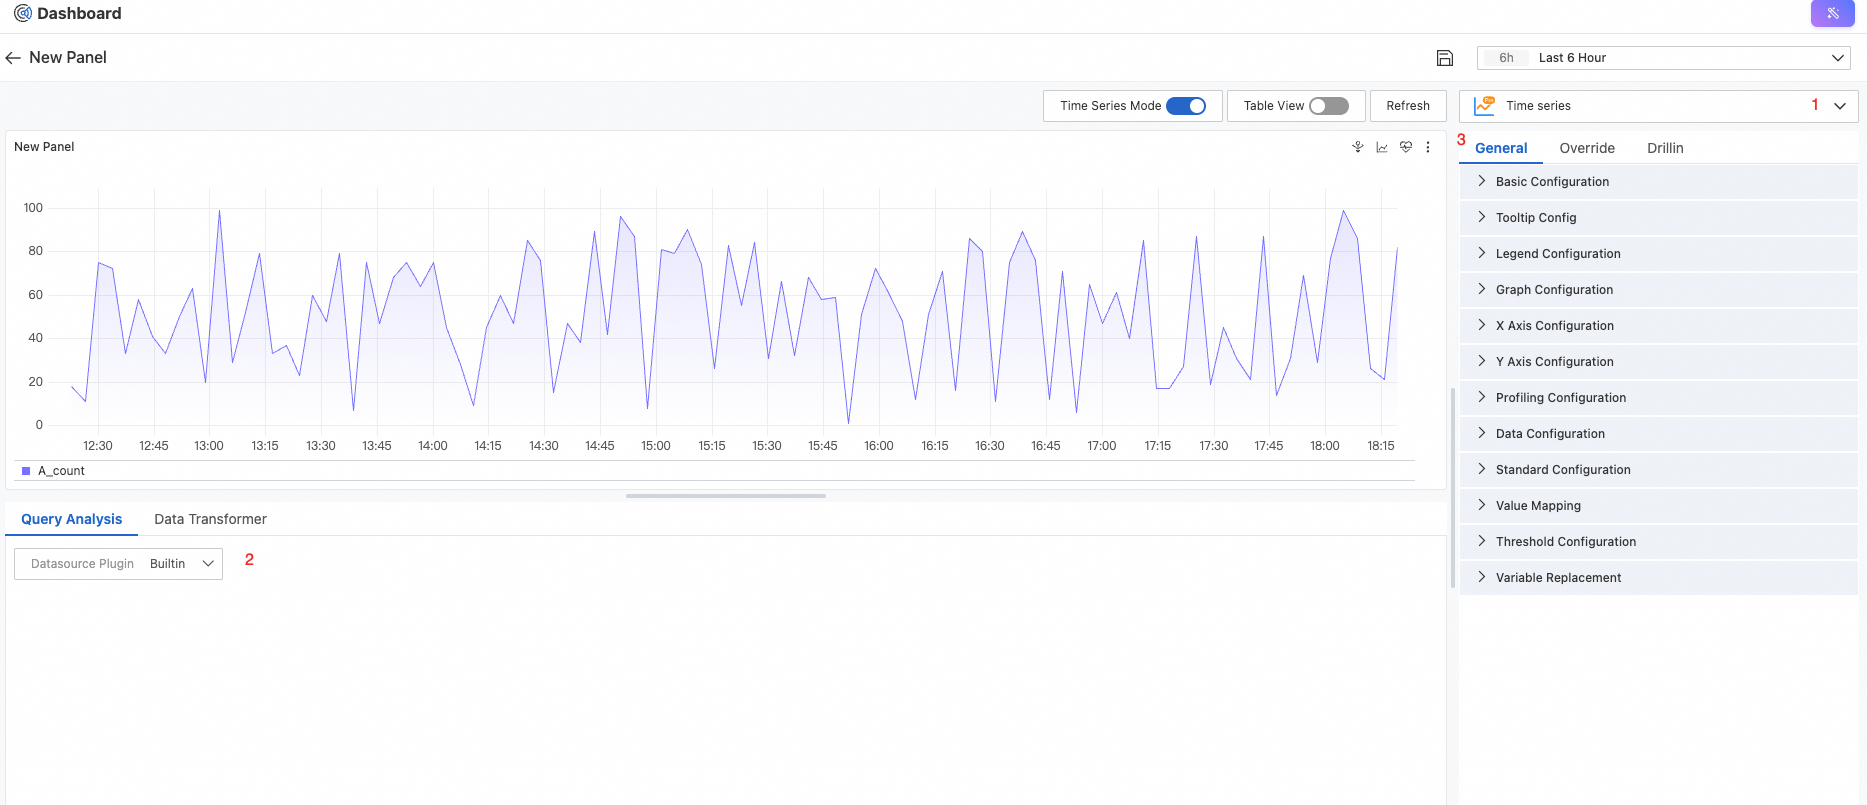
On the Add a new panel page:
Figure ①: Support for multiple chart types.
Chart (Line chart, column chart, statistics, gauge, pie chart, table, facet chart, and histogram).
Relation Graph(Polystat, Heatmap, and Flame Graph).
Map (China Map and World Map).
Area ②: Select a data source. The following data sources are supported:
Built
Cloud Product Monitoring
Prometheus
Metricstore (PromQL)
Logstore (SQL)
Metricstore (SQL)
Area ③: Configure custom chart settings.
General: Configure general settings for the chart, such as its title, border, background, time range, graph type (line, column, or point), x-axis, y-axis, and threshold.
Override: Customize the display name, color scheme, line width, and fill opacity for metric fields.
Drillin: Set up link events based on data column names. When you click a data point in the chart, you are redirected to the target link.
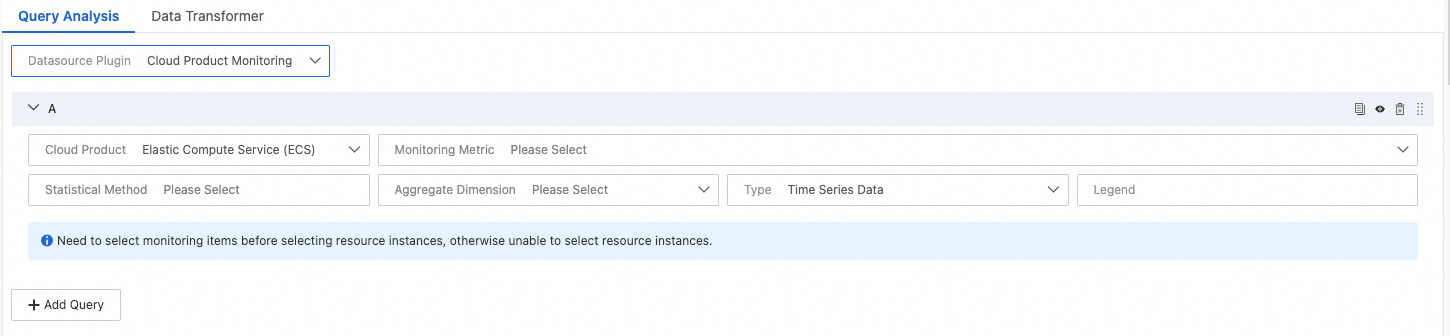
Add a data source. For example, to add a Cloud Product Monitoring data source, click Add Query and configure the data source settings.
Cloud Product: Select the cloud product that you want to monitor.
Monitoring Metric: Select the metric that you want to monitor.
After you select a metric, click Add Resource.
Select a resource scope: Application Group Selection, Cloud Product InstanceSelection, or Monitored Instance Selection.
Select the target resource instances and click Confirm.
Aggregation Method: Select an aggregation method for the metric values, such as Average, Minimum, or Maximum.
Group: Set the dimensions for aggregation.
Type: Select the data query method.
After you finish the configuration, click the Save icon
 at the top.
You can add more visualization components and configure charts for monitored resources to create a dashboard with a variety of monitoring charts.