Cloud Monitor collects CPU utilization, memory usage, and open file count for active processes on ECS instances and non-Alibaba Cloud hosts. You can add process monitoring to track process counts and configure alert rules.
Prerequisites
The Cloud Monitor agent is installed on your Alibaba Cloud ECS instances and non-Alibaba Cloud hosts. Install the Cloud Monitor agent.
How process metrics are collected
Cloud Monitor collects CPU utilization, memory usage, and open file count for the top five CPU-consuming processes every minute.
-
CPU utilization and memory usage: Comparable to the Linux top command.
-
Open file count: Comparable to the Linux lsof command.
Notes on top-five CPU utilization data:
-
CPU utilization can exceed 100% for multi-core processes because the value is summed across all cores.
-
If the top five processes change during the selected time range, all processes that ranked in the top five are listed. Each process shows the timestamp of its most recent top-five appearance.
-
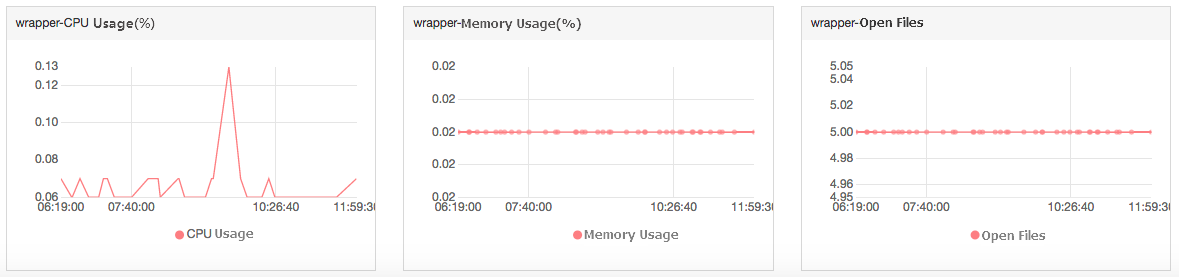
If a process frequently drops out of the top five, its chart data appears sparse. Denser data points indicate more consistent top-five ranking. For example:
-
The Wrapper process does not consistently rank in the top five, so its data points are sparse.
-
The dense data points for the Java process indicate consistent top-five ranking.
-
-
System-level tasks, such as the kworker or ksoftirqd kernel threads or interrupt handling, can consume a large amount of CPU without ranking in the top five. In this case, process monitoring may show idle or no data even though overall CPU utilization remains at 100%. Run the
top -Hcommand to view CPU consumption at the thread level and identify kernel threads that consume high CPU but do not appear in the top five.
Why does process monitoring data start from a specific point in time instead of including full historical data?
Cloud Monitor begins collecting process metrics only after you add a monitoring item for that process. Historical data from before that point is not available, and alert rules do not apply retroactively.
Troubleshoot scheduled CPU alerts
When a host triggers a CPU alert during a fixed time period, use process monitoring to retrospectively review process CPU consumption during that historical time period and identify the process that is consuming CPU:
-
Log on to the Cloud Monitor console. In the left-side navigation pane, choose Cloud Resource Monitoring > Host Monitoring. In the instance list, click the name of the target ECS instance to go to the host monitoring details page.
-
View the CPU utilization trend chart to confirm the CPU changes during the alert period.
-
Switch to the Process Monitoring tab. In the time range selector, select the time range that corresponds to the alert period (1 Hour/6 Hours/12 Hours/1 Day/3 Days/7 Days/14 Days/Custom). If the alert occurred during an unattended period, select Custom, specify the start and end time of the abnormal period (for example, 01:00 to 02:00), and then click OK. In the Process TopN table, view the top five processes by CPU utilization during that period. The table shows the process name/CMD, process ID, user, CPU utilization (%), memory usage (%), open file count, and timestamp.
-
Identify the cause based on the process name:
-
ids.exe / hbrclient: Cloud Backup (HBR) client processes that handle data transfer and task scheduling. Log on to the Cloud Backup console to check whether the backup plan execution time matches the alert time.
-
crontab / Windows Task Scheduler: Check the
crontab -loutput on Linux instances or Task Scheduler on Windows instances to see whether a scheduled script is consuming CPU. -
AliYunDun/AliYunDunMonitor: Security Center processes. A brief CPU increase during scheduled security scans is expected behavior.
-
Reviewing historical process data requires that a process monitoring item was added in advance. The Cloud Monitor agent collects metrics for a process only from the time you add its monitoring item, so no process data is available for periods before that.
Use the process name to determine whether the process is an expected business process. If no abnormal process appears in the top five, check scheduled tasks on the instance (run crontab -l on Linux, or open Task Scheduler on Windows) and system logs (Event Viewer on Windows). For the note about kernel threads that do not rank in the top five, see How process metrics are collected.
Add process monitoring
Monitor the instance count of critical processes to track their operational status.
For example, if your host runs the following processes:
-
/usr/bin/java -Xmx2300m -Xms2300m org.apache.catalina.startup.Bootstrap -
/usr/bin/ruby -
nginx -c /etc/nginx/nginx.conf
Adding the following six process keywords produces these results:
|
Process keyword |
Count |
Result |
|
|
1 |
Matches the process name. |
|
|
1 |
Matches the process name and arguments. |
|
|
2 |
Matches the path (two processes include this path). |
|
|
1 |
Matches part of the arguments. |
|
|
1 |
Matches part of the arguments. |
|
|
1 |
Matches part of the arguments. |
Process keyword matching is case-sensitive. The keyword must exactly match the process name as shown in the operating system. A case mismatch prevents the keyword from matching the target process, which causes metric collection to fail and alert rules not to trigger.
-
Log on to the Cloud Monitor console.
-
In the left-side navigation pane, choose .
-
On the Host Monitoring page, click the instance name of the target host or click Monitoring Charts in the Actions column. Then, select the Process Monitoring tab.
-
At the bottom of the page, expand the Process Count Monitoring panel and click Add Process Monitor in the upper-right corner.
-
In the Add Process Monitoring panel, enter the process name, click Add, and then click the
 icon in the upper-right corner.Note
It may take a few minutes for monitoring data to appear for the newly added process.
Create an alert rule for a process
After adding process monitoring, create an alert rule to receive notifications when the process count changes.
Recommendation: setting the alert threshold for total process count
The total process count on a Linux host is limited by the kernel parameter /proc/sys/kernel/pid_max. To avoid false positives or missed alerts, follow these guidelines:
-
Set the alert threshold to 70%–80% of the pid_max value to maintain a safety buffer.
-
Run
cat /proc/sys/kernel/pid_maxto check the current system limit. -
Alternatively, obtain the actual process count during a stable business period from Cloud Monitor historical data or by running
ps -eLf | wc -l, then add 20%–30% as the alert threshold.
Avoid setting the threshold to a value close to pid_max.
-
Log on to the Cloud Monitor console.
-
In the left-side navigation pane, choose .
-
On the Host Monitoring page, click the instance name of the target host or click Monitoring Charts in the Actions column. Then, select the Process Monitoring tab.
-
Expand the Process Count Monitoring panel. In the target process chart, click the alert icon
 in the upper-right corner to open the alert rule panel.
 -
In the Configure Rule Description panel, set a rule name, define the threshold and alert level for the Process / Number of Current Processes metric, and then click OK.
-
In the Create Alert Rule panel, configure the alert rule parameters and click Confirm.
Alert rule parameters are described in Create an alert rule.
-
View the process alert rule.
-
In the left-side navigation pane, choose Alerts > Alert Rules.
-
On the Alert Rules page, you can view the alert rules for the process dimension in the Alert Rule column.
-
Delete process monitoring
Processes added from Application Groups > Group Process can only be deleted from the Group Process page.
-
Log on to the Cloud Monitor console.
-
In the left-side navigation pane, choose .
-
On the Host Monitoring page, click the instance name of the target host or click Monitoring Charts in the Actions column. Then, select the Process Monitoring tab.
-
Expand the Process Count Monitoring panel and click Add Process Monitor in the upper-right corner. This panel lists all currently monitored processes.
-
In the Add Process Monitoring panel, click Delete in the Actions column for the target process.
-
In the Delete confirmation dialog box, click OK.
-
Click the
 icon in the upper-right corner.
FAQ
Does Cloud Monitor support viewing the network bandwidth or traffic of a single process (such as Nginx or Java)?
Cloud Monitor does not support viewing outbound bandwidth or downlink traffic of individual processes over a specified time period. To monitor per-process network traffic, use a third-party tool such as nethogs on the ECS instance.
How do I monitor the Java thread count?
Cloud Monitor process monitoring tracks only process counts. You can add java as a process keyword to track running Java processes. Java thread count monitoring is not supported. To monitor Java thread count, use ARMS Application Monitoring.
Troubleshoot processes with high CPU usage in a historical time range
After you receive a CPU alert, use process monitoring in Cloud Monitor to review the CPU utilization of processes in a historical time range and identify the processes that consumed CPU during the abnormal period.
-
Log on to the Cloud Monitor console.
-
In the left-side navigation pane, choose Cloud Resource Monitoring > Host Monitoring.
-
In the instance list on the Host Monitoring page, click the name of the target ECS instance to go to the host monitoring details page.
-
Click the Process Monitoring tab.
-
In the time range selector in the upper-right corner, select Custom, specify the abnormal period, such as 01:00 to 02:00, and then click OK.
-
In the Process TopN table, view the top five processes by CPU utilization, including the process name, process ID, CPU utilization, and memory usage.
Historical data is collected for a process only after you add a monitoring item for that process. No process data is available for periods before the monitoring item is added.
Use the process name to determine whether the process that consumes CPU is an expected business process. For further troubleshooting, check the scheduled tasks and the Event Viewer logs of the operating system.