Monitor whether services in a VPC are available and responding by creating availability monitoring tasks in Cloud Monitor.
Background information
As more users migrate from the classic network to a more secure and reliable VPC environment, monitoring service availability within a VPC becomes a key concern. This topic describes how to monitor the availability of services on ECS instances, connectivity from ECS to ApsaraDB RDS and Tair (Redis OSS-compatible®) instances, and SLB responsiveness.
How it works
The following figure shows how availability monitoring works for services in a VPC.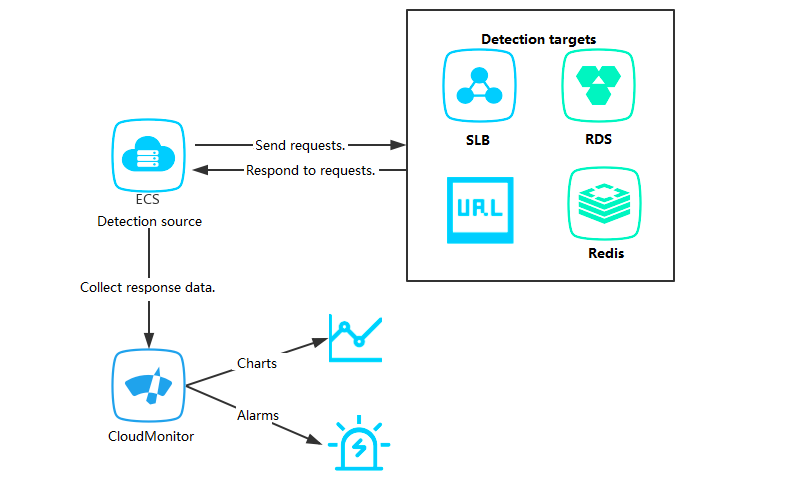
Install the Cloud Monitor agent on an ECS instance to use it as a monitoring node. Then, in the Cloud Monitor console, create an availability monitoring task: select the instance as the monitoring node and configure the URL or port of the target. After you create the task, the agent sends an HTTP or Telnet request to the target every minute, collects metrics such as response time and status codes, and reports them to Cloud Monitor. Cloud Monitor displays the data in charts and triggers alerts based on your alert rules.
Procedure
-
You must install the Cloud Monitor agent on the ECS instance that you want to use as a monitoring node.
-
You must create an application group and add the monitoring node to the group.
-
Log on to the Cloud Monitor console.
-
In the left-side navigation pane, choose .
-
On the Application Groups page, click the name of the target application group. On the page that appears, click Availability Monitoring in the left-side navigation pane.
-
In the upper-right corner of the page, click Add Availability Monitoring.
-
In the Create/Modify Availability Monitoring Task panel, set the following parameters.
Parameter
Description
DtsJobName
The name of the task.
Monitoring node
The ECS instance that sends detection requests.
Monitored object
The object that you want to monitor. Valid values:
-
URL or IP: for monitoring ECS instances.
-
ApsaraDB RDS: for monitoring ApsaraDB RDS instances.
-
Tair (Redis OSS-compatible®): for monitoring Tair (Redis OSS-compatible®) instances.
Detection type
The method used to detect the monitored object.
If you set Monitored Object to URL or IP, the following detection types are supported:
-
HTTP(S): Enter the URL of the monitored object.
-
TELNET: Enter the IP address of the monitored object.
-
PING: Enter the IP address of the monitored object.
If you set Monitored Object to ApsaraDB RDS or Tair (Redis OSS-compatible®), the following detection types are supported:
-
TELNET: Select the instance ID and the connection address to monitor.
-
PING: Select the instance ID and the connection address to monitor.
Request method
The request method. Valid values: HEAD, GET, and POST.
NoteThis parameter is required if you set Monitored Object to URL or IP and Detection Type to HTTP(S).
Monitoring frequency
The interval between detection requests.
Valid values: 15 seconds, 30 seconds, 1 minute, 2 minutes, 5 minutes, 15 minutes, 30 minutes, and 60 minutes.
NoteThis parameter is required if you set Monitored Object to URL or IP and Detection Type to HTTP(S).
Headers
The HTTP or HTTPS headers for site monitoring.
Header format:
parameter1:value1.Separate multiple headers with a comma (,).
NoteThis parameter is required if you set Monitored Object to URL or IP and Detection Type to HTTP(S).
Post content
The content of the POST request for site monitoring.
The content must be in the
parameter1=value1¶meter2=value2format. Only English characters are supported.NoteThis parameter is required if you set Monitored Object to URL or IP, Detection Type to HTTP(S), and Request Method to POST.
Match response content
The method and content for matching the response.
If you specify content to match, the task reads the first 64 KB of the HTTP response body to find it. The available matching methods are:
-
Generate Alert if Response Contains
-
Generate Alert if Response Does Not Contain
NoteThis parameter is required if you set Monitored Object to URL or IP and Detection Type to HTTP(S).
Note-
To monitor whether a local process on an ECS instance is responding, select the required ECS instances as monitoring nodes, and enter an address in the
localhost:port/pathformat as the monitored object. -
To monitor whether an SLB instance in a VPC is responding, select an ECS instance within the same VPC as a monitoring node, and enter the address of the SLB instance as the monitored object.
-
To monitor the responsiveness of an ApsaraDB RDS or Tair (Redis OSS-compatible®) instance to requests from an ECS instance in the same VPC, add the database instance to the same application group as the ECS instance. Then, select the ECS instance as the monitoring node and the database instance as the monitored object.
-
-
Click Next.
-
On the Alert Settings page, set the following parameters.
Parameter
Description
Status code
An alert is triggered if the response status code meets the specified condition.
An alert is triggered if the threshold for either Status Code or Response Time is met. Alert notifications are sent to the alert contact group of the application group.
Response time
An alert is triggered if the response time meets the specified condition.
An alert is triggered if either the Status code or the Response time reaches the threshold. The alert is sent to the alert contact group of the application group.
Alert level
The alert level, which determines the notification methods. Valid values:
Info (Email and DingTalk Robot)
Alert callback
A public URL to which Cloud Monitor sends alert notifications as POST requests. Only HTTP is supported. For more information, see Use alert callbacks for threshold-based alerts.
Mute period
The interval between repeated notifications for an unresolved alert. Valid values: 5 minutes, 15 minutes, 30 minutes, 60 minutes, 3 hours, 6 hours, 12 hours, and 24 hours.
After an alert is triggered, no further notifications are sent for the same alert event during the mute period. If the alert persists after the mute period, another notification is sent.
Effective period
The period during which the alert rule is active. Notifications are sent only during this period. Alerts triggered outside this period are recorded in the alert history but do not trigger notifications.
Log service
If you enable Log Service, Cloud Monitor sends alert information to a Logstore in Log Service when an alert is triggered. You must specify the Region, ProjectName, and Logstore.
To learn how to create a Project and a Logstore, see Use LoongCollector to collect and analyze text logs on ECS instances.
-
Click OK.
-
Find the target task and click the
 icon in the Actions column.
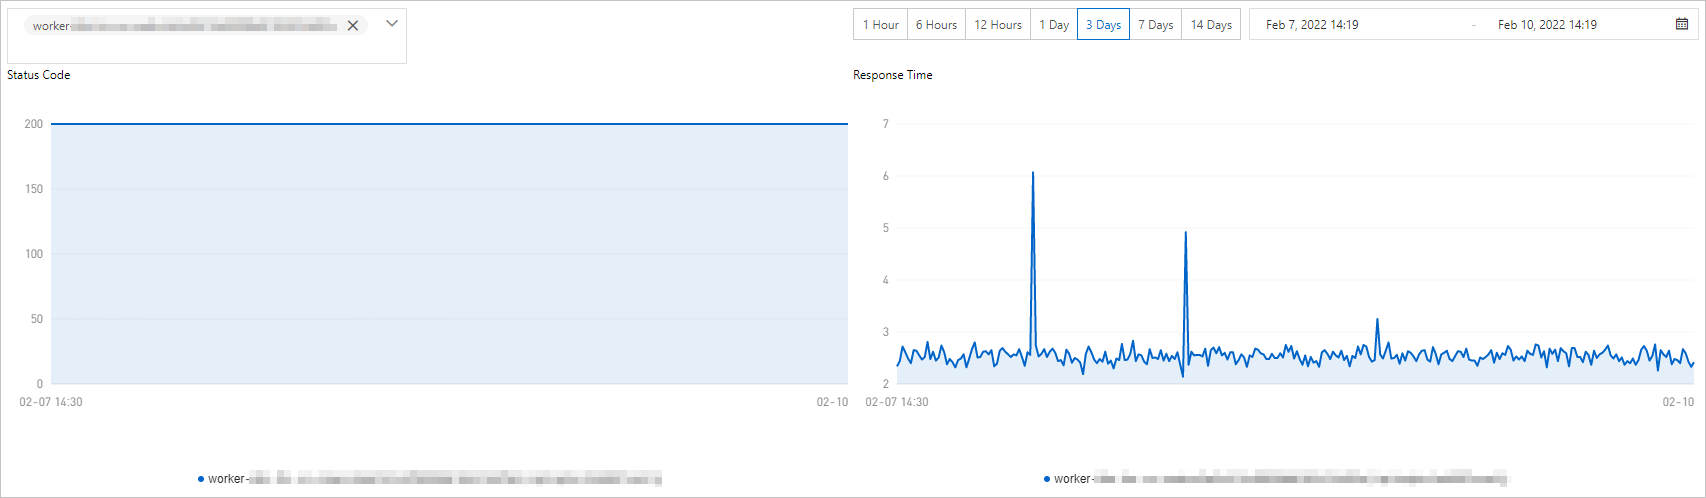
You can view monitoring details in the monitoring charts.