This topic describes how to create metrics from data stored in Log Service and set alert rules for the metrics.
The log monitoring feature is available only to users who purchased a subscription or enabled the pay-as-you-go billing method before 22:00:00 on September 13, 2022. The log monitoring feature will be discontinued on September 14, 2024. We recommend that you use Simple Log Service log monitoring in Hybrid Cloud Monitoring as an alternative.
Prerequisites
You have collected on-premises logs to Log Service. For more information, see Log Service.
Background
The following figure shows how business log monitoring and alerting work.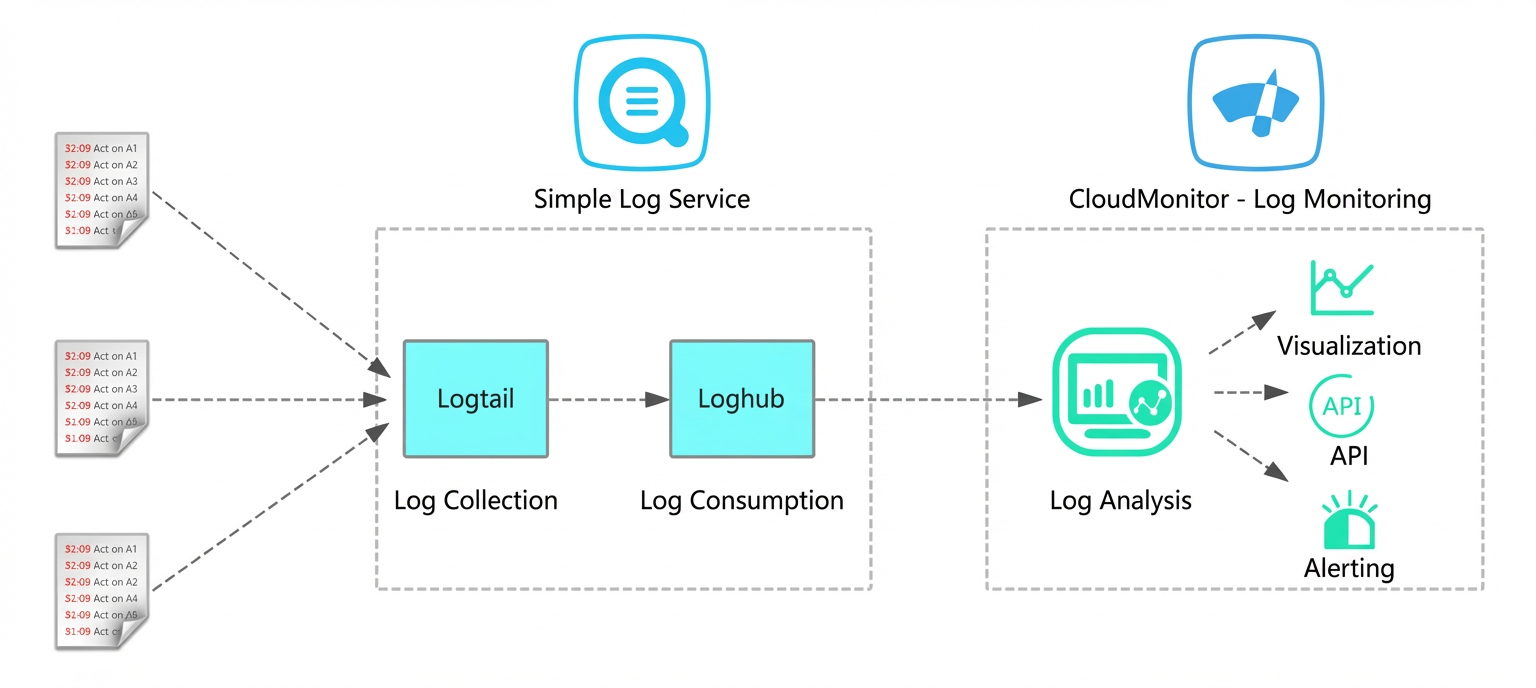
Procedure
(Optional) Grant Cloud Monitor permission to access Simple Log Service.
The first time you use the log monitoring feature, you must grant Cloud Monitor permission to access Simple Log Service.
-
Log on to the Cloud Monitor console.
-
In the left-side navigation pane, choose .
In the CloudMonitor Service Association role dialog box, click OK.
-
Create a log monitoring metric.
On the Log Monitoring page, click Create Log Monitoring Metric in the upper-left corner.
On the Associate Resource page, select the resources to associate and click Next.
On the Define Metric page, configure the log analysis parameters and click Next.
The following table describes how to configure the log analysis parameters.
Parameter
Description
Metric name
The metric name.
Unit
The metric unit.
Calculation period
The interval (in minutes) for computing the metric. Valid values: 1, 2, 3, 4, 5, 10, 15, 20, 30, and 60.
Statistical method
The aggregation method for log data per calculation period. All methods are available for numeric fields. For non-numeric fields, only Count and countps are supported. Valid values:
-
Count: The number of values in the field.
-
Sum: The sum of the field values.
-
Max: The maximum field value.
-
Min: The minimum field value.
-
Average: The average field value.
-
countps: The per-second average of the Count result.
-
sumps: The per-second average of the Sum result.
-
distinct: The number of unique values in the field.
Extended field
A computed field derived from arithmetic operations on aggregation results. For example, if you have a metric
TotalNumberfor total HTTP requests and a metric5xxNumberfor requests with status codes over 499, you can calculate the server error rate:5xxNumber/TotalNumber*100.Log filter
Filters log data, similar to a
WHEREclause in SQL. For example, to monitor logs wherelevelisERROR, uselevel>=ERROR.The log field name used for filtering cannot contain Chinese characters.
Group-by
Groups data by specified dimensions, similar to a
GROUP BYclause in SQL.If no dimension is selected, all data is aggregated using the specified statistical method.
Select SQL
The equivalent SQL statement for your configuration, showing how the data is processed.
Application groups
The application group for this metric.
On the Define Metric page, click Preview to view a sample of the aggregated log data for the last minute. The preview is calculated by using only the 100 most recent log entries.
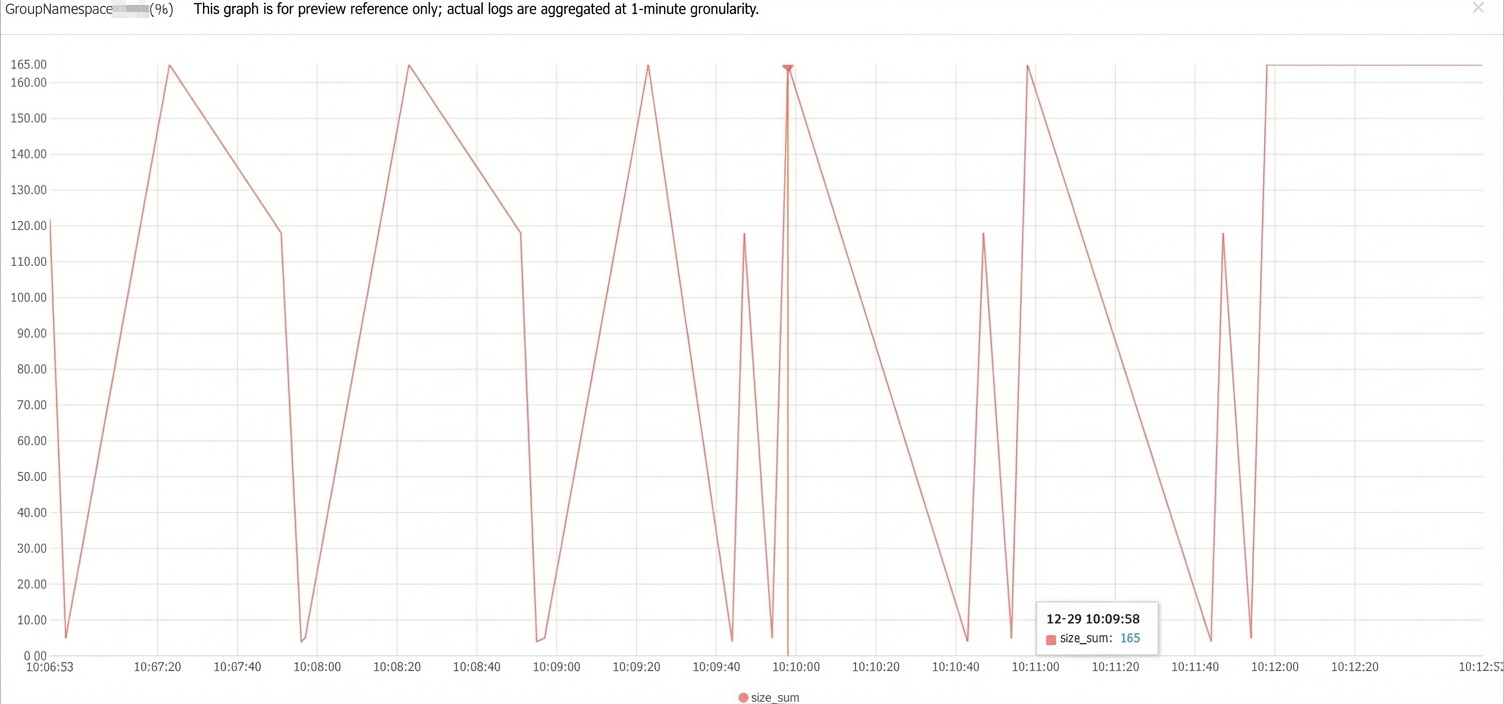
-
On the Configure Alert Rule page, set the parameters for the alert rule and click Next.
On the Creation Result page, click Close.
View the log monitoring data.
After you create the log monitoring metric, wait 3 to 5 minutes. On the Log Monitoring page, click the
 icon in the Actions column of the target metric to view its monitoring chart.
View alert notifications for the metric.
You receive an alert notification when the metric data triggers an alert rule.