This topic describes how to use Alibaba Cloud Managed Service for Prometheus to monitor a Serverless App Engine (SAE) application.
Prerequisites
The SAE application is running as expected.
Step 1: Enable the SAE component
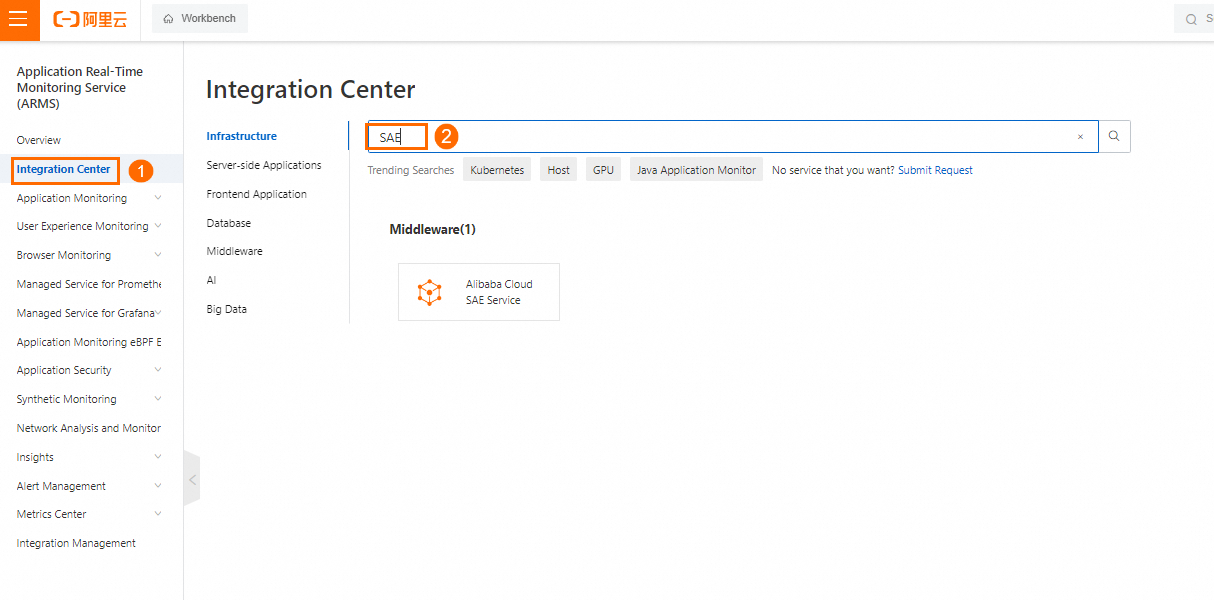
Search for the SAE component in Integration Center: Log on to the Managed Service for Prometheus console. In the left-side navigation pane, click Integration Center. Search for the SAE component and click on it.
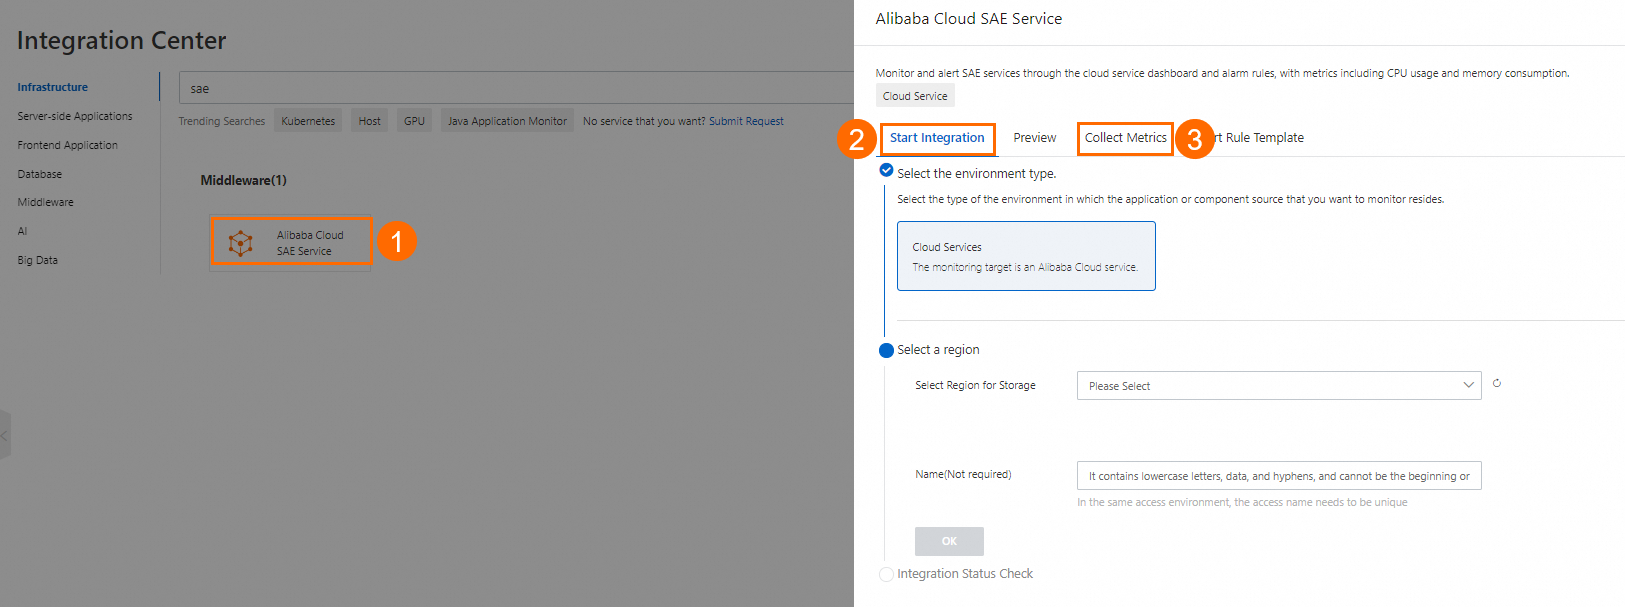
Enable the SEA component: In the Alibaba Cloud SAE Service panel, enable the SEA component as prompted and view the supported metrics.
Metric
Description
cpu
CPU utilization
load
Average load
memoryTotalMB
Total memory
memoryUsedMB
Memory usage
netRecv
Number of received bytes
netTran
Number of sent bytes
netRecvPacket
Number of received packets
netTranPacket
Number of sent packets
netRecvDrop
Number of packets that fail to be received
netTranDrop
Number of packets that fail to be sent
netRecvError
Number of received packets that encounter errors
netTranError
Number of sent packets that encounter errors
diskUsed
Disk usage
diskTotal
Total disk size
diskIopsRead
Read input/output operations per second (IOPS) of the disk
diskIopsWrite
Write IOPS of the disk
diskRead
Read throughput of the disk
diskWrite
Write throughput of the disk
tcpTotalConn
Total number of TCP connections
tcpActiveConn
Number of active TCP connections
tcpInactiveConn
Number of inactive TCP connections
tcpInuse
Number of TCP connections in use
tcpTw
Number of TCP connections in the TIME_WAIT state
tcpAlloc
Number of allocated TCP connections
tcpOrphan
Number of orphaned TCP connections
Step 2: View the monitoring data of the SAE application
Integration Management: Log on to the Managed Service for Prometheus console. In the left-side navigation pane, click Integration Management. On the Integrated Addons tab of the Integration Management page, click the SAE component. In the panel that appears, find the application and click View Details in the Actions column.
View the dashboard name: In the Addon Type section of the Component Management tab, click SAE. Then, click Dashboards to view all the dashboard names.
View a dashboard: Click the name of a Grafana dashboard to view the dashboard.
Configure data collection (optional): In the left-side navigation pane of the Grafana system, click Explore. On the Explore page, select a metric and tags, and then click Run query to view the metric data. For information about the supported metrics, see Step 1.
Step 3: Configure alerting
You can create alert rules based on your business requirements. For information about how to create Prometheus alert rules, see Create an alert rule for a Prometheus instance.