This topic describes how to resolve the issue of unexpectedly high traffic over the internal network for Elastic Compute Service (ECS) instances.
Problem description
On the Host Monitoring page of Cloud Monitor console, the inbound traffic over the internal network is unexpectedly
high for an ECS instance, as shown in the following figure.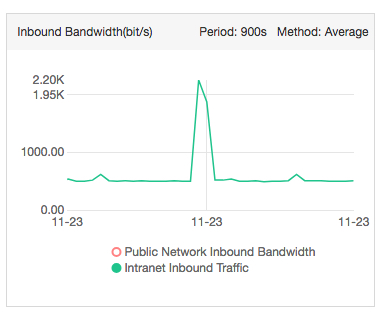
Cause
An ECS instance uses a public network interface controller (NIC) to provide services
and uses the internal network only in a few cases. The traffic over the internal network
is high for the current ECS instance when other ECS instances transmit large amounts
of data to the ECS instance.
Note The traffic over the internal network is high for the backend ECS instances of a Server
Load Balancer (SLB) instance. This is because the SLB instance communicates with the
backend ECS instances by using the internal network.
If no ECS instances transmit data to the ECS instance but the traffic over the internal network is high, the ECS instance may be infected with viruses, which cause the ECS instance to forward a large number of packets. For more information about how to resolve the issue in this case, see Solution.
Solution
This section describes the solution for ECS instances that run the Linux and Windows
operating systems.
- Linux
Note The NetHogs tool is an open source command line interface (CLI), which is similar to the top command in the Linux operating system. The NetHogs tool is used to analyze the real-time bandwidth usage of processes or applications.
- Download the NetHogs tool.
- Run the following command to install the NetHogs tool:
yum install nethogs
- Run the following command to view the internal bandwidth usage of each process:
nethogs eth0

- Windows
Note If the ECS instance runs Windows Server 2008 or later, you can view the internal bandwidth usage of processes in Resource Monitor.
- On the ECS instance, right-click the taskbar and select Task Manager.
- On the Process tab of the Task Manager dialog box, view the internal bandwidth usage of processes.