This topic describes the relationship between the data collection volume of a Prometheus Agent and its CPU and memory usage, and provides resource usage recommendations.
Agent stress testing report
Samples scraped per collection (per agent) | CPU | Memory |
1,000,000 | 0.95 core | 1.09483 GB |
1,100,000 | 1.11 cores | 1.16045 GB |
1,200,000 | 1.36 cores | 1.09452 GB |
1,300,000 | 1.66 cores | 1.15971 GB |
1,400,000 | 1.29 cores | 1.09465 GB |
1,500,000 | 1.50 cores | 1.15977 GB |
1,600,000 | 1.39 cores | 1.15971 GB |
1,700,000 | 1.64 cores | 1.1599 GB |
1,800,000 | 1.63 cores | 1.42331 GB |
You can find the number of samples scraped per collection on the Grafana dashboard for Prometheus.
For example, the following figure shows the number of samples scraped by the following PromQL query.
sum (scrape_samples_scraped) by (_ARMS_AGENT_ID)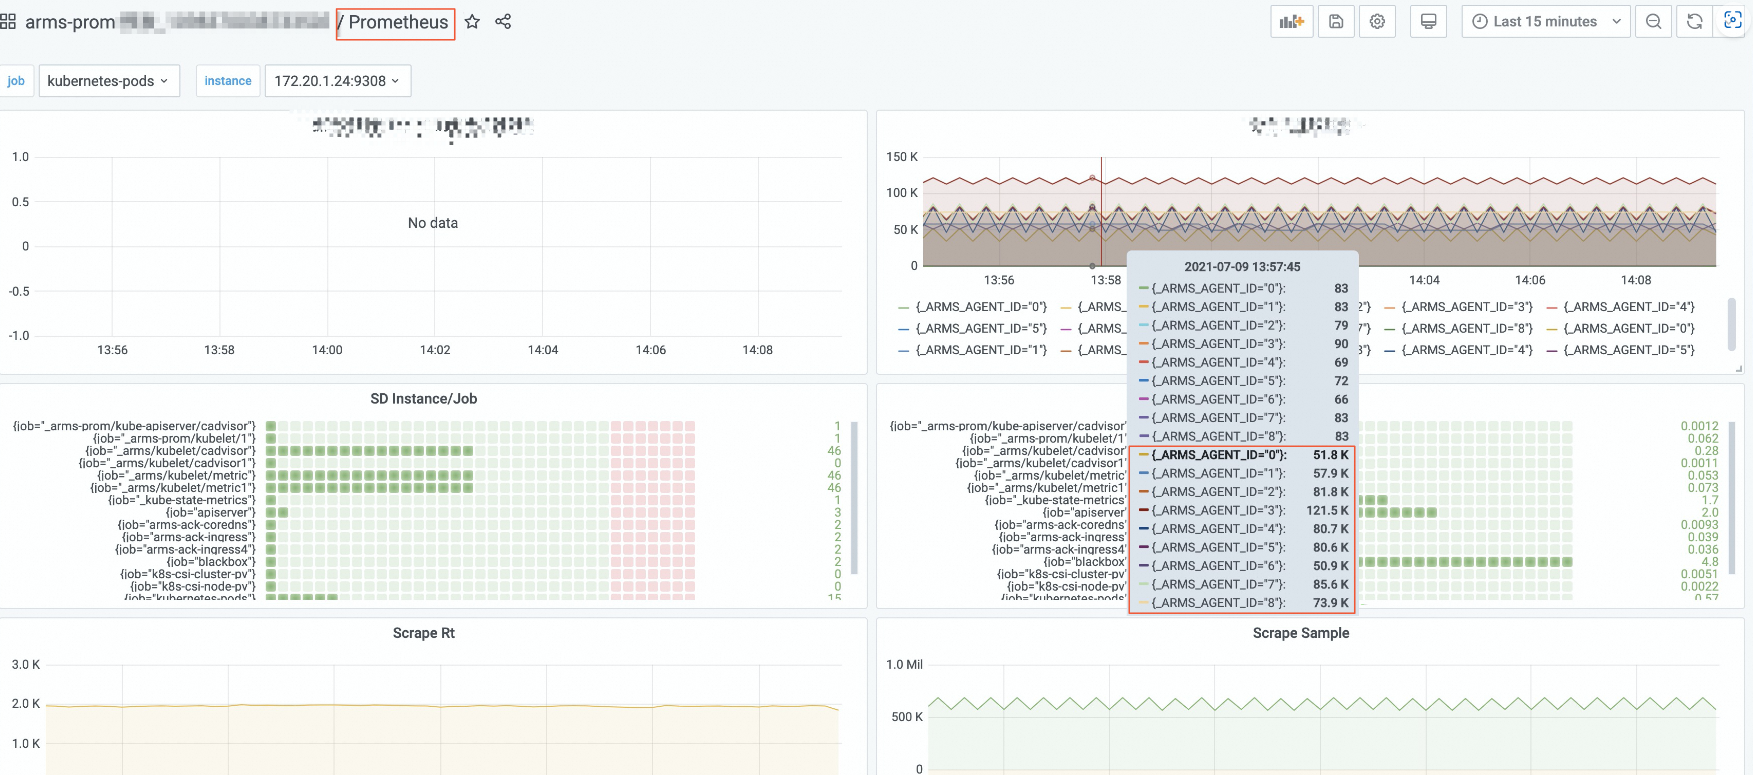
Resource usage recommendations
The agent stress testing report indicates that collecting 1,000,000 samples requires approximately 1 GB of memory and 1 CPU core. To ensure stable performance, allocate sufficient resources to maintain the CPU and memory utilization of the Prometheus Agent at 50%.
The recommended CPU and memory allocations for different data collection volumes are as follows:
For 500,000 samples per collection (displayed as 500K on the Grafana dashboard), allocate 1 GB of memory and 1 CPU core.
For 1,000,000 samples per collection, allocate 2 GB of memory and 2 CPU cores.
For 2,000,000 samples per collection, allocate 4 GB of memory and 4 CPU cores.
And so on.
For example, if you observe on the Grafana dashboard that the number of samples per collection reaches 1,000,000, increase the memory allocation to 2 GB and the CPU allocation to 2 cores.