The resource inspection feature of Cloud Migration Hub (CMH) helps you analyze the performance of each cloud service in the cutover phase. This topic describes how to use the resource inspection feature.
Create a resource inspection plan
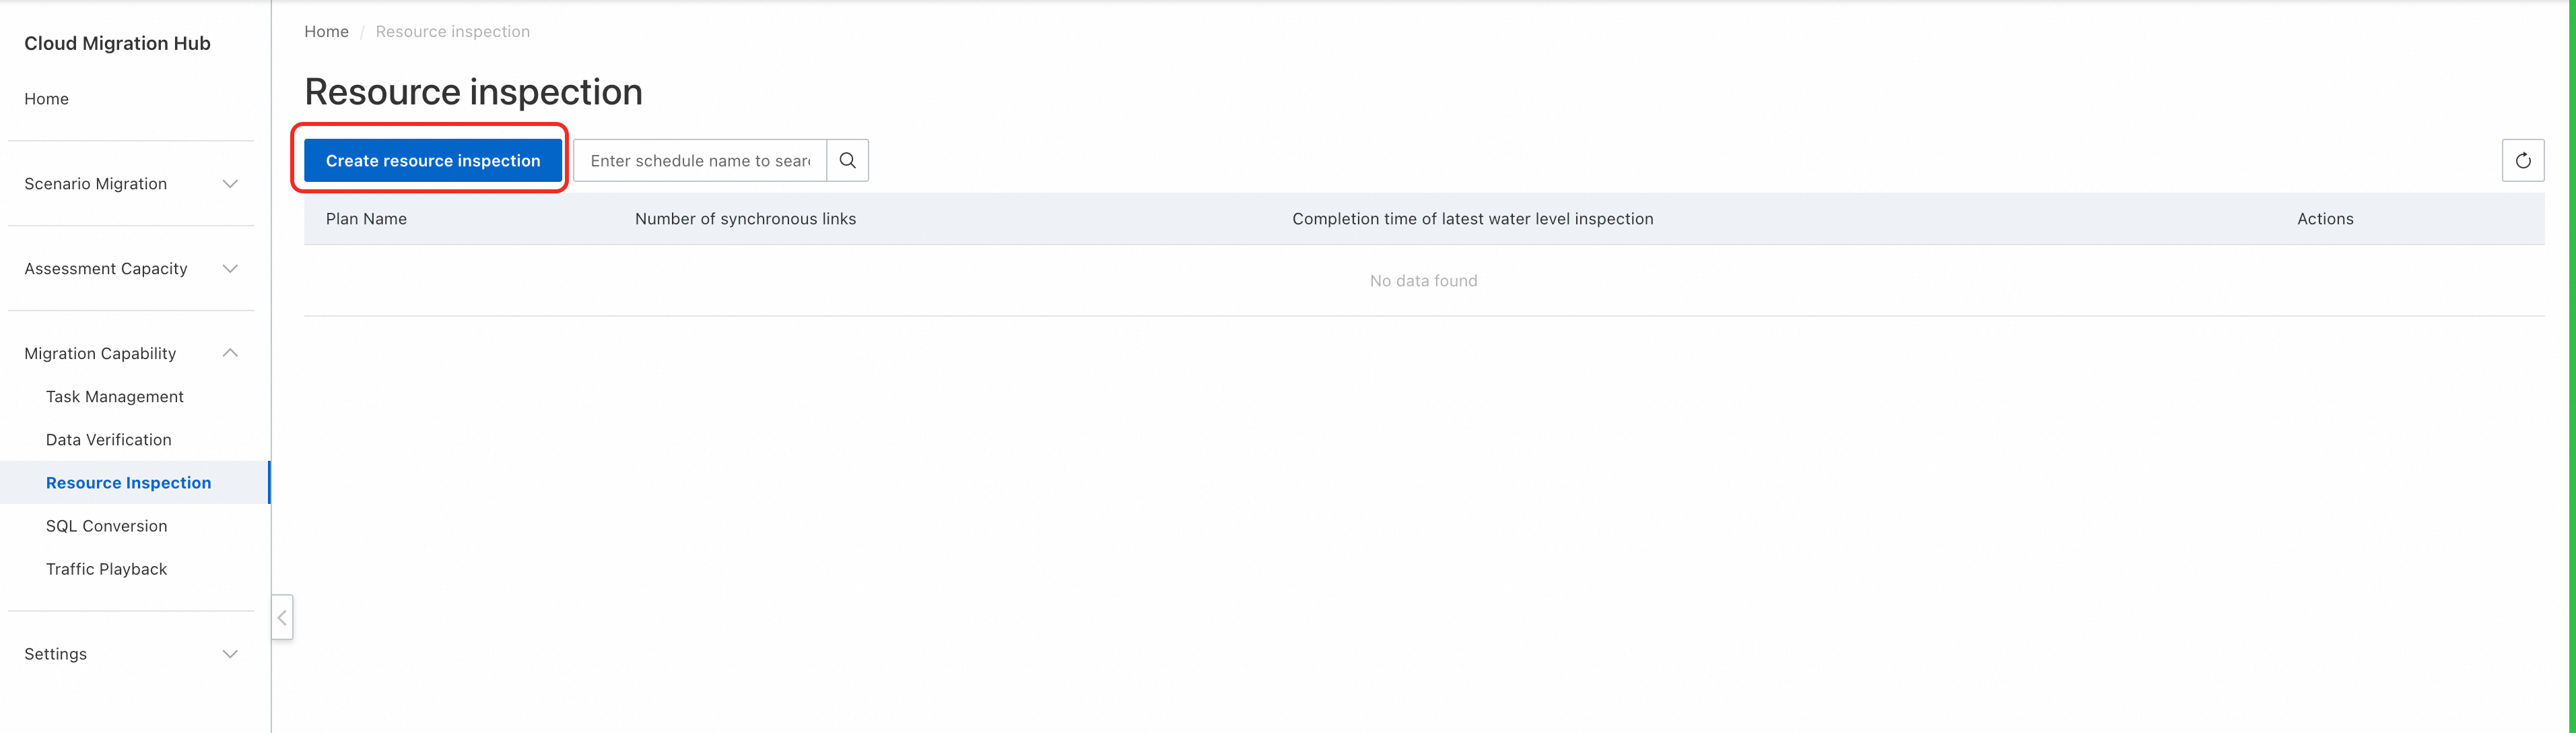
Log on to the CMH console. In the left-side navigation pane, choose Migration capability > Resource inspection. On the Resource inspection page, click Create resource inspection.
On the Create resource inspection page, configure the Plan Name and Remarks parameters in the Cutover Resource Association step. Configure the Associated Resources parameter based on your business scenarios. CMH supports three association methods.
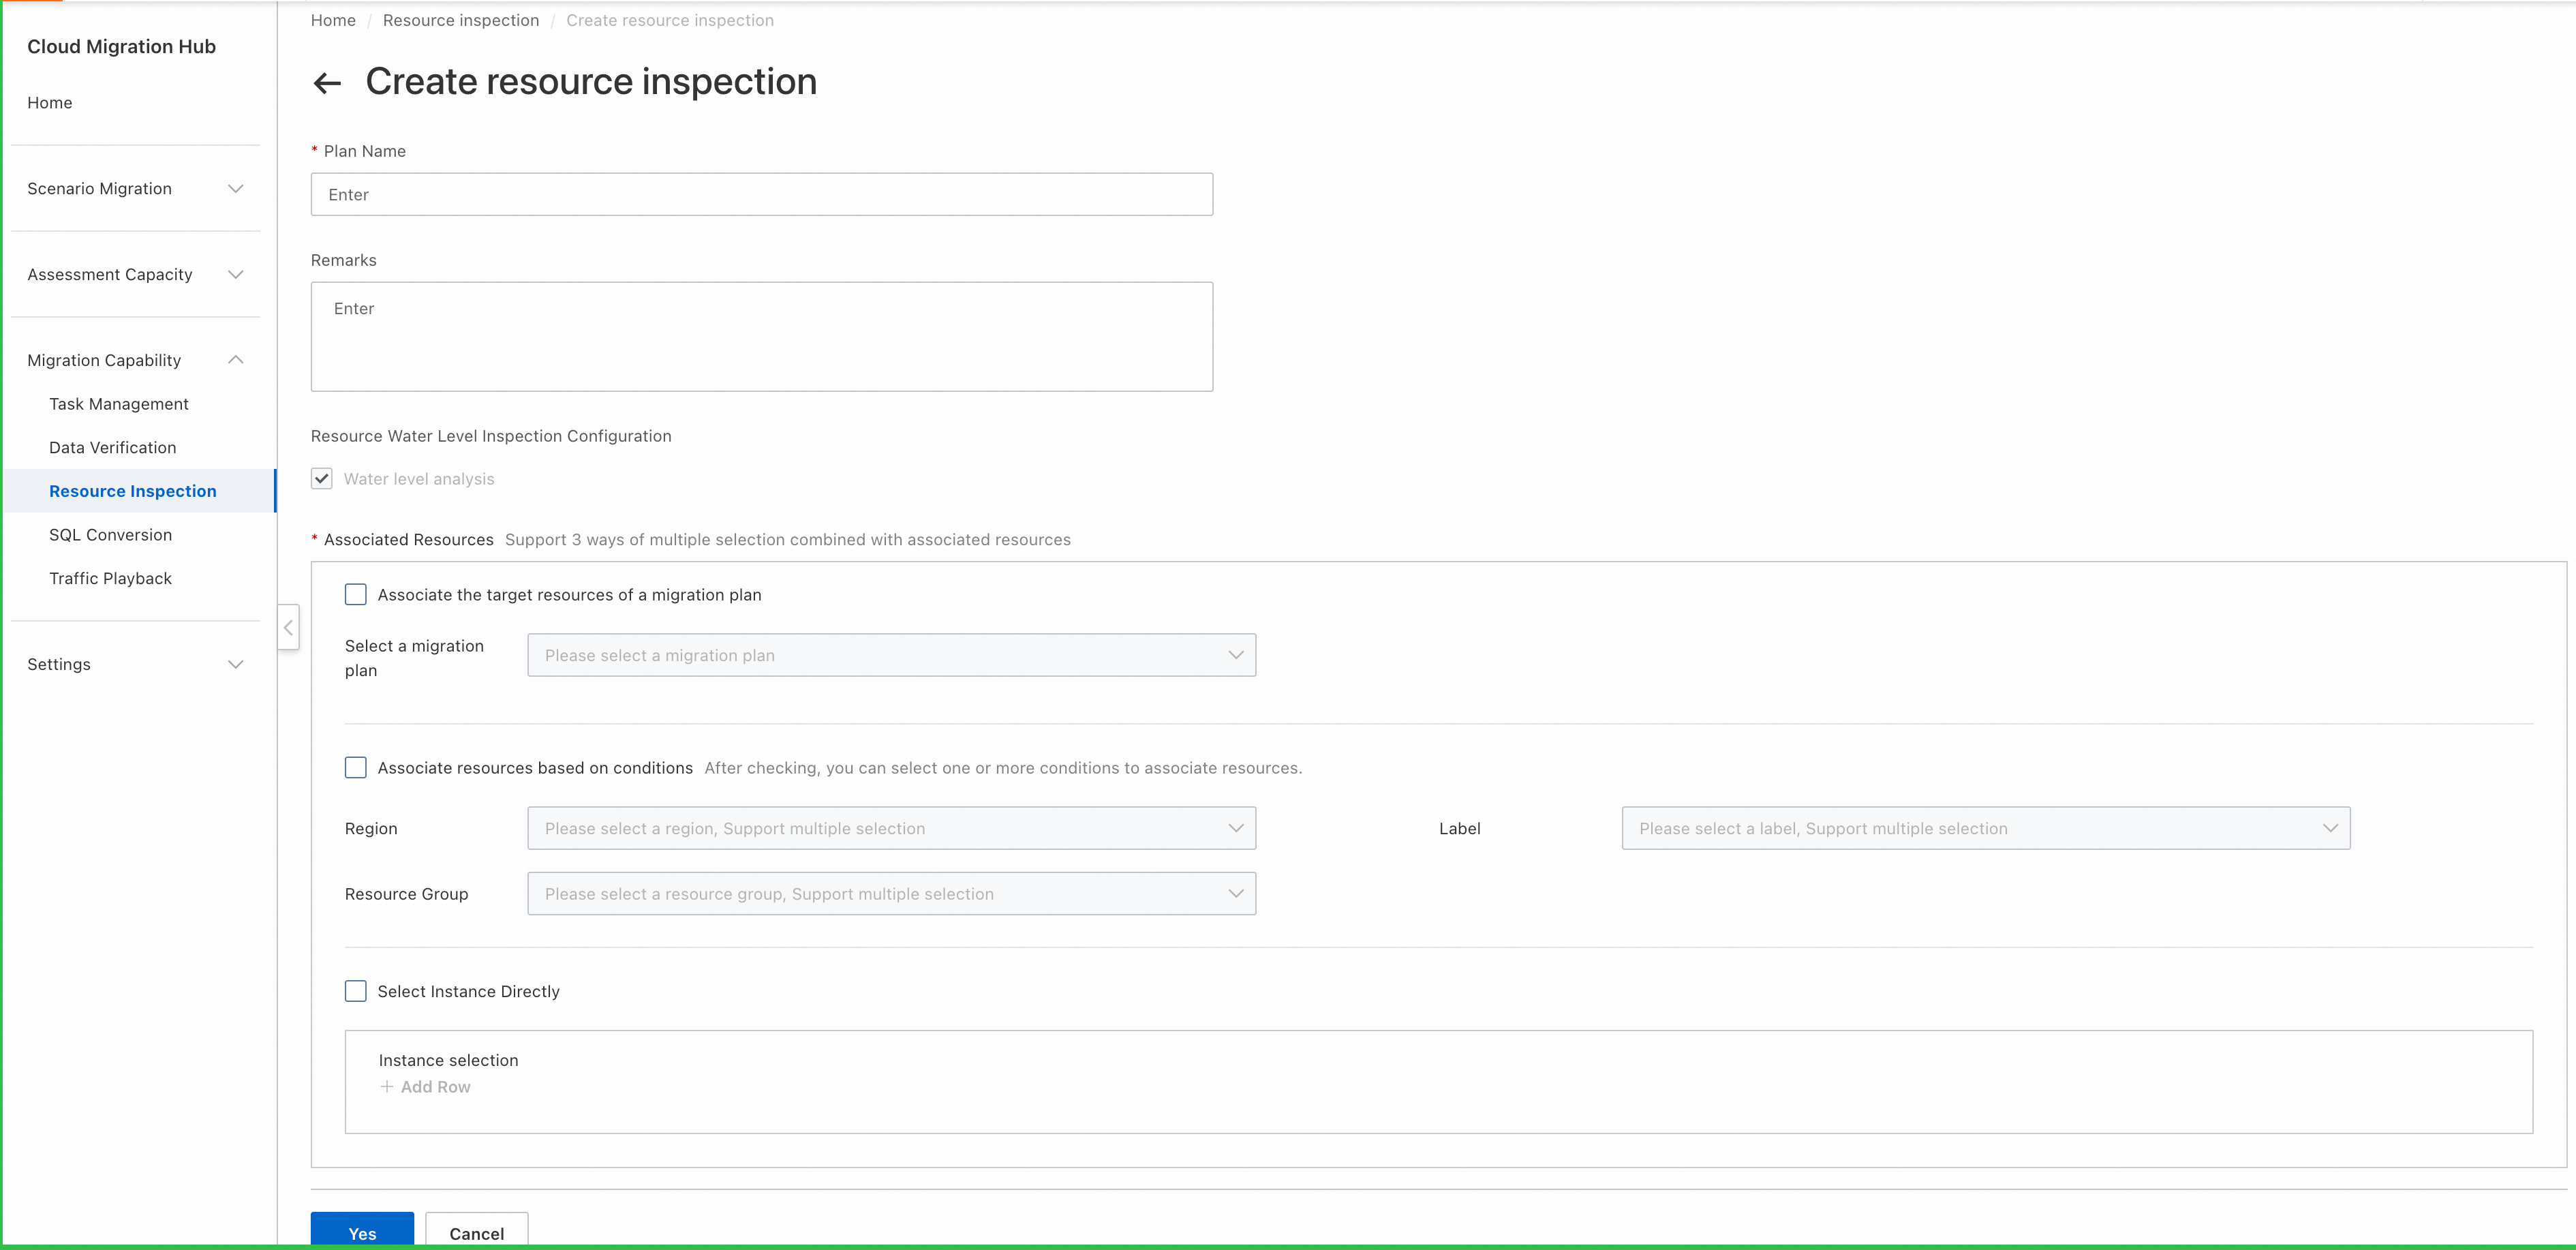
1. Associate the target resources of a migration plan
Performs inspection on the resources of a migration plan that is created in the CMH console.
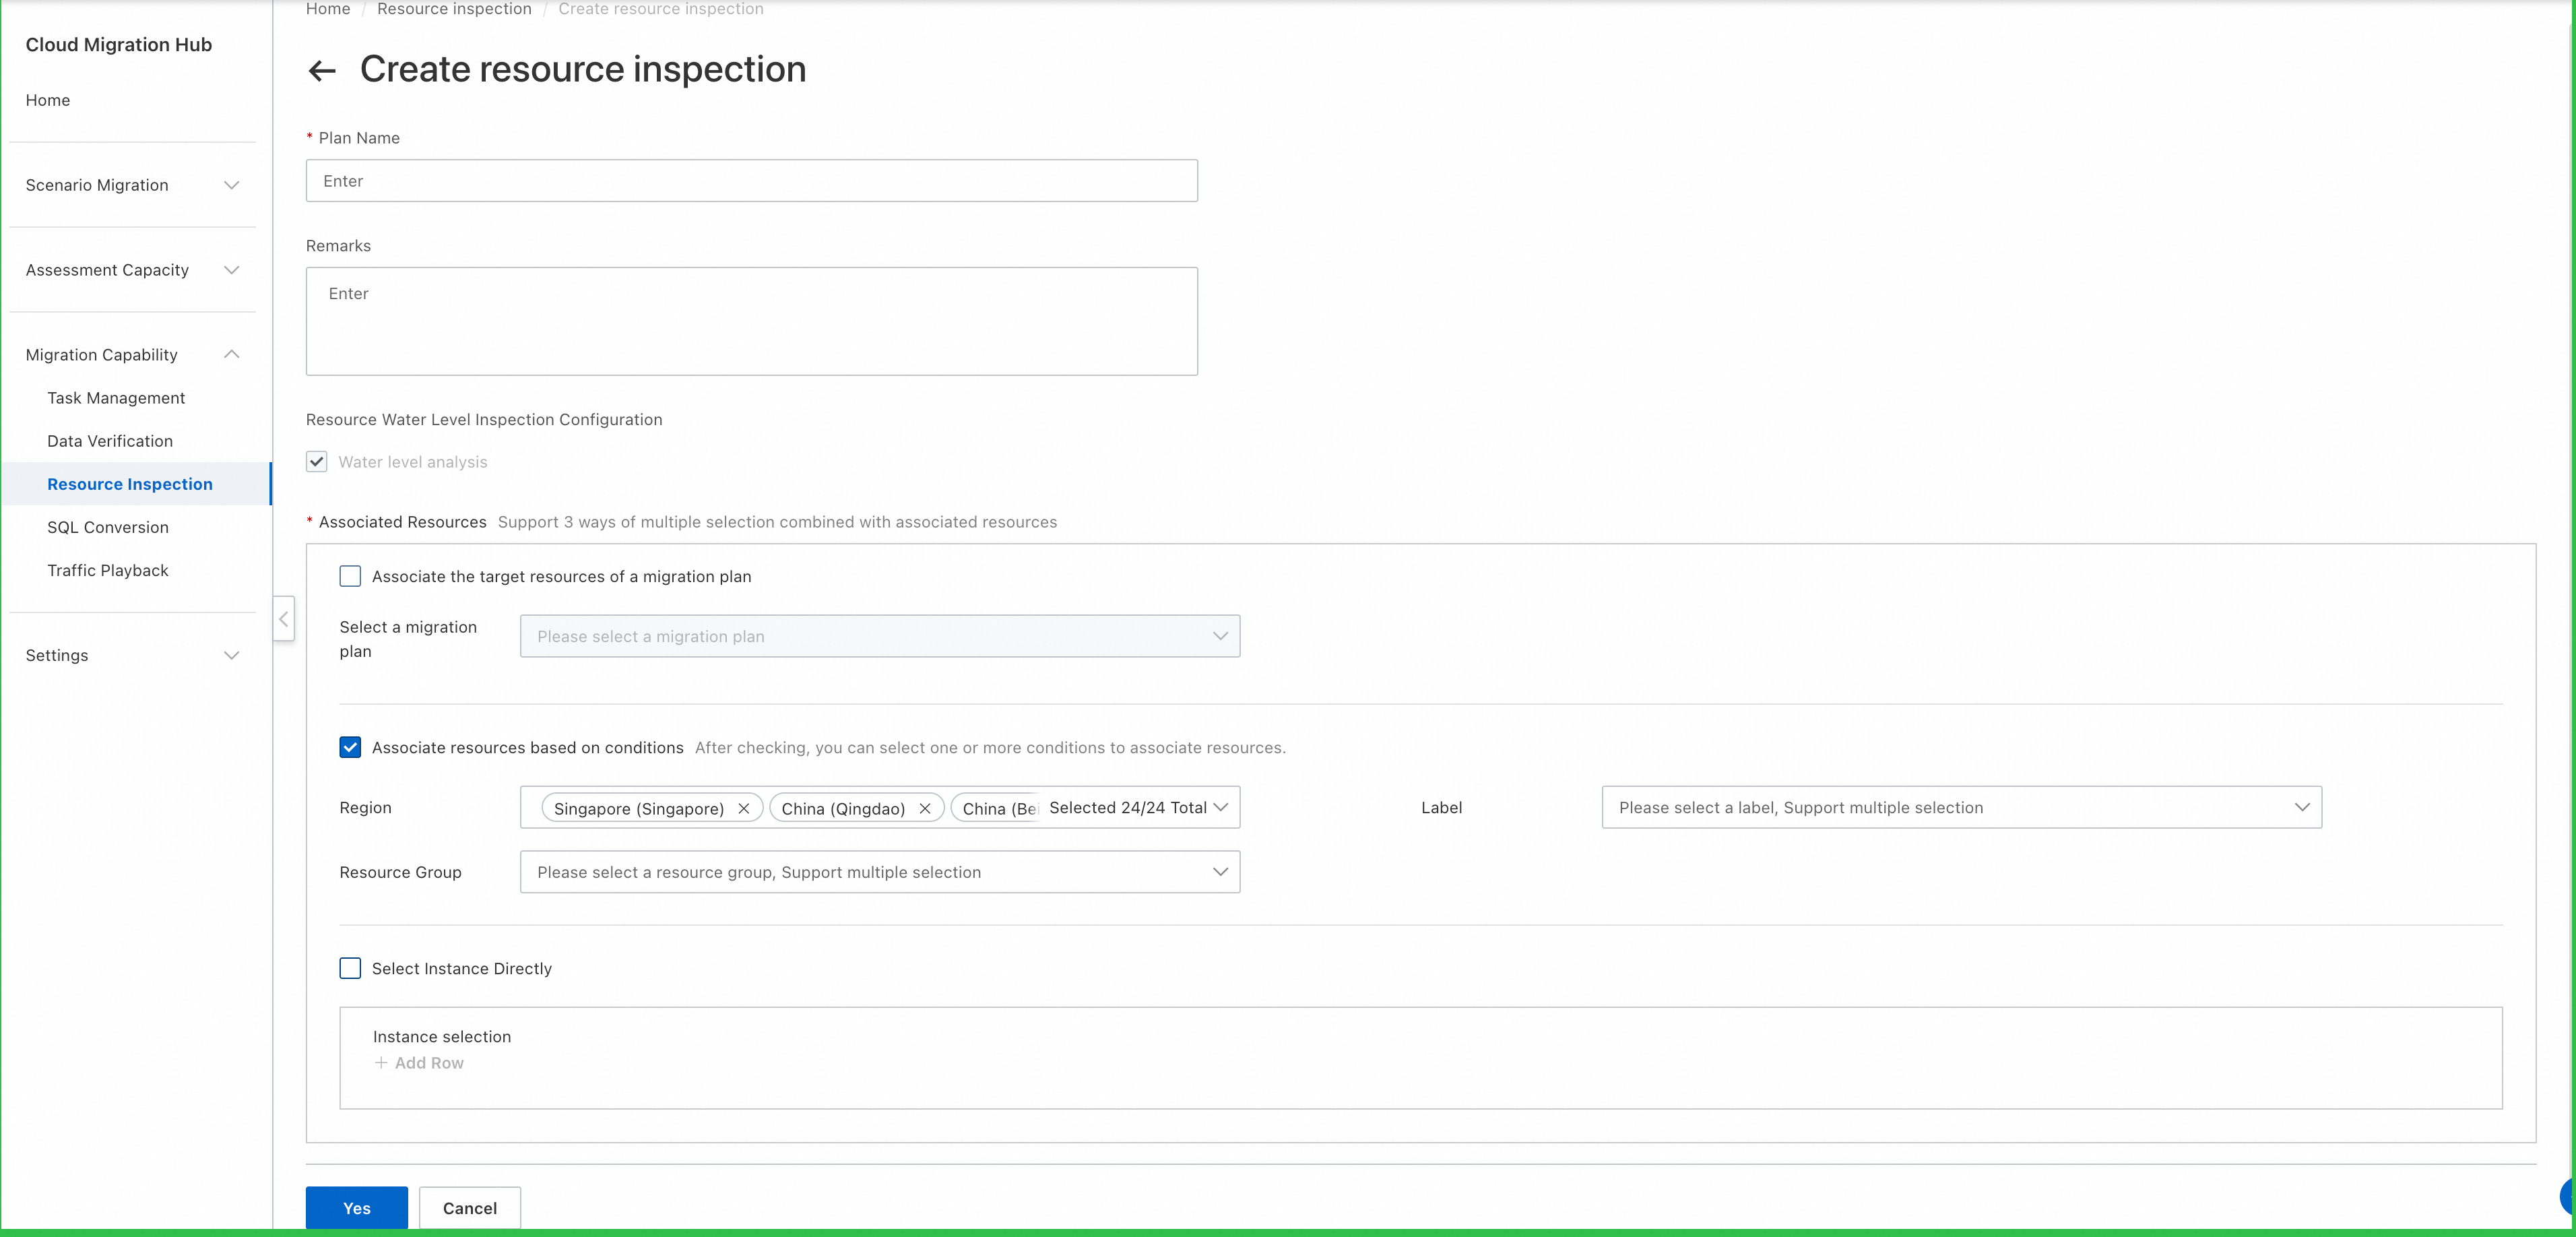
2. Associate resources based on conditions
Performs inspection on resources in the specified regions and to which the specified tags are added.
3. Select Instance Directly
Performs inspection on the specified instances.
Note: You can select all association methods to perform inspection. In this case, the system performs inspection on all resources that meet the conditions specified by the association methods.
After you complete the configurations, click Next.
In the Migration Task Association step, select forward Data Transmission Service (DTS) tasks. This allows you to create multiple reverse DTS tasks at a time in the cutover phase. For more information, see Create reverse DTS tasks. The Migration Task Association step is optional. If you do not need to create reverse DTS tasks, you can directly click Yes to create the resource inspection plan.
Run a resource inspection task
On the Resource inspection page, click the name of the resource inspection plan that you create to go to the details page. On the Resource water level analysis tab, click Initiate Task Analysis.

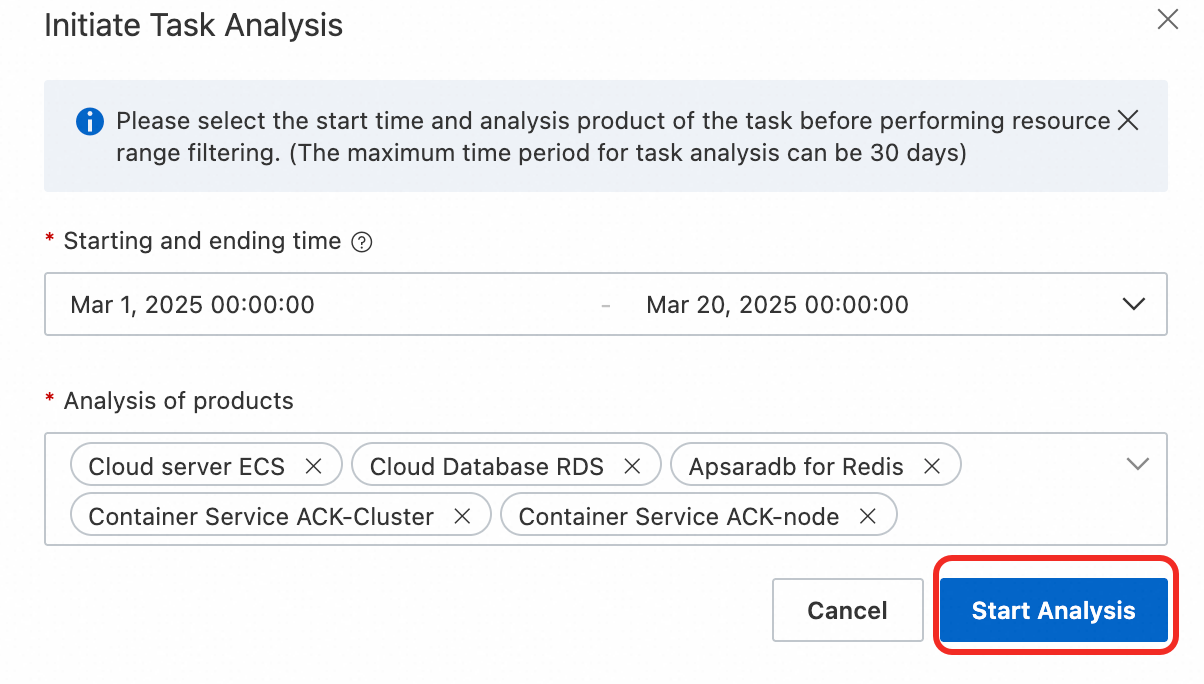
In the Initiate Task Analysis panel, configure the Starting and ending time and Analysis of products parameters. Then, click Start Analysis.
Wait until data is collected and the task is complete. The duration of the task varies based on the number of analyzed resources.
View resource inspection results
View current and historical records
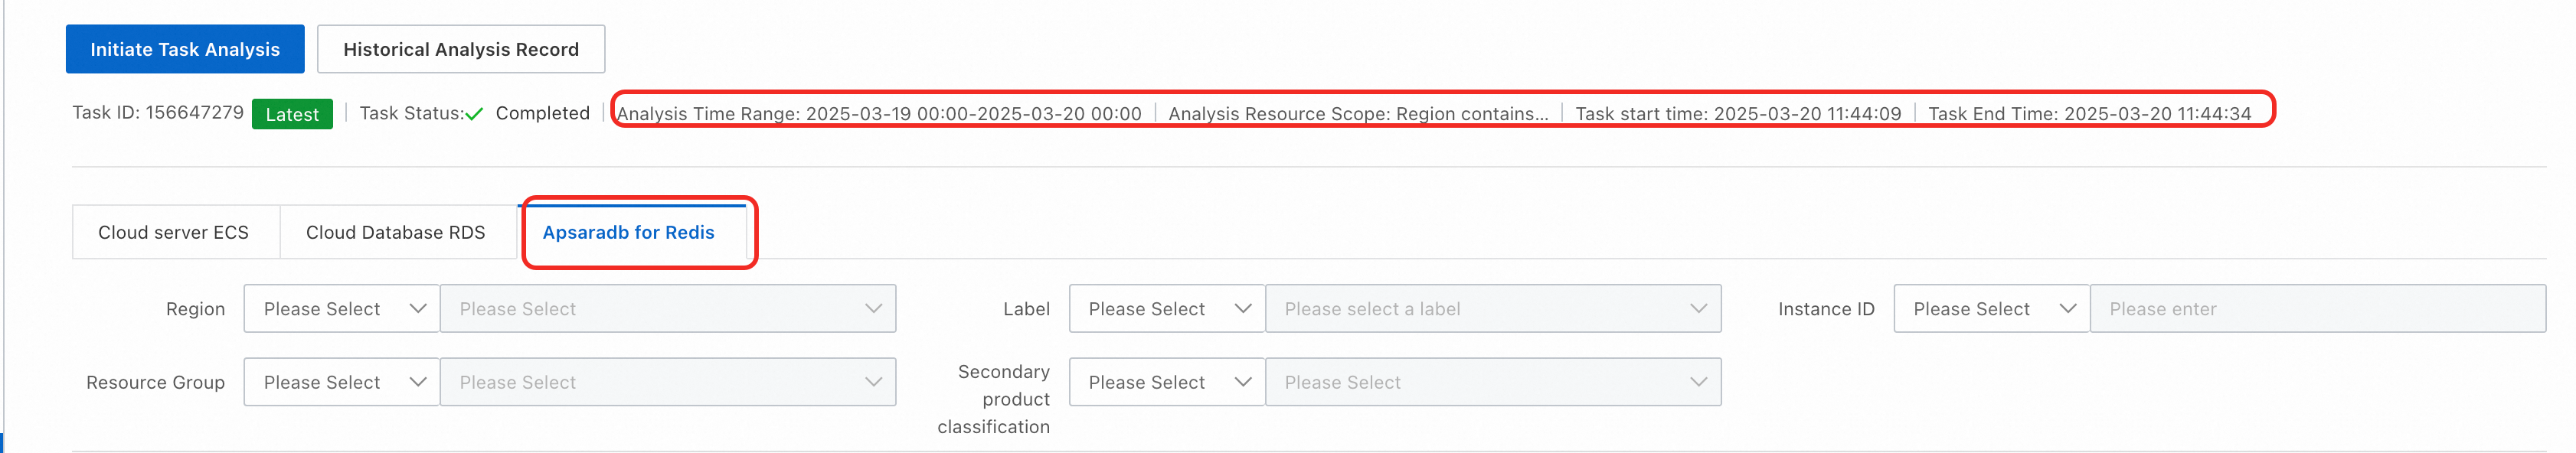
On the Resource water level analysis tab, the results of the previous resource inspection task are displayed by default. The Latest tag is displayed below the task ID.

If you want to view historical records, click Historical Analysis Record. In the Historical Analysis Record panel, all records are displayed.

View the results of a resource inspection task
Basic information
In the upper part of the Resource water level analysis tab, the basic information about the task is displayed, such as the task status, the time range of the resource usage analysis, the resources that are analyzed, and the start and end time of the task.
Service information
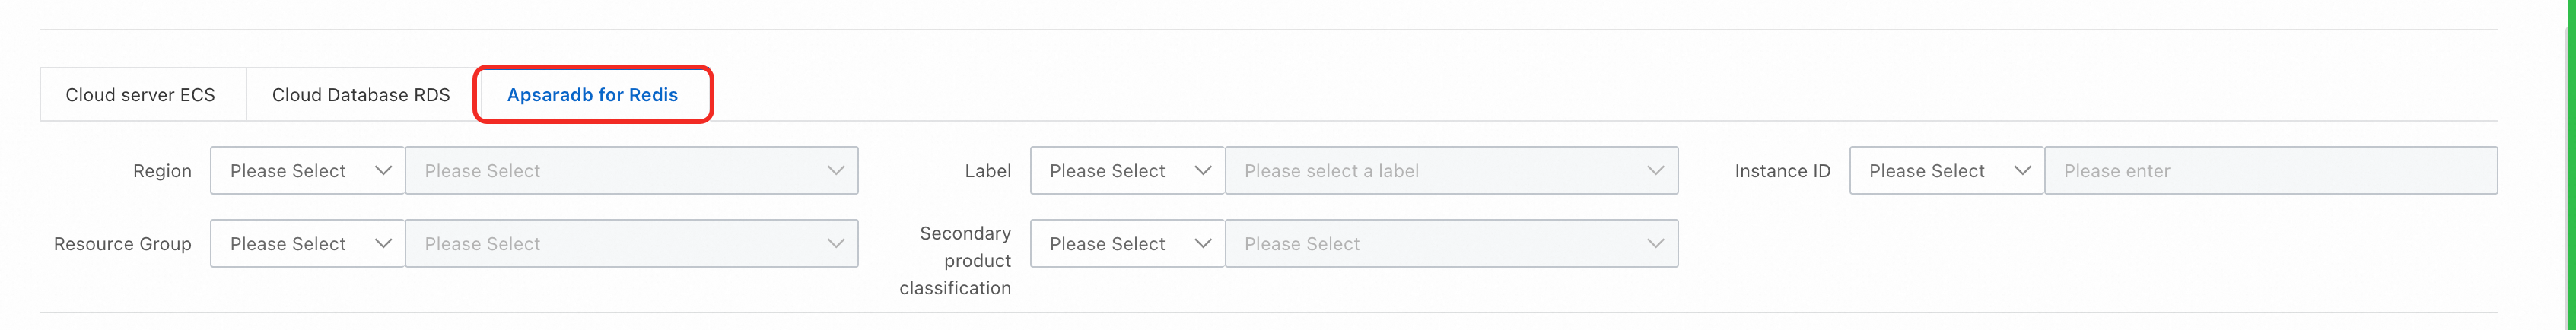
The resource usage analysis results of each cloud service are separately displayed on a tab. You can click the tabs to view the analysis results of various cloud services.
If risks are detected in a cloud service, a red number is displayed next to the tab name to indicate the number of risks. For example, the following figure shows that the usage of two Elastic Compute Service (ECS) resources exceeds the threshold.
Metric statistics charts
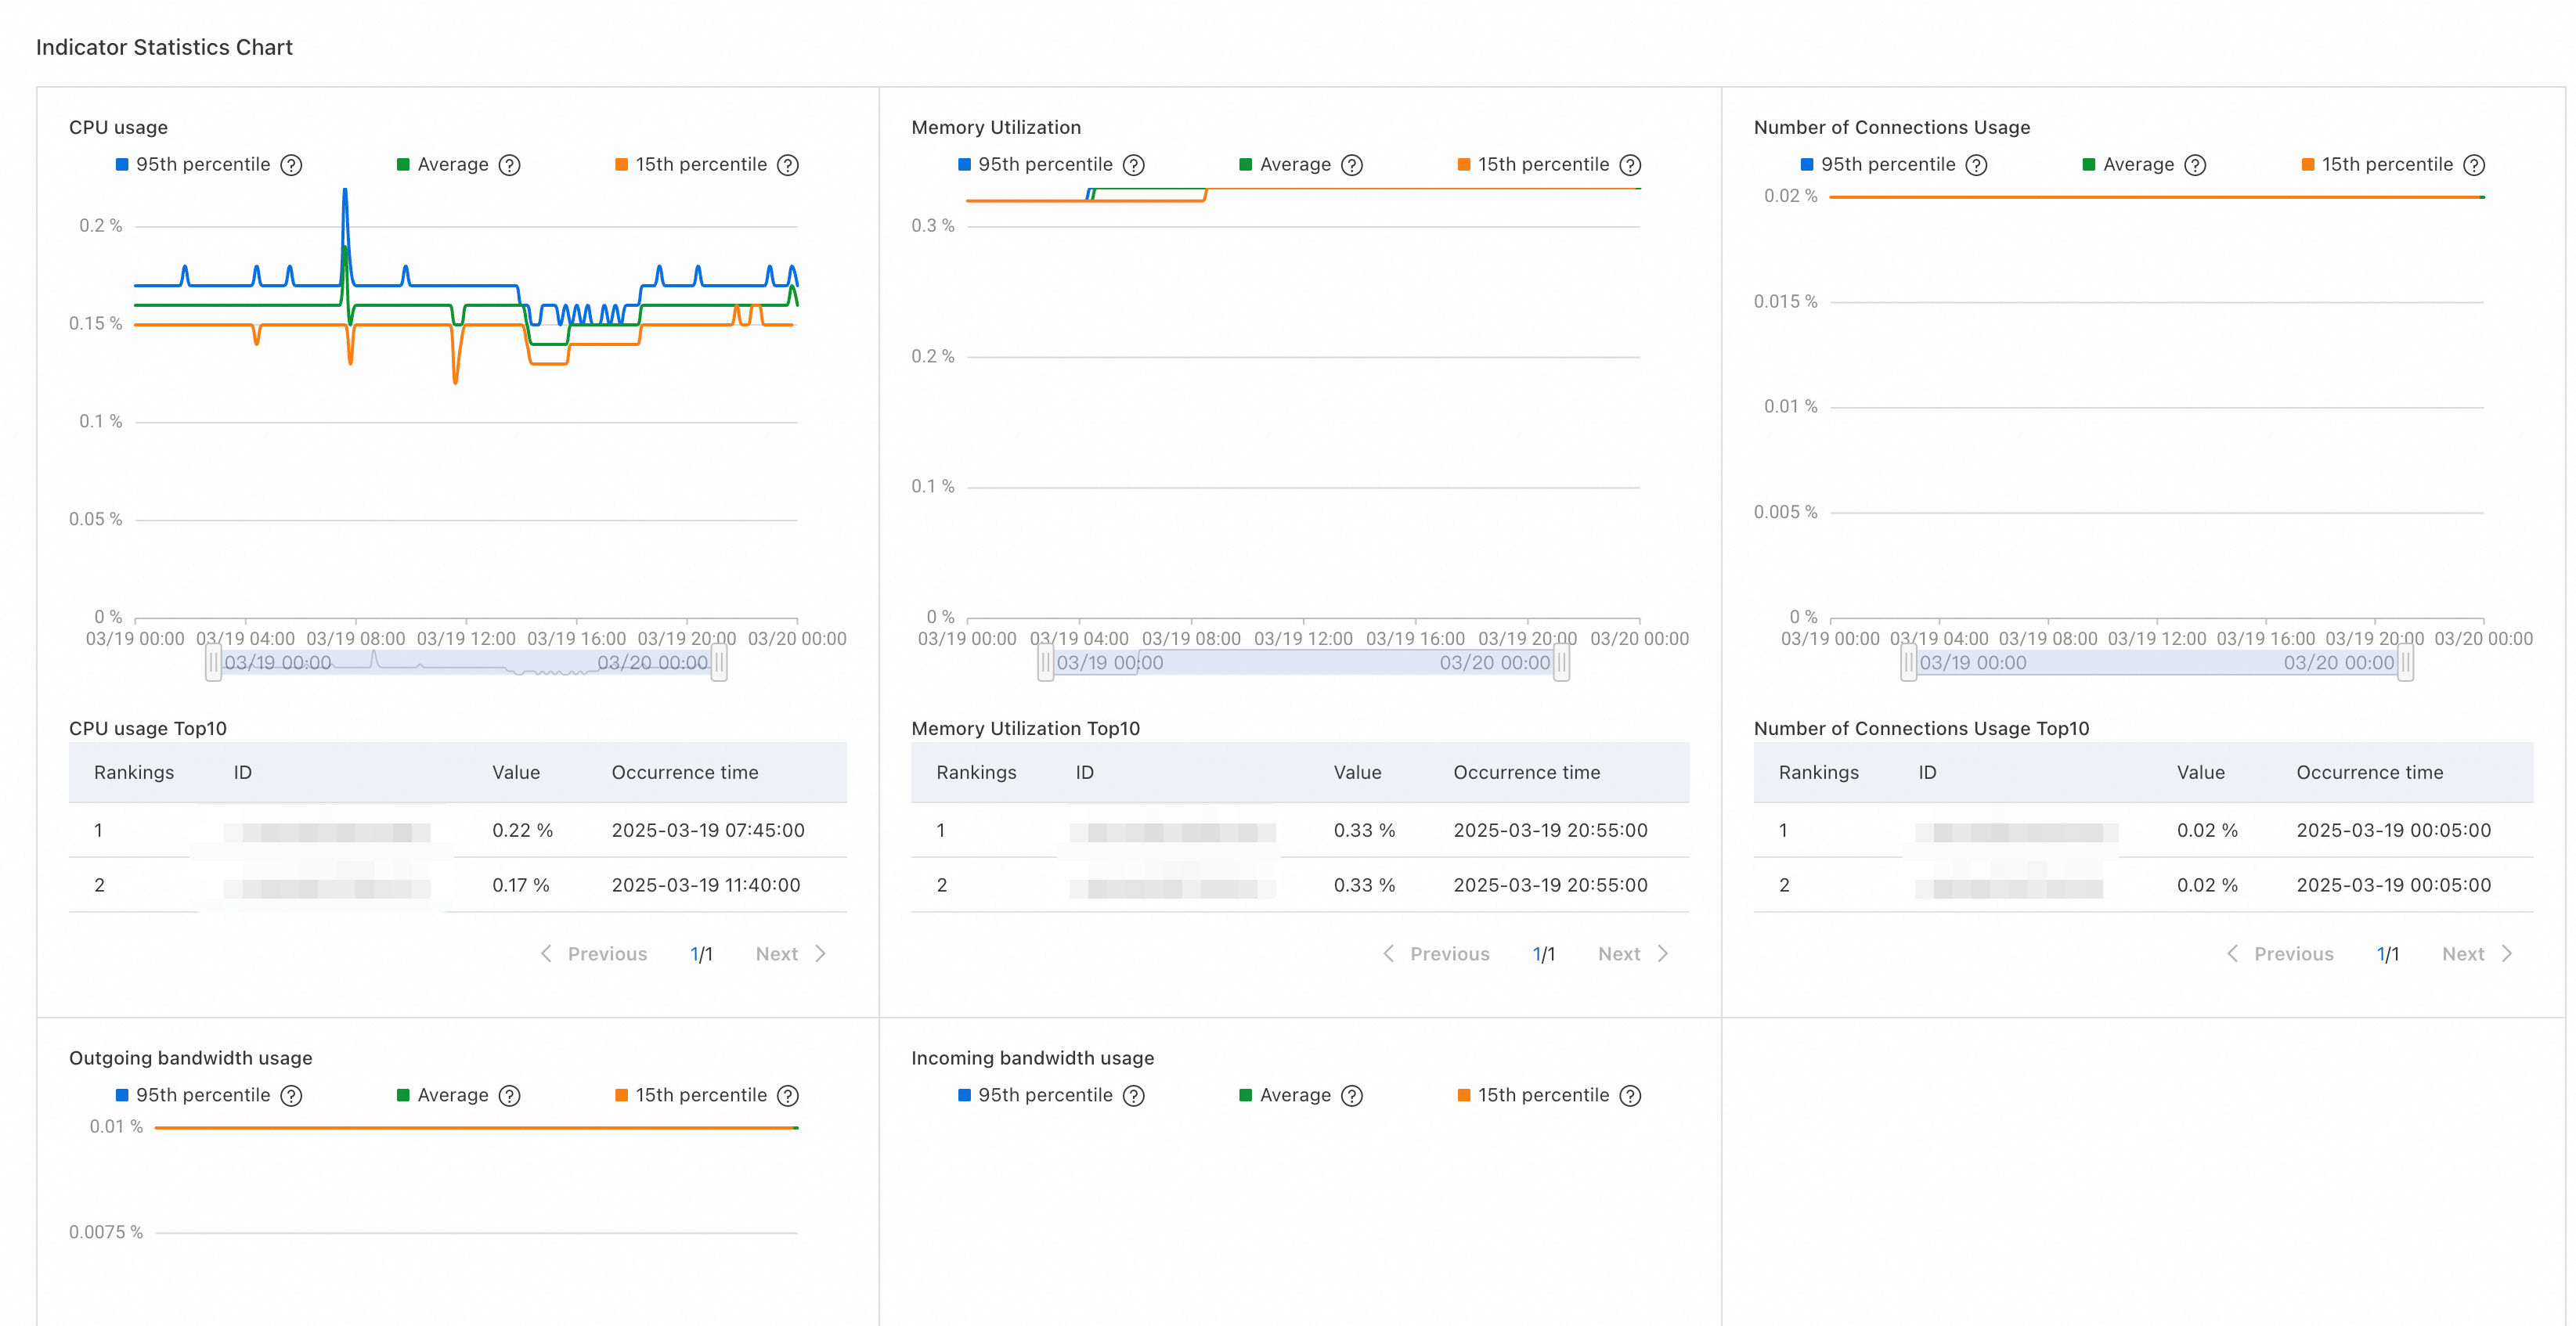
In the Indicator Statistics Chart section of a cloud service tab, you can view the line charts that display the core metrics of the cloud service and the IDs of users who occupy most resources.

You can specify filter conditions based on your business requirements. The line charts and rankings in the Indicator Statistics Chart section are automatically refreshed to display data based on the specified filter conditions.

A line chart shows the load trends of a resource and the top loads of the resource during a specific time period. You can also adjust the timeline below the chart based on your business requirements. The line chart and rankings of the resource are refreshed based on the specified time period.
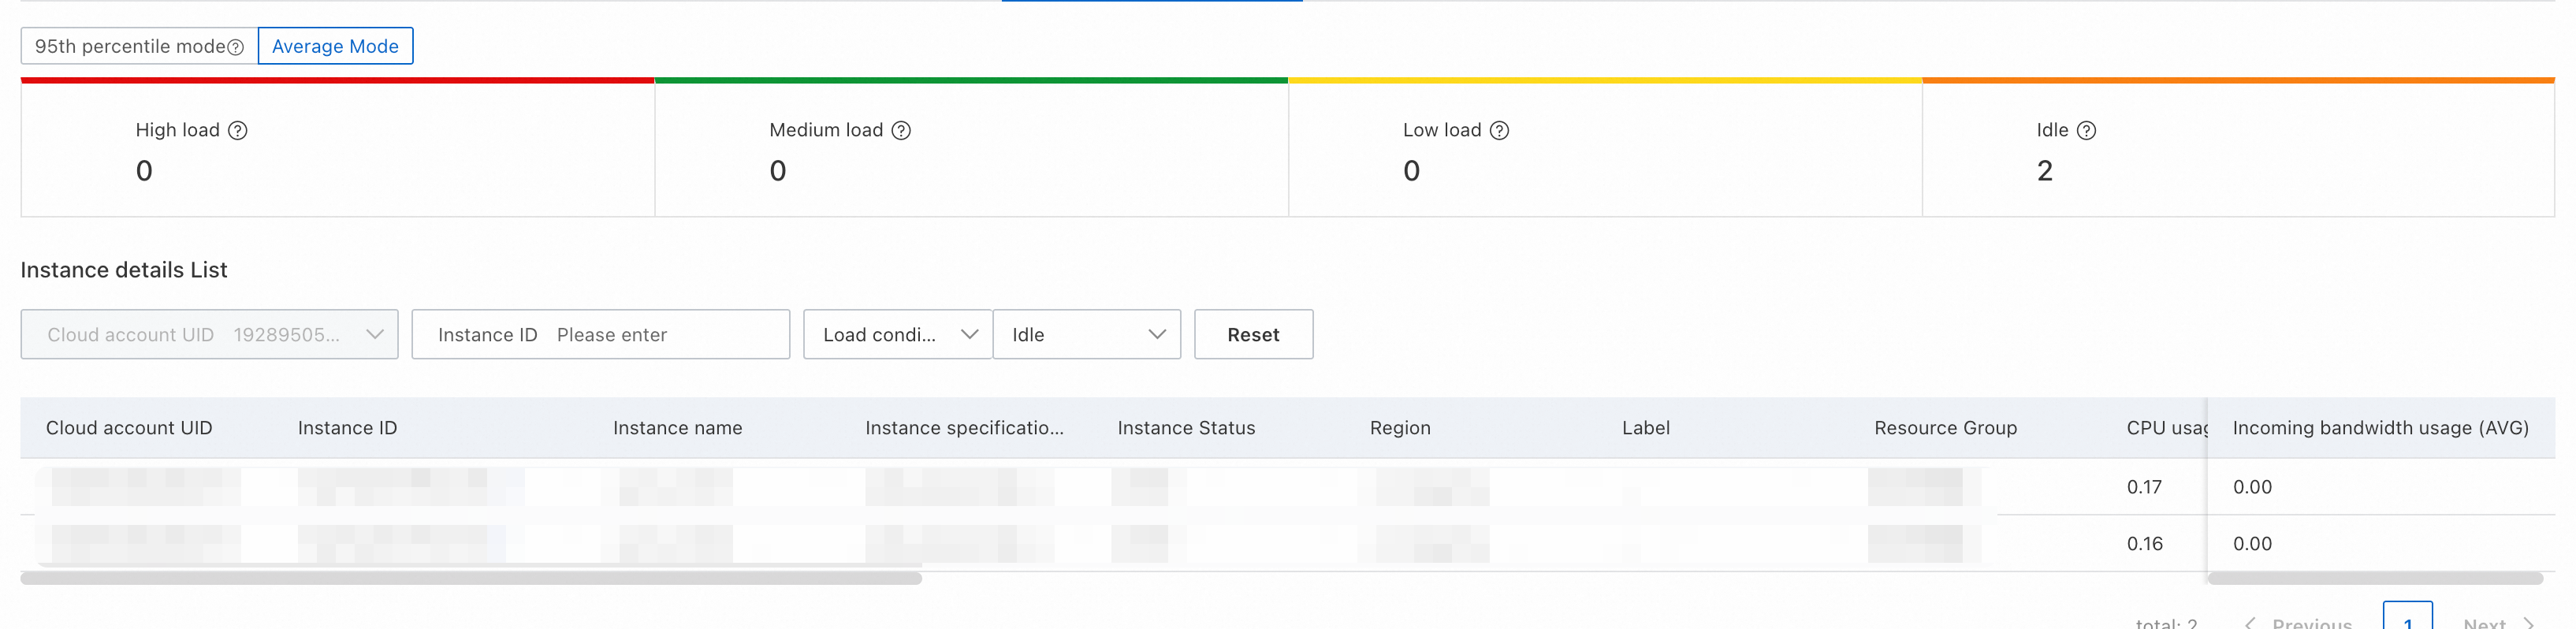
Instance load statistics
In the lower part of the cloud service tab, the detailed information about instances and instance loads are displayed for each metric separately on a tab.
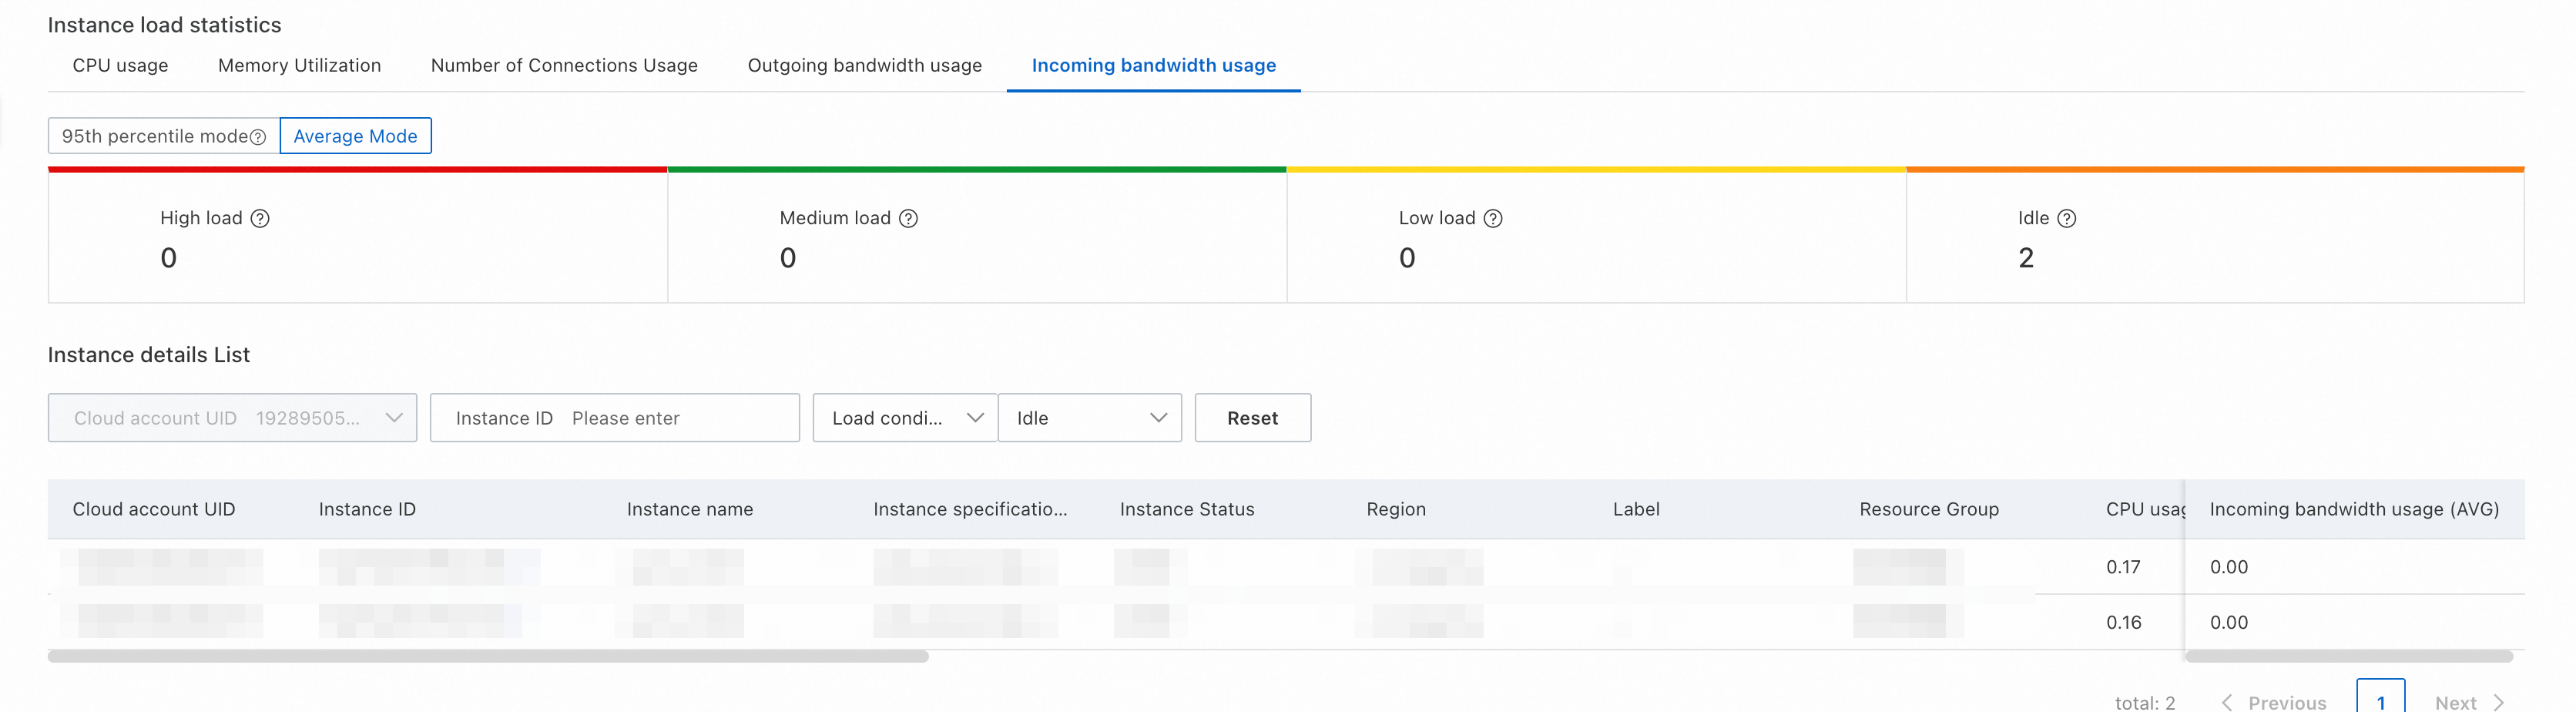
You can click the metric tabs to view the detailed information about a metric on the corresponding tab in 95th percentile mode or average mode.

The statistics on instance loads indicate the numbers of instances in different load states.

In the Instance details List section, the detailed information about the metrics of all instances of the cloud service is displayed. You can filter and export data based on your business requirements.