Manage processes, disks, services, users, and system resources on Linux servers through commonly used CLI commands.
Process management
ps
Command
The ps command displays a snapshot of current processes.
Common options
|
Option |
Description |
|
-A |
Displays all processes. |
|
-a |
Displays all processes on the controlling terminal. |
|
-e |
Displays all processes. Equivalent to -A. |
|
-f |
Displays a full-format listing, including UID, PPID, C, and STIME columns. |
|
-u |
Displays processes by effective user. |
|
-U |
Displays processes by real user. |
|
-x |
Displays all processes without controlling terminals. |
For other options, run man ps.
Examples
-
Query all processes.
ps -ef -
Query all processes matching a keyword in full format.
ps -ef | grep <key_word>Replace
<key_word>with an actual keyword. -
Query all user processes matching a keyword, including those without controlling terminals.
ps -aux | grep <key_word>Replace
<key_word>with an actual keyword. -
Query a process tree.
ps -ejH -
Query all processes with thread information.
ps -eLf -
Query thread information with user-defined fields.
ps -eo pid,tid,class,rtprio,ni,pri,psr,pcpu,stat,wchan:14,comm -
Query a specific metric by PID. In this example, PID 1 with
comm=returns the command name.ps -q 1 -o comm=
top
Command
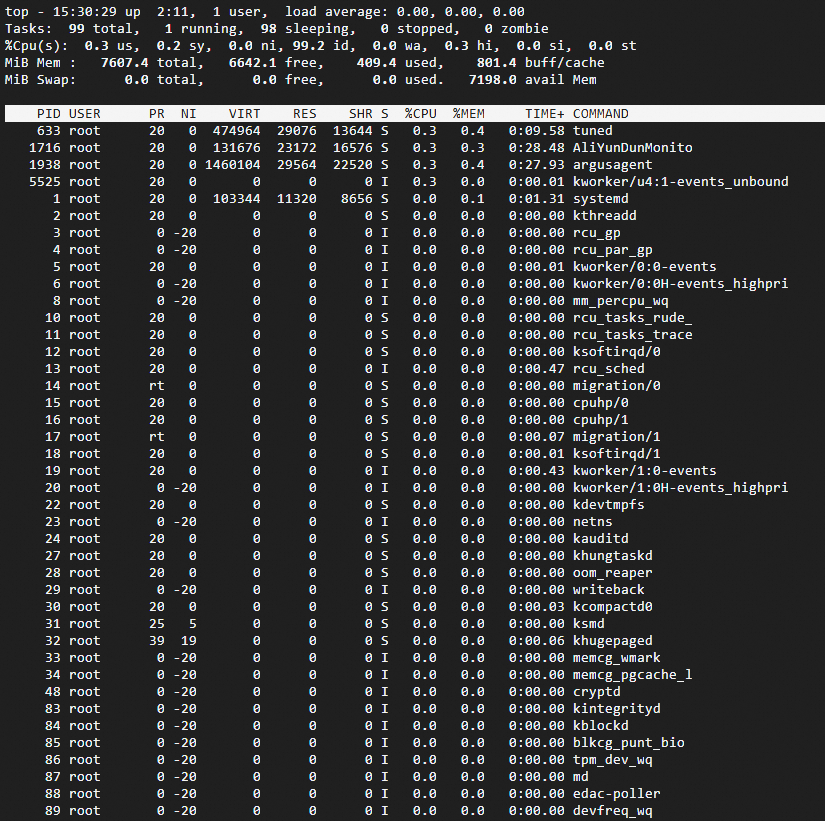
The top command displays real-time process activity and system resource usage.
Common options
|
Option |
Description |
|
-d |
Specifies the refresh frequency. |
|
-p |
Monitors the status of a process by PID. |
|
-s |
Runs top in secure mode, disabling potentially dangerous interactive commands. |
|
-i |
Ignores idle and zombie processes. |
|
-c |
Displays the command line instead of only the command name. |
Fields in a top command output
Fields in a top command output (values vary by sampling period):
Fields
Examples
-
Query system metrics with a specific sampling frequency
Query system metrics at a 3-second interval:
top 3NoteThe default sampling interval of top is 5 seconds.
-
Customize the top command interface
By default, the fields described in the Fields in the system information summary and process list section are displayed. Press
fto select which columns to display and rearrange column order.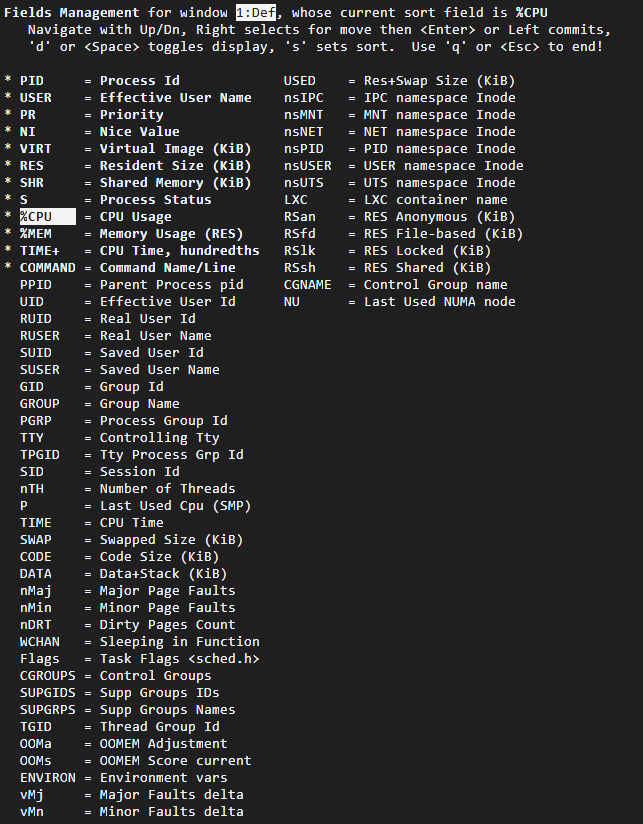
Keys for managing the top command interface:
Key
Description
↑ and ↓
Scrolls up and down to select fields.
→
Selects an entire column. Press UP or DOWN to move it.
Space
Toggles field visibility. An asterisk (*) indicates the field is displayed.
s
Sets the current column as the sorting column.
q
Exits the top command interface.
-
Use the top command in interactive mode
In interactive mode, press keys to control the display:
Key
Description
1
Displays per-logical-CPU status.
u
Filters processes by user.
E
Cycles the memory unit: KiB, MiB, GiB, TiB, PiB, or EiB.
x
Highlights the sorting column.
y
Highlights running processes.
?
Displays help information.
-
Query the names and directories of processes by PID
Run
topto find a process PID. In this example, the aliyun-service process has PID 1325.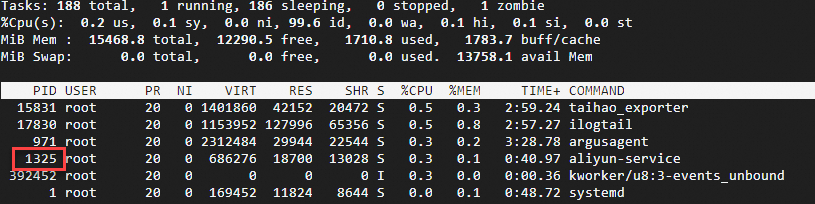
Query the directory of the aliyun-service process:
cd /proc/1352
ls -ail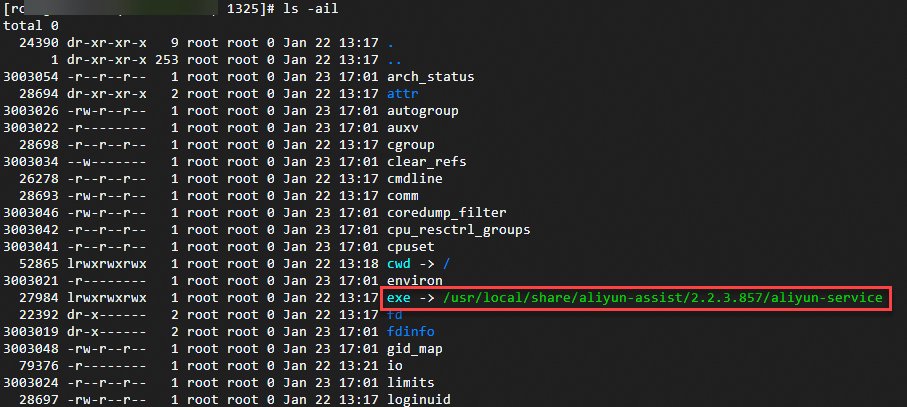
-
Terminate a process by PID
In interactive mode, press
k, enter a PID, and pressEnterto terminate the process.
kill
Command
The kill command terminates processes by sending signals.
Common options
|
Option |
Description |
|
-l |
Displays all available signal names. |
|
-L |
Displays all signal names and the corresponding numbers. |
Examples
-
Terminate all processes.
sudo kill -9 -1 -
Display the name of the signal whose number is 11.
sudo kill -l 11 -
Display all signal names and the corresponding numbers.
sudo kill -L -
Terminate a process by PID.
sudo kill -9 <PID>Replace
<PID>with an actual PID.
killall
Command
The killall command terminates all processes matching a name.
Common options
|
Option |
Description |
|
-g |
Terminates processes in the process group. |
|
-i |
Requests user confirmation before terminating a process. |
|
-v |
Reports whether the signal is sent. |
Examples
Terminate the top process.
sudo killall topSystem information
Query system and hardware information with uname and dmidecode.
uname
Command
The uname command displays system information.
Common options
|
Option |
Description |
|
-a |
Displays all system information. |
|
-s |
Displays the kernel name. |
|
-n |
Displays the hostname of the network node. |
|
-r |
Displays the kernel release. |
|
-v |
Displays the kernel version. |
|
-m |
Displays the machine hardware name. |
|
-P |
Displays the processor type. |
|
-i |
Displays hardware platform information. |
|
-o |
Displays operating system information. |
Examples
-
Query all system information.
uname -a -
Run
uname -morarchto query the CPU architecture. Output varies by architecture.Command output for the Arm architecture

Command output for the x86 architecture

dmidecode
The dmidecode command extracts hardware information from the system BIOS via the DMI table, including:
-
System information: vendor, name, version, serial number (SN), and model.
-
Processor information: model, speed, and core count.
-
Memory information: slot count, sizes, types, and speeds.
-
Motherboard information: vendor, version, and SN.
-
BIOS information: version and release date.
-
Power supply information: specifications and models.
-
Device information: hardware components such as network adapters.
-
Display all hardware information from the DMI table.
sudo dmidecode -
To display only entries of a specific type, use the
-toption. For example, display memory entries:sudo dmidecode -t memory
Physical CPU and memory information
-
Total number of cores = Number of physical CPUs × Number of cores per physical CPU
-
Total number of logical CPUs = Number of physical CPUs × Number of cores per physical CPU × Hyper-Threading factor
Common commands for querying CPU and memory details:
-
Query the number of physical CPUs.
cat /proc/cpuinfo| grep "physical id"| sort| uniq| wc -l -
Query the number of cores per physical CPU.
cat /proc/cpuinfo| grep "cpu cores"| uniq -
Query the number of logical CPUs.
cat /proc/cpuinfo| grep "processor"| wc -l -
Query the CPU model.
cat /proc/cpuinfo | grep name | cut -f2 -d: | uniq -c -
Query memory information.
cat /proc/meminfo
Query CPU details
Run lscpu to query CPU details. Output varies by architecture.
-
Command output for the Arm architecture

-
Command output for the x86 architecture

Query operating system information
Run cat /proc/version to query operating system information and compiler version. Output varies by architecture.
-
Command output for the x86 architecture

-
Command output for the Arm architecture

Disk management
df
Command
The df command reports file system disk space usage.
Common options
|
Option |
Description |
|
-a |
Includes pseudo, duplicate, and inaccessible file systems. |
|
-B |
Scales block sizes by the specified size for output. |
|
-h |
Displays sizes in human-readable format using a scale factor of 1,024. Example: 1023M. |
|
-H |
Displays sizes in human-readable format using a scale factor of 1,000. Example: 1.1G. |
|
-k |
Equivalent to -- block-size=1K. |
|
-l |
Displays a list of local file systems. |
|
-t |
Displays information about file systems of the specified type. |
Examples
Query disk space usage with block sizes in MB.
df -BMSample output:
Filesystem     1M-blocks  Used Available Use% Mounted on
tmpfs               742M   22M      721M   3% /run
/dev/vda3         39943M 2542M    35556M   7% /
tmpfs              3708M    0M     3708M   0% /dev/shm
tmpfs                 5M    0M        5M   0% /run/lock
tmpfs               742M    1M      742M   1% /run/user/0
lsblk
Command
The lsblk command displays block device details.
Common options
|
Option |
Description |
|
-a |
Displays all devices, including empty and memory disk devices. |
|
-b |
Displays sizes in bytes. |
|
-f |
Displays file system information. |
Examples
-
Query block devices with file system information.
lsblk -fSample output:
NAME FSTYPE FSVER LABEL UUID FSAVAIL FSUSE% MOUNTPOINTS vda |-vda1 |-vda2 vfat FAT32 6175-F96E `-vda3 ext4 1.0 df02e0a1-d28d-41b1-99c2-58f2b684cc79 34.7G 6% / -
Query the SN of a disk.
The method varies by Linux distribution. For Alibaba Cloud Linux 3, CentOS 7, or Ubuntu 18:
-
Query block storage devices mounted in the OS.
lsblk -
Query the SN of a block storage device. For example, query the SN of /dev/vda:
udevadm info --query=all --name=/dev/vda | grep ID_SERIAL
-
blkid
Command
The blkid command displays block device attributes.
Examples
Query the attributes of a block device.
blkid /dev/vdaSample output:
/dev/vda: PTUUID="bdee1c7f-46fc-4838-9a74-9exxxxxxxxaf" PTTYPE="gpt"fdisk
Command
The fdisk command manages disk partition tables.
Common options
|
Option |
Description |
|
-l |
Displays the partition tables of the specified devices. |
|
-u |
Displays partition information in sectors instead of cylinders. |
Examples
Query all disk partition tables with partition information in sectors.
sudo fdisk -luSample output:
Disk /dev/vda: 40 GiB, 42949672960 bytes, 83886080 sectors
Units: sectors of 1 * 512 = 512 bytes
Sector size (logical/physical): 512 bytes / 512 bytes
I/O size (minimum/optimal): 512 bytes / 512 bytes
Disklabel type: gpt
Disk identifier: BDEE1C7F-46FC-4838-9A74-9E57F8FD63AF

Device      Start      End  Sectors  Size Type
/dev/vda1    2048     4095     2048    1M BIOS boot
/dev/vda2    4096   413695   409600  200M EFI System
/dev/vda3  413696 83886046 83472351 39.8G Linux filesystem
mount
Command
The mount command mounts file systems.
Common options
|
Option |
Description |
|
-a |
Mounts all file systems configured in the |
|
-L |
Mounts the partition that has the specified label. |
|
-r |
Mounts the file system read-only. |
|
-w |
Mounts the file system read/write. |
|
-U |
Mounts the partition that has the specified |
Examples
-
Mount all file systems that are configured in the /etc/fstab file.
sudo mount -a -
Mount a file system read/write.
sudo mount -w /dev/vdb1 /mnt
umount
Command
The umount command unmounts file systems.
Common options
|
Option |
Description |
|
-r |
Remounts the file system read-only if unmounting fails. |
|
-a |
Unmounts all file systems configured in the |
|
-t |
Specifies the file system type to unmount. Separate multiple types with commas (,). |
|
-f |
Forcefully unmounts the file system. |
Examples
Forcefully unmount the file system from a partition.
sudo umount -f /dev/vdb1Service management
systemctl
Command
The systemctl command manages systemd services and units.
Common options
|
Option |
Description |
|
-a |
Displays all loaded units or attributes. |
Common unit commands
|
Command |
Description |
|
start |
Starts the specified loaded units. |
|
stop |
Stops the specified loaded units. |
|
restart |
Restarts the specified loaded units. |
|
reload |
Reloads the configuration of the specified units. |
|
status |
Displays the runtime status of the specified units. Common states:
|
Common unit file commands
|
Command |
Description |
|
enable |
Enables the specified units or unit instances. |
|
disable |
Disables the specified units or unit instances. |
Examples
-
Restart the
NGINXservice.sudo systemctl restart nginx -
Check the runtime status of the
NGINXservice.sudo systemctl status nginx -
Enable the
NGINXservice to start on boot.sudo systemctl enable nginx -
List all services enabled to start on boot.
sudo systemctl list-unit-files --type=service --state=enabled
Resource usage
lsof
Command
The lsof command lists open files and their associated processes.
If lsof is not pre-installed, install it with a package manager.
-
Alibaba Cloud Linux, CentOS, and RHEL:
sudo yum install lsof. -
Ubuntu and Debian:
sudo apt install lsof.
Common options
|
Option |
Description |
|
-p |
Displays files opened by a process. |
|
-l |
Replaces a user ID with a username in the output. |
|
-u |
Displays files opened by a user. |
|
-c |
Displays opened files in the |
|
-d |
Displays opened files that include specific file descriptors. |
|
-i |
Displays open files matching the specified condition. Options:
|
Command output
Sample lsof output:
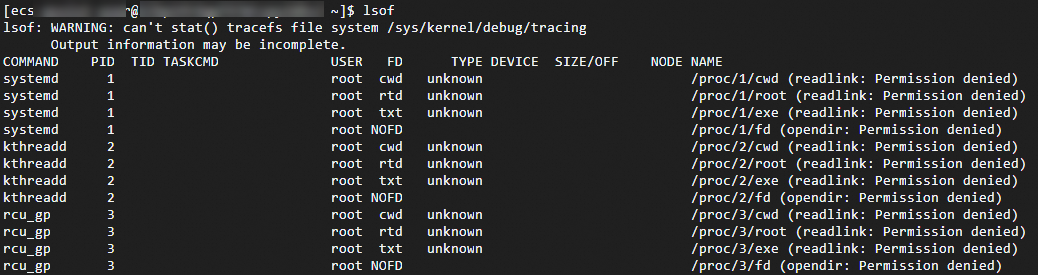
Output fields:
|
Option |
Description |
|
COMMAND |
Command name. |
|
PID |
Process ID. |
|
TID |
Thread ID. Blank indicates a process. |
|
TASKCMD |
Task name, usually the same as COMMAND. |
|
USER |
User ID or logon username. |
|
FD |
File descriptor. |
|
TYPE |
Node type associated with the file. |
|
DEVICE |
Device number. |
|
SIZE/OFF |
File size or offset in bytes. |
|
NODE |
File node number. |
|
NAME |
Mount point and file system name. |
Examples
-
Query files opened by a process.
sudo lsof -p 1Replace
1with an actual PID. -
Query files opened by a user.
sudo lsof -u <user-name>Replace
<user-name>with an actual username. -
Query information about the process that opens a specific file.
sudo lsof <file-name>Replace
<file-name>with an actual file name. -
Query open files for IPv4 network connections.
sudo lsof -i 4
netstat
Command
The netstat command displays network connections, routing tables, and protocol statistics.
Common options
|
Option |
Description |
|
-t |
Displays only TCP options. |
|
-u |
Displays only UDP options. |
|
-i |
Displays a list of network interfaces. |
|
-n |
Displays numerical addresses instead of resolving to hostnames. |
|
-l |
Displays only listening sockets. |
|
-p |
Displays processes associated with connections. |
|
-s |
Displays network statistics. |
Examples
-
Query network statistics for port 8000.
netstat -tunlp | grep 8000Replace
8000with an actual port number. -
Query all listening TCP ports and their processes.
netstat -ntlp
vmstat
Command
The vmstat command reports virtual memory, process, and CPU statistics.
Common options
Syntax:
vmstat [-n] [delay [count]] |
Option |
Description |
|
-n |
Displays the column header only once. |
|
[delay] |
Time interval between updates in seconds. Without this option, only one report is printed. |
|
[count] |
Number of updates. Without this option and with [delay] specified, vmstat runs indefinitely. Press |
Examples
Report CPU usage four times at 1-second intervals:
vmstat -n 1 4Sample output:
procs -----------memory---------- ---swap-- -----io---- -system-- ------cpu-----
 r  b   swpd   free   buff  cache   si   so    bi    bo   in   cs us sy id wa st
 1  0      0 2684984 310452 2364304    0    0     5    17   19   35  4  2 94  0  0
 0  0      0 2687504 310452 2362268    0    0     0   252 1942 4326  5  2 93  0  0
 0  0      0 2687356 310460 2362252    0    0     0    68 1891 4449  3  2 95  0  0
 0  0      0 2687252 310460 2362256    0    0     0     0 1906 4616  4  1 95  0  0
Key fields:
-
r: threads waiting for CPU time. A larger value indicates a slower system.
-
us: CPU time in user mode. Values above 50% suggest the need for program optimization.
-
sy: CPU time in kernel mode.
-
wa: CPU time waiting for I/O. High values may indicate excessive random disk access or a disk bottleneck.
-
id: CPU idle time. If this value stays at 0 and sy is twice us, a CPU resource shortage exists.
User logon information
User logon records are stored in the following files:
-
User logon information is recorded in
/var/run/utmp,/var/log/wtmp,/var/log/btmp, and/var/log/lastlog. -
who,w, andusersquery current logon users from/var/run/utmp. -
lastqueries current and historical logon users from/var/log/wtmp. -
lastbqueries failed logon attempts from/var/log/btmp. -
lastlogqueries the most recent logon of each user from/var/log/lastlog.
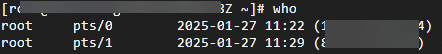
who
The who command queries current logon users. Sample output:
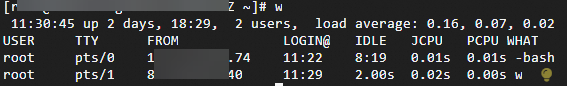
w
The w command queries the current logon user and their active tasks. Sample output:
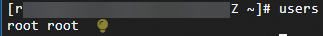
users
The users command queries the usernames of current logon users. Sample output:
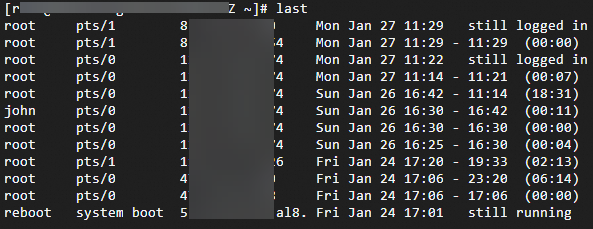
last
The last command queries all historical logon records. Sample output:
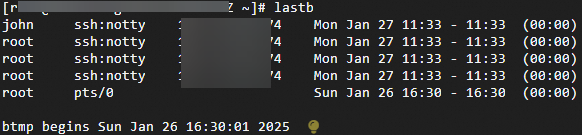
lastb
The lastb command queries failed logon attempts. Sample output:
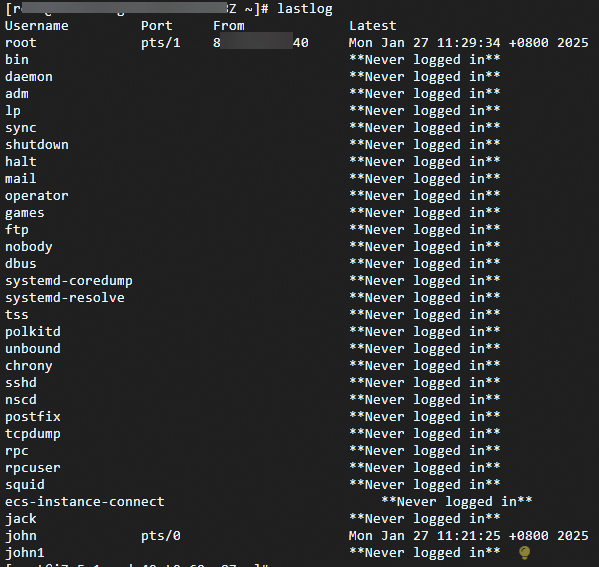
lastlog
The lastlog command queries the most recent logon of each user. Sample output:
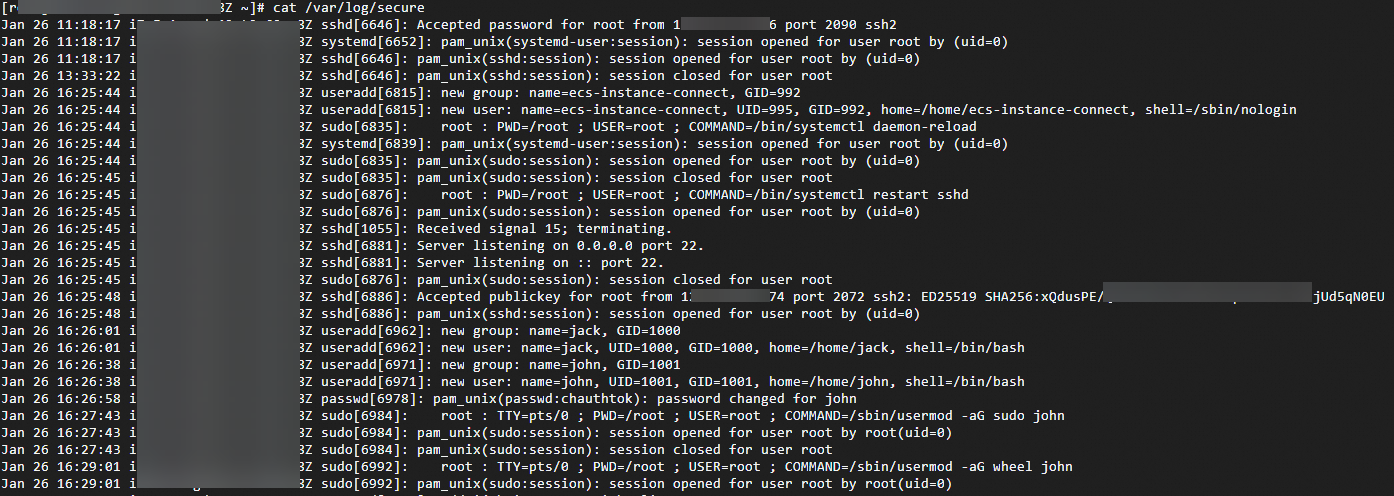
cat /var/log/secure
The cat /var/log/secure command queries all user logon records. Sample output:
User management
Manage system users and permissions with useradd, wheel, passwd, and userdel.
useradd
Command
The useradd command creates users. Verify with cat /etc/passwd | grep username.
-
Requires root or sudo permissions.
-
Set a password for the user after creation.
-
Primary and supplementary groups must exist before user creation.
Common options
|
Option |
Description |
|
-d |
Home directory. Default: |
|
-m |
Creates the home directory. Use with |
|
-s |
Logon shell. Default: |
|
-g |
Primary group. The group must exist. |
|
-G |
Supplementary groups. Separate multiple groups with commas (,). |
|
-p |
Encrypted password. Example: |
|
-u |
Numeric user ID. |
|
-e |
Account expiration date in YYYY-MM-DD format. |
Examples
-
Create user
jackwith a custom home directory and shell.useradd -m -d /home/jack -s /bin/bash jackVerify the user by running
cat /etc/passwd | grep jack:jack:x:1000:1000::/home/jack:/bin/bashSet a password for the user:
passwd jack -
Create user
alicein thedeveloperssupplementary group.useradd -m -G developers alice -
Create user
bobwith user ID 1001.useradd -m -u 1001 bob -
Create a user with root permissions:
ImportantGrant root permissions only when required.
-
Create user
john.useradd john -
Set a password.
passwd john -
Add the user to the
wheelgroup to grant sudo permissions. Rungrep '^wheel:' /etc/groupto verify membership.sudo usermod -aG wheel john -
Test sudo permissions. Switch to the new user and run a
sudocommand.su - john sudo ls /rootIf prompted for a password and the
/rootdirectory contents are displayed, the user has sudo permissions and can be used for remote logon. -
(Optional) Edit the sudoers file to add specific permissions.
sudo visudo
-
userdel
Command
The userdel command deletes users.
Common options
|
Option |
Description |
|
-r |
Deletes the home directory and its files. |
|
-f |
Forcefully deletes the user even if logged on. |
Examples
-
Delete user
john.Switch to root and query the home directory with
cat /etc/passwd | grep john:john:x:1001:1001::/home/john:/bin/bashDelete user
johnbut retain the home directory:userdel john -
Delete user
johnalong with the home directory and files.userdel -r username -
Forcefully delete a user.
userdel -f username
wheel
Command
wheel is a user group that controls access to the su command for switching to root.
-
The
wheelgroup exists by default. If not, create it withsudo groupadd wheel. -
By default, any user can run su and enter the root password to switch to root.
-
To restrict root access, configure the wheel group so only its members can use su to switch to root.
Examples
-
Check whether a user belongs to the wheel group.
groups username -
Add the user to the wheel group.
sudo usermod -aG wheel usernameRun
visudoto edit/etc/sudoers. The line%wheel ALL=(ALL) ALLallows wheel group members to usesudofor all commands.To allow passwordless sudo for wheel members, change the line to:
%wheel ALL=(ALL) NOPASSWD: ALL