This topic describes how to quickly locate specific assets when exceptions occur. For example, the volume of your business traffic at the Internet border exceeds the purchased protected bandwidth, and sudden bandwidth increases and decreases occur. This allows you to manage your assets in a fine-grained manner.
Calculation of traffic at the Internet border
When Cloud Firewall processes traffic at the Internet border, the greater value between the peak inbound traffic and peak outbound traffic is used for statistics collection. The following list describes the formulas that are used to calculate the total inbound and outbound traffic:
Inbound traffic = Traffic of requests exposed on the Internet + Traffic of responses exposed on the Internet
Outbound traffic = Traffic of requests in outbound connections + Traffic of responses in outbound connections
The peak traffic of Cloud Firewall is aggregated within a specified period of time. The total traffic at a specific point in time is the sum of the request traffic and the response traffic at the point in time. The peak traffic of requests and the peak traffic of responses are collected within the specified period of time. The two peak traffic values can be generated at the same point in time or at different points in time. Therefore, the total traffic at a specific point in time is less than or equal to the sum of the peak request traffic and the peak response traffic.
Scenarios in which unusual traffic identification is required
If peak or bottom traffic anomalies occur, you need to locate the IP addresses of abnormal assets and learn the details of service access. For example, the volume of your business traffic exceeds the purchased protected bandwidth, and you need to locate the IP addresses of specific assets.
Procedure
Step 1: Check the direction of unusual peak traffic among total traffic
Log on to the Cloud Firewall console. In the left-side navigation pane, click Overview.
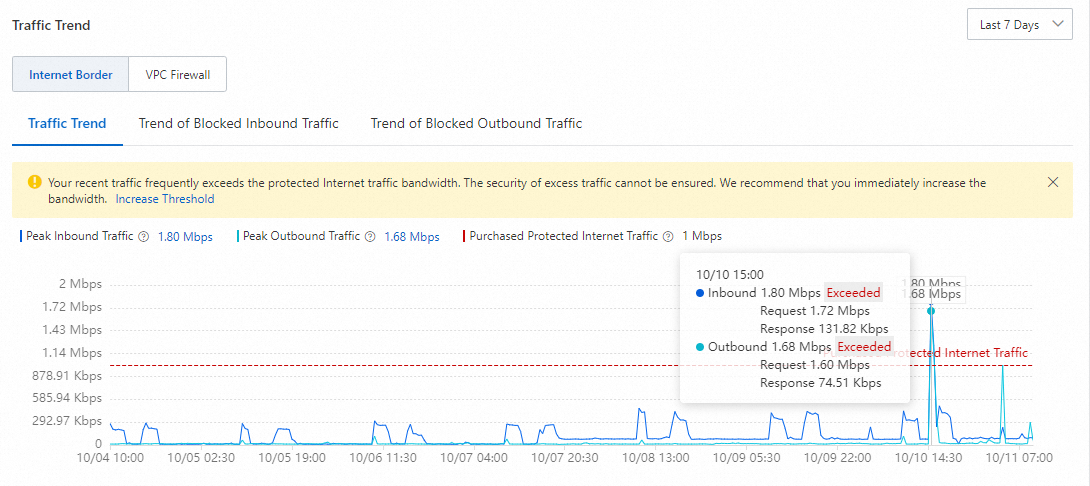
On the Overview page, view the traffic trend and find the point in time at which unusual peak inbound or outbound traffic exists.
For example, the following figure shows that the volume of both peak inbound and outbound traffic at 15:00 on October 10 exceeds the purchased protected bandwidth.
NoteIf the purchased protected bandwidth is exceeded, it is displayed on the trend chart. This allows you to identify the excess traffic.
Step 2: Locate IP addresses of abnormal assets based on the peak traffic of requests and the peak traffic of responses in the inbound or outbound direction
The following example shows how to identify unusual inbound traffic. You can identify unusual outbound traffic in the same manner. The only difference is that the position of the trend charts for inbound and outbound traffic varies. The trend chart of inbound traffic is displayed on the tab. The trend chart of outbound traffic is displayed on the tab.
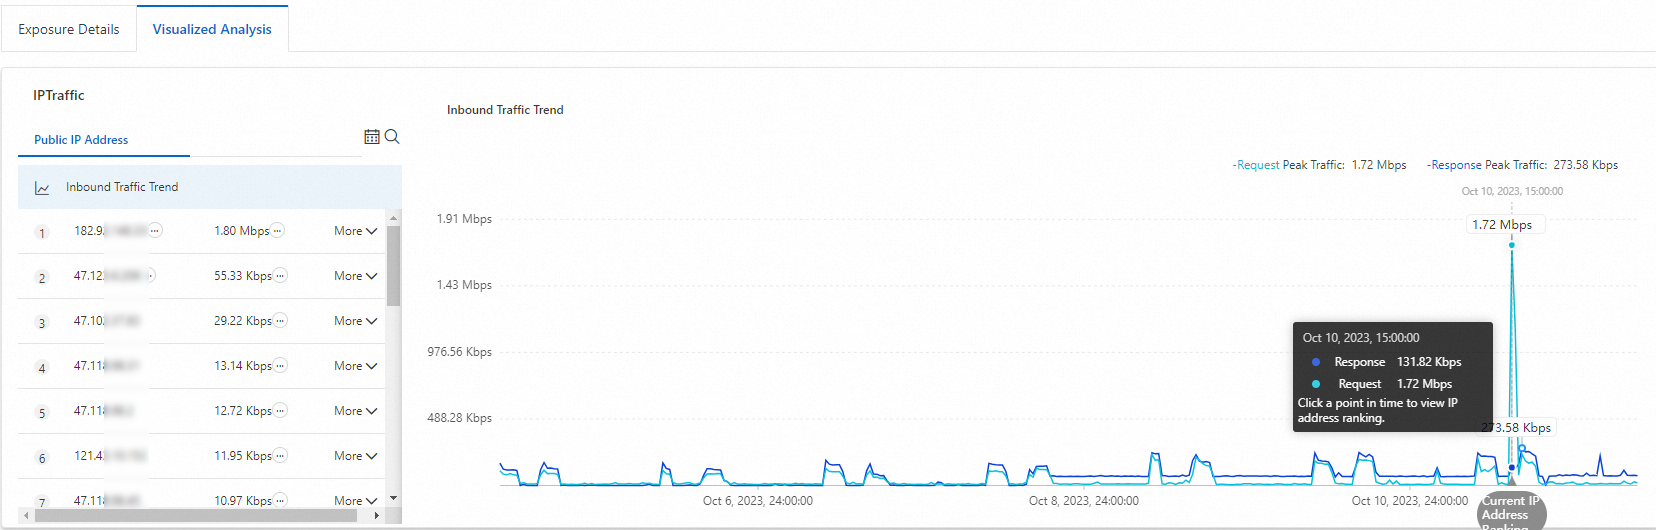
In the Traffic Trend section of the Overview page, click the value of Peak Inbound Traffic to go to the tab. On this tab, view the peak inbound traffic at 15:00 on October 10.
Click the time point of 15:00 on October 10 on the trend chart to view the traffic ranking of your business assets at the point in time. You can locate abnormal assets based on the traffic ranking result.
ImportantWe recommend that you specify a time range within the previous 24 hours. This allows Cloud Firewall to display traffic statistics at a minute granularity.
The asset with the IP address 182.92.XX.XX is identified as abnormal, as shown in the following figure. The asset is identified as abnormal because the total traffic of the asset at the point in time is much higher than the traffic of other assets.
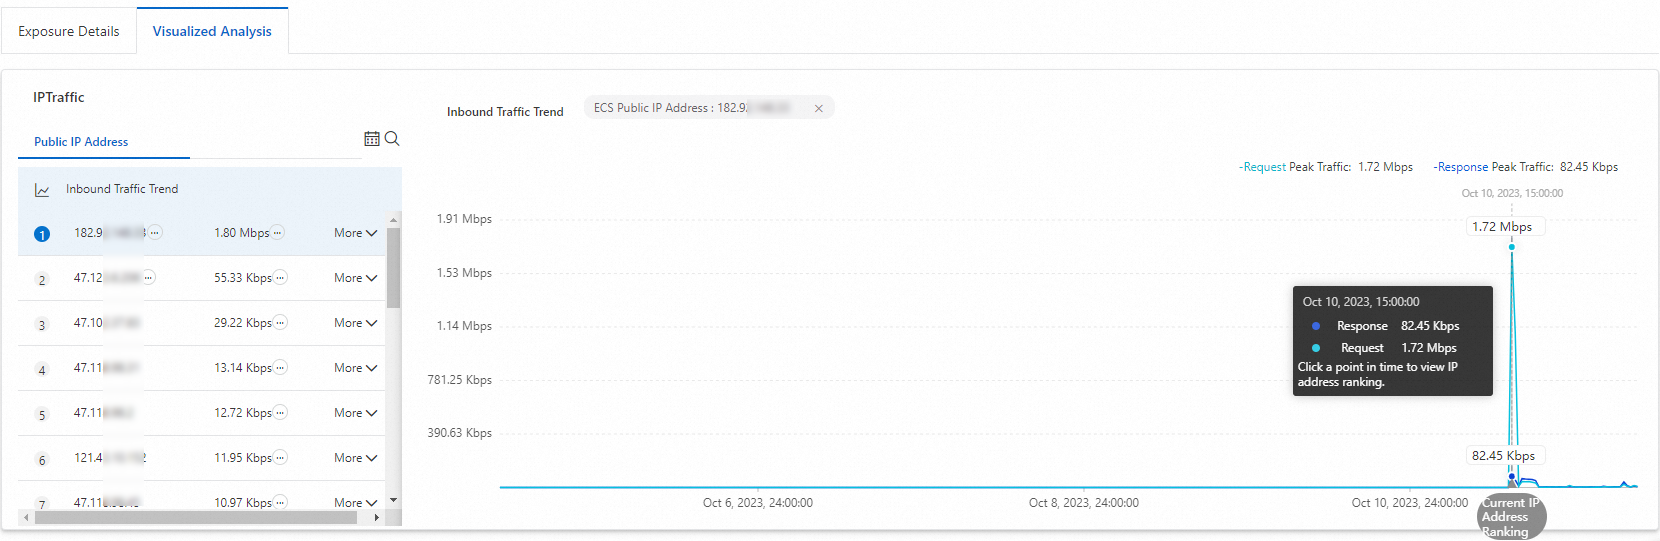
If you want to view the traffic details of the asset that is identified as abnormal, click the IP address of the asset. The right-side trend chart displays the traffic statistics of requests and responses for this asset.
Step 3: Use log audit results to check whether unusual traffic meets your business requirements
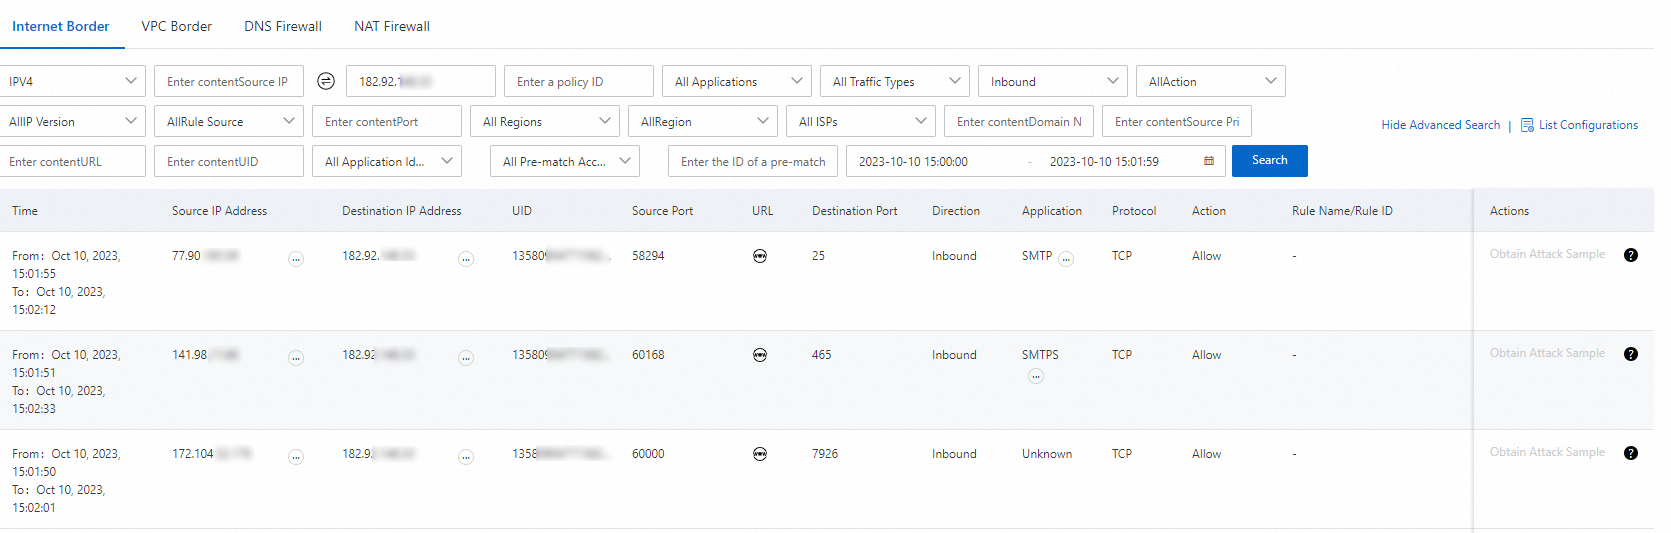
In the ranking list of public IP addresses, find an IP address and choose . On the tab, specify 182.92.XX.XX as the destination IP address and 15:00, October 10 in the time and date picker.
In the log audit result, view the source IP address, source port, and destination port, and determine whether the traffic is required in your workloads.
You can perform the following operations:
Increase the protected bandwidth of Cloud Firewall
For more information, see Renewal.
Optimize business deployment
For example, if your business needs to access Object Storage Service (OSS) or Simple Log Service, we recommend that you use an internal endpoint to reduce the consumption of Internet bandwidth resources. For more information, see Regions and endpoints and Endpoints.
Disable firewalls for IP addresses that you no longer want to protect
For more information, see Disable the Internet firewall.
How do I query unusual traffic by using SQL statements?
If you want to query all traffic of abnormal assets, you can execute SQL statements on the tab.
Query all destination IP addresses and ports that an abnormal IP address accesses, and sort the query results by traffic in descending order
log_type:internet_log and src_ip:182.92.XX.XX | select dst_ip,dst_port,app_name,sum(in_packet_bytes) as in_B,sum(out_packet_bytes) as out_B,sum(total_packet_bytes) as total_B,array_agg(distinct if(url='', domain, url)) as url group by dst_ip,dst_port,app_name order by total_B descIn this example, 182.92.XX.XX is the abnormal IP address.
Query all source IP addresses and ports that access an abnormal IP address over the Internet, and sort the query results by traffic in descending order
log_type:internet_log and dst_ip:182.92.XX.XX | select src_ip,dst_port,app_name,sum(in_packet_bytes) as in_B,sum(out_packet_bytes) as out_B,sum(total_packet_bytes) as total_B,array_agg(distinct url) as url group by src_ip,dst_port,app_name order by total_B descIn this example, 182.92.XX.XX is the abnormal IP address.
What to do next
View the trend of the total traffic of your assets, and check whether the total traffic exceeds the protection scope of Cloud Firewall. For more information, see Overview.
View information about traffic from your assets to the Internet, including the trace information about unusual outbound traffic, destination addresses, and outbound connection data of Internet-facing and internal-facing assets. For more information, see Outbound connection.
View information about traffic from the Internet to your assets, including the trace information about unusual inbound traffic, open public IP addresses of your assets, open ports, open applications, and number of public IP addresses for cloud services. For more information, see Internet Exposure.
View information about traffic at the Internet border, including the source IP address, destination port, protocol, policy action, number of bytes, and number of packets. For more information, see Log audit.
Query the raw logs of traffic at the Internet border by using SQL statements. For more information, see Query logs.